Introduction
Environmental air quality is a major factor affecting human health; the presence of toxic gases in the air has been found to be responsible for serious respiratory illness [Reference Zhang, Luo, Han, Lv, Chen, Shen, Wu, Pan, Ye, Zhang, Luo, Han, Lv, Chen, Shen, Wu, Pan and Ye1]. Volatile organic compounds (VOCs) are ever-increasing in our environment as they find more and more applications in our day-to-day activities, and some of them, such as formaldehyde, are known to be toxic to humans. VOC detection also finds application in noninvasive medical diagnosis. Hence, the detection of VOC has become an important aspect of current day research [Reference Zhang, Qu, Mohammadi, Mei and Diao2, Reference Xu and Yan3]. Many active materials and techniques have been developed for the detection of VOCs [Reference Zhang, Zhang, Liu, Zhang, Zhang and Liu4, Reference Zilberstein, Zilberstein, Zilberstein, Maor, Baskin, Zhang and Righetti5, Reference Wang, Li, Ni, Wang, Liu, Wang and Guo6, Reference Wang, Chi, Gao, Lv, Chu, Wang, Zhou and Yang7, Reference Pötzelberger, Mardare, Uiberlacker, Hild, Mardare and Hassel8].
Semiconductor metal oxides (SMOs) have shown promising application as resistive gas sensors as the resistance of these SMOs change sharply upon adsorption of a specific analyte (VOC vapor or gas) [Reference Barsan, Koziej and Weimar9]. In recent years, nanometer scale SMOs having various size and shape have gained much interest in a number of applications including gas sensors due to their size-dependent properties [Reference Dey10, Reference Chu, Dai, Liang, Bhattacharya, Dong and Epifani11, Reference Chu, Wang, Bai, Dong and Sun12, Reference Chu, Wang, Bai, Dong, Sun and Zhang13, Reference Ranjan, Tiwary, Chakraborty and Ajay14, Reference Chatterjee, Samanta, Dey, Chatterjee, Santra, Guha and Chakraborty15, Reference Gupta Chatterjee, Chatterjee, Ray and Chakraborty16, Reference Tiwary, Mahapatra and Chakraborty17, Reference Chakraborty, Chakrabarty, Senapati and Chakraborty18, Reference Augustyn19, Reference Wang, Leng, Han, Shao, Wei, Liu, Lian and Jiang20, Reference Pearson21]. Barium Stannate (BaSnO3, BSO) is one such SMO which, despite having shown its potential as sensor [Reference Ostrick, Fleischer, Lampe and Meixner22, Reference Lampe, Gerblinger and Meixner23, Reference Lampe, Gerblinger and Meixner24, Reference Reddy, Manorama, Rao, Lobo and Kulkarni25, Reference Lu, Jiang, Zhou and Gong26, Reference Tao, Gao, Liu and Sørensen27], has not been well explored for sensor application. For example, BSO thin films, prepared through radio frequency sputtering, as reported by Ostrick et al., showed a good response to reducing gases (isobutene, H2, NO, CH4, CO, etc.) at temperatures lower than 700 °C [Reference Ostrick, Fleischer, Lampe and Meixner22]. Lampe et al. reported the use of BSO thin films, deposited on an Al2O3 substrate through reactive sputtering, as NO sensor in the temperature range of 450–550 °C and as CO sensor in the temperature range of 600–700 °C [Reference Lampe, Gerblinger and Meixner23, Reference Lampe, Gerblinger and Meixner24]. Reddy et al. investigated the effect of additives such as Pt, Pd, Rh, Ru, and Ag on the sensitivity of BSO, prepared by thermal decomposition of precursor salts followed by calcination at 1400 °C for 1 h, toward gases such as LPG, CO, and CH4 [Reference Reddy, Manorama, Rao, Lobo and Kulkarni25]. The response time of the sensor, toward the mentioned gases, with different catalytic additives, was also studied. Lu et al. measured the electrical conductivity of Sb-doped BSO, synthesized by milling, calcination at 1100 °C, pressing, and firing in a muffle furnace at 1300–1400 °C, as a function of partial pressure of O2 at elevated temperatures in the range of 843–1000 °C [Reference Lu, Jiang, Zhou and Gong26]. Tao et al. reported the change in conductance of BSO, obtained from chemical precipitation followed by calcination at various temperatures, in the presence of air while operating in the temperature range of 200–550 °C, with conductance reaching a peak value at 290 °C; high response and good selectivity of BSO toward ethanol were also reported [Reference Tao, Gao, Liu and Sørensen27]. However, no studies have reported the formaldehyde-sensing properties of BSO, although formaldehyde detection is very important considering the associated potential hazards. Also, literature shows that doping of SMOs by various metal ions can alter the conducting properties of the SMO by creating defects [Reference Lu, Jiang, Zhou and Gong26], due to which, investigation of the influence of dopants on BSO is an interesting topic of research for sensor application.
Till now, BSO has been synthesized mostly using methods such as radio frequency sputtering [Reference Ostrick, Fleischer, Lampe and Meixner22, Reference Lampe, Gerblinger and Meixner23, Reference Lampe, Gerblinger and Meixner24], thermal decomposition [Reference Reddy, Manorama, Rao, Lobo and Kulkarni25], milling [Reference Lu, Jiang, Zhou and Gong26], chemical precipitation [Reference Tao, Gao, Liu and Sørensen27, Reference Ochoa, Schipani, Aldao, Rodríguez-Páez and Ponce28], solid-state reaction [Reference Zhang, Tang and Ye29], and thermal precipitation [Reference Buscaglia, Leoni, Viviani and Buscaglia30], which have their own limitations. Electrospinning is a very popular method for production of nano-to-microscale fiber mats as this technique provides many advantages in controlling the properties of the synthesized material such as high specific surface area, tunable morphology, and surface chemistry [Reference Karakas31, Reference Patil, Mali, Kamble, Hong, Kim and Patil32]. In this technique, the flow of a polymer solution is controlled by a syringe pump under high voltage maintained between the needle and metal collector surface acting as electrodes. Properties of the solution, the electrical parameters of the setup, and ambient conditions significantly affect the electrospinning process and properties of the synthesized material [Reference Bhardwaj and Kundu33]. As a consequence, it has gained a lot of attention in recent times, as is evident from the increase in patents and publication in areas such as energy engineering, tissue engineering, life sciences, and sensors [Reference Kannan, Cha and Hosie34, Reference Huang, Zhang, Kotaki and Ramakrishna35]. However, there are no reports on the synthesis of BSO tubes using electrospinning, and hence, considering the necessity of large surface area for good sensing response of the sensor material, it is expected that electrospinning-synthesized BSO tubes could exhibit excellent sensing properties to VOCs, including formaldehyde. Further, since the electrical conductivity of semiconductors can be significantly altered by introducing dopants, doping BSO tubes with appropriate dopants is likely to improve the sensing response of BSO sensors.
In view of the above, here we report the synthesis of BSO and La3+-doped BSO microtubes through electrospinning for application in formaldehyde sensor. The choice of La as dopant was based on its widespread use in recent literature as a dopant in SMOs for a number of applications [Reference Chakrabarty and Chakraborty36]. The as-prepared LBSO samples of different dopant concentration were tested for sensing of formaldehyde vapor within a large temperature window to identify the optimum operating temperature as well as the optimum dopant concentration. The optimally doped LBSO sample (4 wt% La) was further characterized by a number of techniques for structural, optical, and chemical information which were correlated to its good sensing properties.
Results and discussion
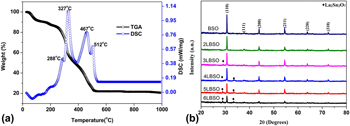
The TG-DSC curves of precursors used for sample preparation have been illustrated in Fig. 1(a). As is evident from Fig. 1(a), the precursors go through several steps of weight loss. The first weight loss occurs between room temperature (25 °C) and 85 °C, accompanied by an endothermic peak which originates from the removal of the adsorbed impurities. The second weight loss occurs between 85 and 200 °C, accompanied by an exothermic peak corresponding to the removal of the structural water from the salts. The third weight loss occurs during heating from 200 to 400 °C, with a weight loss of approximately 30%, accompanied by two exothermic peaks. Within this temperature range, the first peak at 288 °C indicates the decomposition and subsequent vaporization of DMF and PVP, whereas the second peak at 327 °C results from the decomposition of the metallic salts leading to the formation of BaO, SnO2, and La2O3 as well as loss of NO2 and HCl gases. The sample then goes through a phase transition in the temperature range of 400–500 °C, resulting in the formation of BaSnO3 [Reference Tao, Gao, Liu and Sørensen27, Reference Ochoa Muñoz, Ponce and Rodríguez Páez37, Reference Lu and Schmidt38]. Another phase transition occurs in the temperature range of 500–550 °C, marked by an exothermic peak resulting from the formation of La2Sn2O7. The reactions involved in the synthesis process are shown as follows:
 $$2{\rm{Ba}}{\left( {{\rm{N}}{{\rm{O}}_3}} \right)_2}\buildrel \Delta \over \longrightarrow 2{\rm{BaO}} + 4{\rm{N}}{{\rm{O}}_2}\left( \uparrow \right) + {{\rm{O}}_2}\left( \uparrow \right)\quad ,$$
 $${\rm{SnC}}{{\rm{l}}_4} \cdot {\rm{5}}{{\rm{H}}_{\rm{2}}}{\rm{O}}\buildrel \Delta \over \longrightarrow {\rm{Sn}}{{\rm{O}}_2} + 4{\rm{HCl}}\left( \uparrow \right) + 3{{\rm{H}}_{\rm{2}}}{\rm{O}}\quad ,$$
 $${\rm{La}}{\left( {{\rm{N}}{{\rm{O}}_3}} \right)_3} \cdot 6{{\rm{H}}_{\rm{2}}}{\rm{O}}\buildrel \Delta \over \longrightarrow {\rm{L}}{{\rm{a}}_2}{{\rm{O}}_3} + {\rm{N}}{{\rm{O}}_2}\left( \uparrow \right) + {{\rm{H}}_{\rm{2}}}{\rm{O}}\quad ,$$
 $${\rm{BaO}} + {\rm{Sn}}{{\rm{O}}_2}\buildrel \Delta \over \longrightarrow {\rm{BaSn}}{{\rm{O}}_3}\quad ,$$
 $${\rm{L}}{{\rm{a}}_2}{{\rm{O}}_3} + 2{\rm{Sn}}{{\rm{O}}_2}\buildrel \Delta \over \longrightarrow {\rm{L}}{{\rm{a}}_2}{\rm{S}}{{\rm{n}}_2}{{\rm{O}}_7}\quad .$$
(a) TG-DSC curves of 4LBSO and (b) X-ray diffractograms of BSO and various LBSO samples; the peaks representing planes of La2Sn2O7 crystals are marked separately.
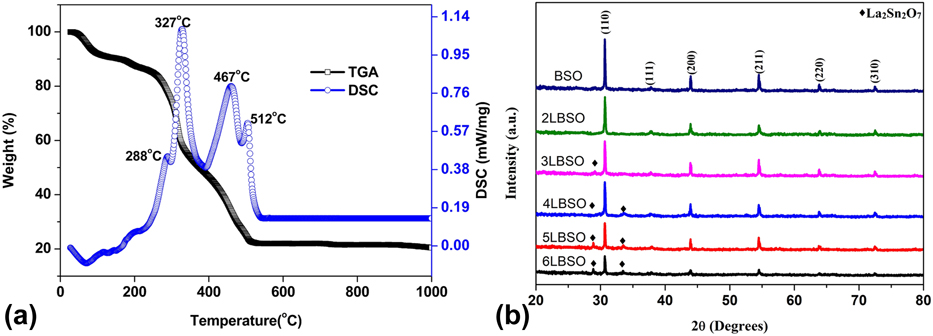
Figure 1(b) depicts the powder X-ray diffraction (XRD) patterns of BSO and LBSO samples in which peaks corresponding to planes (110), (111), (200), (211), (220), and (310) of cubic BaSnO3 (PDF#15-0780) phase can be identified at 2θ values 30.69°, 37.83°, 43.96°, 54.56°, 63.91°, and 72.56°, respectively, in all the samples. Two additional weak peaks are also observed for LBSO samples containing more than 2 wt% La3+ at 2θ values of 28.97 and 33.54 which correspond to (222) and (400) planes of cubic La2Sn2O7 phase (PDF#13-0082), respectively.
The crystallite size of the samples was calculated using the Debye–Scherrer formula. Addition of La3+ sharply reduced the crystallite size by a significant amount with the minimum size of 48.18 nm at 4 wt%, doping above which the size of the crystallites started to increase again. The crystallite size of the BSO was found to be similar to the previously reported crystallite size of 60.63 nm [Reference Chu39].
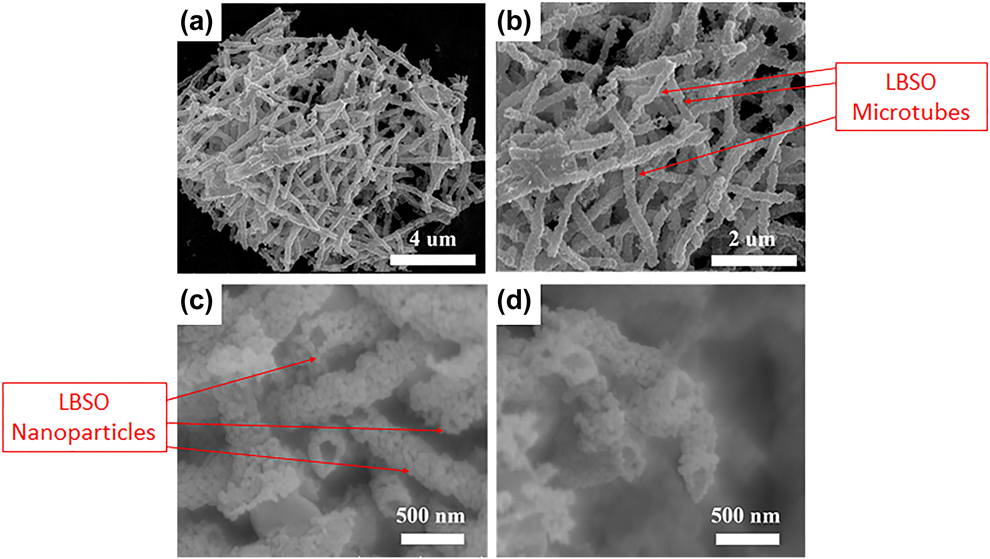
Rendered in Figs. 2(a)–2(d) are Field Emission Scanning Electron Microscope (FESEM) micrographs of 4LBSO nanoparticles at different magnifications. As is evident from the images, the LBSO microtubes were made out of smaller LBSO nanoparticle. Analysis of these images shows that, on average, the microtubes had a diameter of 280 nm and an average length of 2.5 µm, approximately. The average nanoparticle size was found to be ∼55 nm which agrees well with the crystallite size (∼48 nm) calculated from the XRD patterns.
(a)–(d) SEM micrographs of 4LBSO microtubes made from 4LBSO nanoparticles at various magnifications.
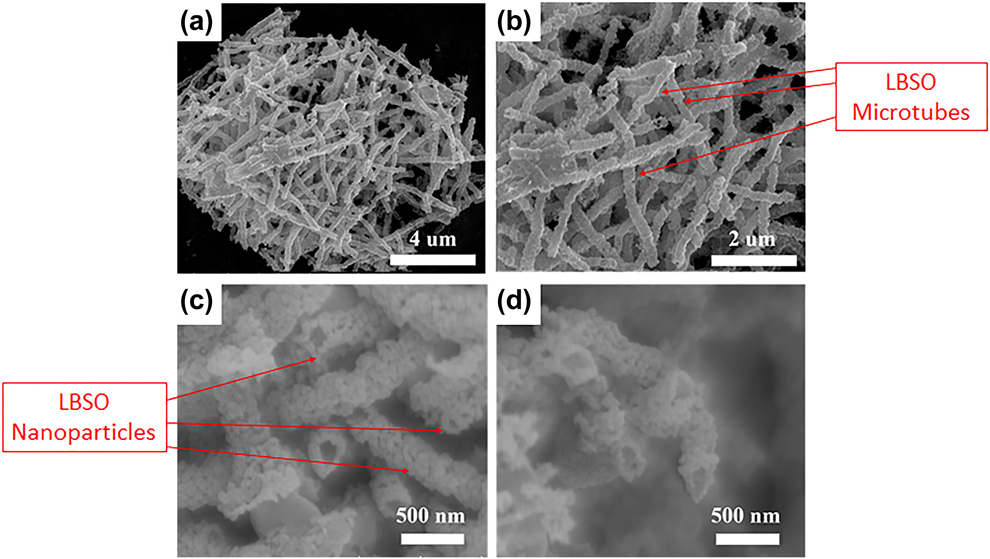
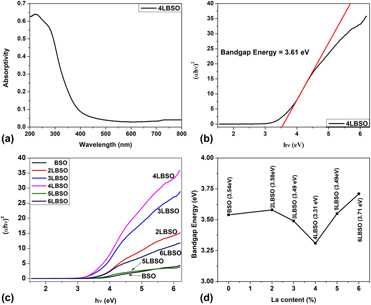
Figure 3(a) shows the UV-Vis diffused spectra of 4LBSO sample. A Tauc plot was drawn using the raw data of Fig. 3(a), as shown in Fig. 3(b). Subsequently, the electronic band gap of 4LBSO was found to be 3.61 eV. Figure 3(c) depicts the Tauc plots as obtained by converting the UV-Vis diffused spectra of each of the samples. It is evident from the intercepts with the x-axis that the band gap energy of the samples, as shown in Fig. 3(d), decreased initially with the addition of La3+, reaching a minimum value of 3.61 eV at 4 wt% La3+. Thereafter, the band gap energy was found to increase with the addition of La3+.
(a) UV-Vis diffused spectra of 4LBSO, (b) tauc plot obtained from UV-Vis diffused spectra of 4LBSO along with slope showing intercept at the x-axis, (c) tauc plots obtained from the UV-Vis diffused spectra of BSO samples with varying La3+ content, and (d) comparison of the values of energy band gap as obtained from Tauc plot for all BSO samples as a function of La3+ dopant concentration.
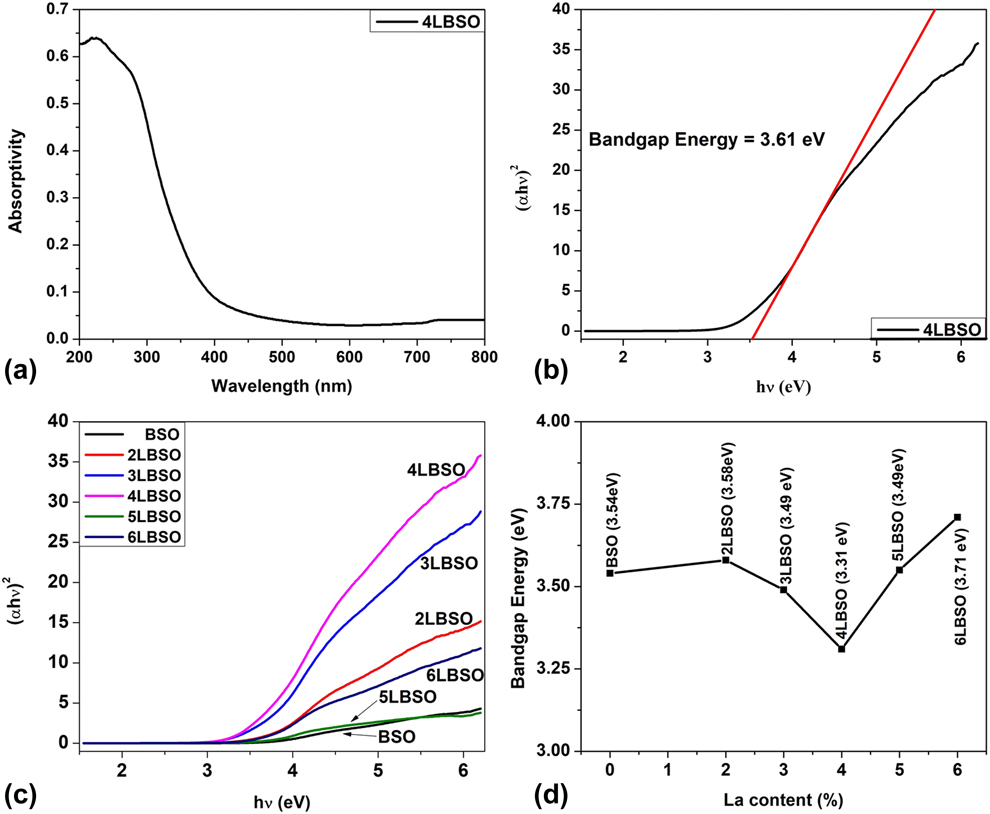
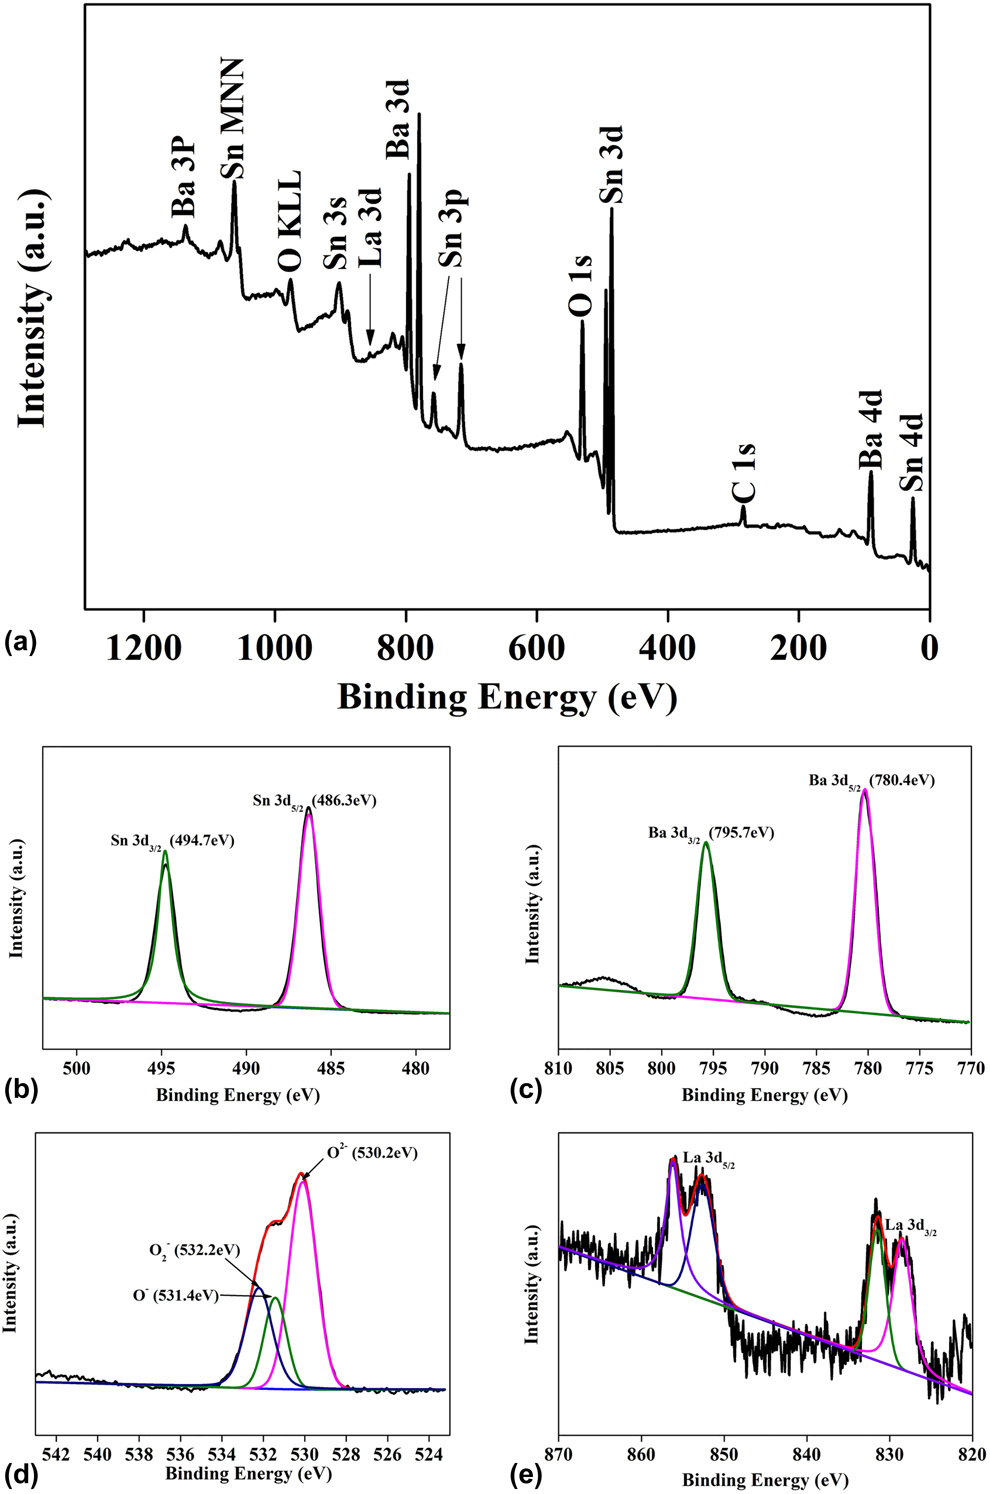
Figure 4(a) illustrates the X-ray Photoelectron Spectroscopy (XPS) survey spectrum of 4LBSO sample confirming the presence of Ba, Sn, La, and O in the sample. In addition, the spectrum also confirms the cleanliness of the sample as no impurity peaks apart from those due to C (adventitious) could be observed. All data were calibrated with respect to the position of the C 1s peak at 285 eV, observed due to the presence of adventitious Carbon, in accordance with the literature [Reference Watson, Coleman and Chakraborty40, Reference Butenko, Krishnamurthy, Chakraborty, Kuznetsov, Dhanak, Hunt and Šiller41].
XPS spectra of 4LBSO sample: (a) survey, (b) Sn 3d, (c) Ba 3d, (d) O 1s, and (e) La 3d spectra, respectively.
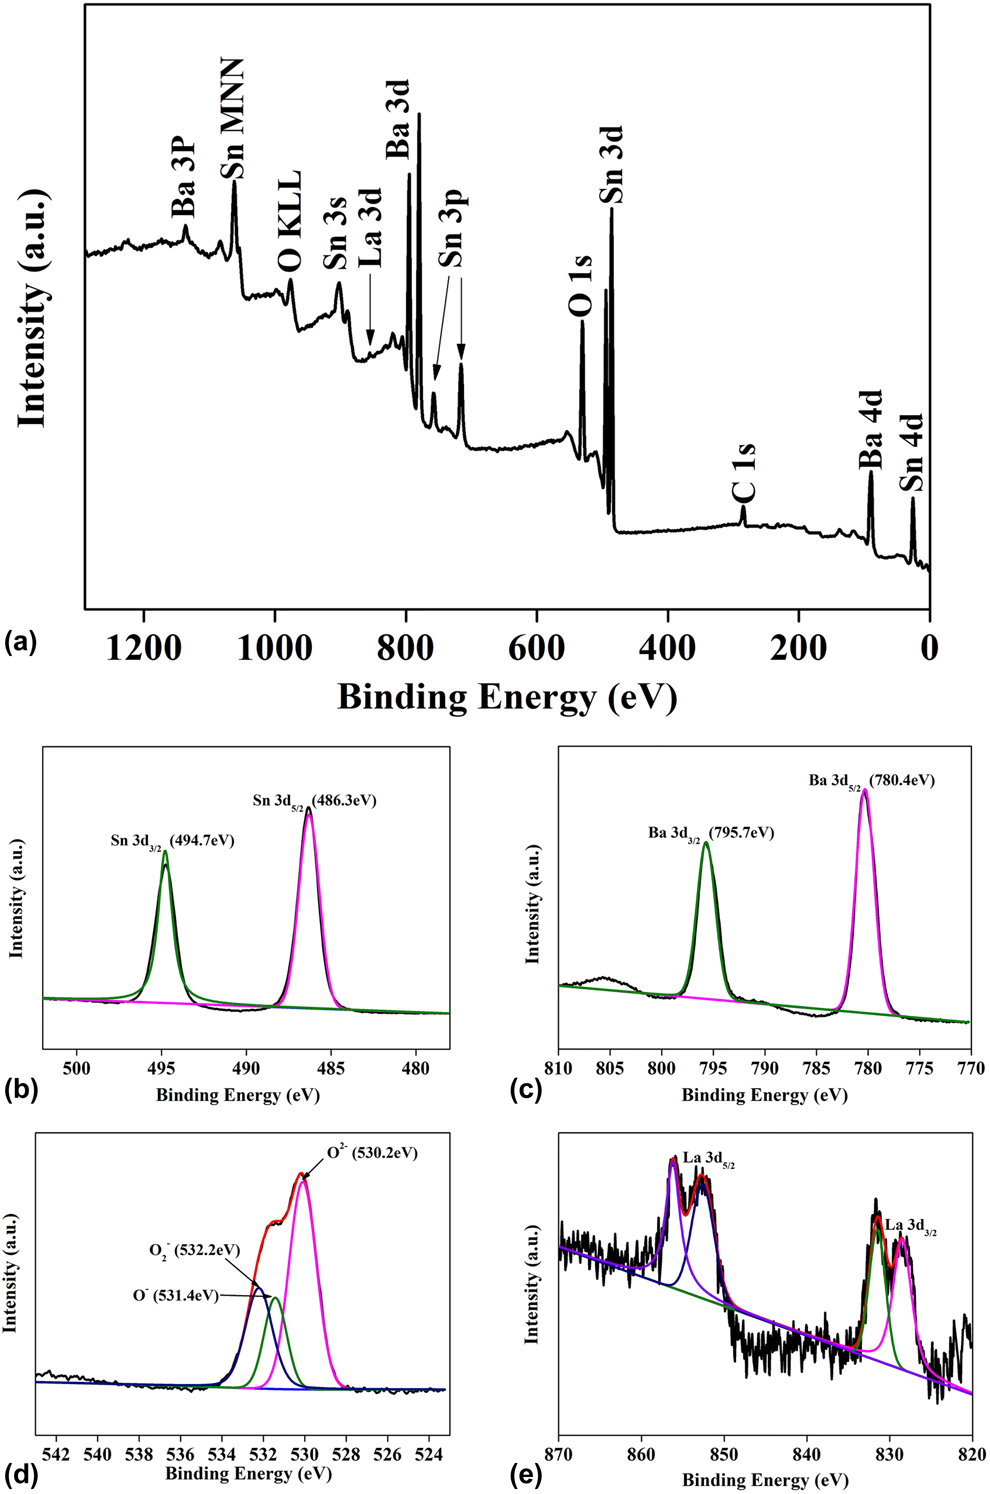
Figures 4(b)–4(e) plot the spectra obtained from Sn 3d, Ba 3d, O 1s, and La 3d core levels, respectively. The Sn 3d 5/2 and Sn 3d 3/2 peaks, shown in Fig. 4(b), were observed at 486.3 eV and 494.7 eV, respectively, with a peak separation of 8.4 eV in good agreement with literature suggesting Sn4+ states [Reference Nguyen, Ip, Jolinat and Destruel42]. The Ba 3d 5/2 and Ba 3d 3/2 peaks, shown in Fig. 4(c), were observed at binding energies of 780.4 eV and 795.7 eV, respectively, confirming the presence of Ba2+ oxidation state [Reference Nguyen, Ip, Jolinat and Destruel42]. The asymmetric peak in Fig. 4(d), can be deconvoluted into three peaks centered at 532.2, 531.4, and 530.2 eV, confirming the presence of chemisorbed oxygen species on the surface of BSO (O2−), oxygen vacancies (O−), and lattice oxygen species (O2−), respectively [Reference Gao, Ren, Cheng, Zhang, Xiang and Xu43, Reference Wang, Cui, Liu, Zhou, Cheng, Sun, Hu, Li, Zheng and Lu44]. The La 3d spectrum, shown in Fig. 4(e), was fitted such that the two components representing La 3d 5/2 are located at 835.2 and 838.86 eV, whereas the components due to La 3d 3/2 are located at 852.46 and 855.84 eV, thus, confirming the presence of La3+ ions in the sample. The two components of La 3d 5/2 and La 3d 3/2 result from spin–orbit interaction occurring separately in each spin–orbit component [Reference Sunding, Hadidi, Diplas, Løvvik, Norby and Gunnæs45].
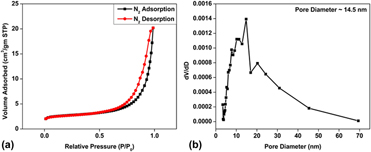
Figure 5(a) shows the N2 adsorption–desorption isotherm plots obtained by the Brunauer–Emmet–Teller (BET) method for 4LBSO. The specific surface area of the sample was calculated to be approximately 8.6 m2/gm, whereas a pore size diameter of about 14.5 nm for 4LBSO was obtained from analysis of Fig. 5(b).
(a) N2 adsorption–desorption isotherm plot for 4LBSO and (b) corresponding pore size distribution.

Analysis of gas-sensing response
The change in the resistance of the LBSO sensor caused by its exposure to formaldehyde was used to measure the sensor response using the following equation.
 $$S = {{{R_{\rm{a}}}} \over {{R_{\rm{g}}}}}\quad ,$$
where R a is the electrical resistance of the gas sensor in air and R g is the electrical resistance of gas sensor in the presence of the gas.
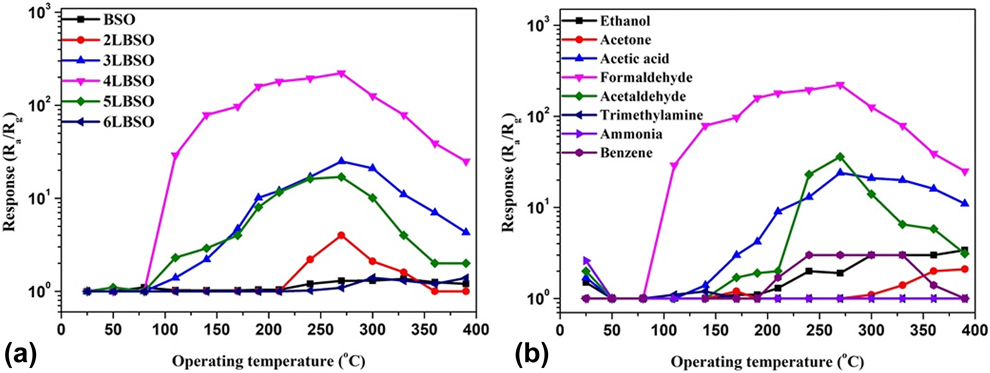
Figure 6(a) shows the response of all the samples to 1000 ppm concentration of formaldehyde at different temperatures. It can be seen that, above a threshold temperature of 75 °C, the formaldehyde-sensing response of 3LBSO, 4LBSO, and 5LBSO increased with increasing the temperature. Interestingly, the 2LBSO sample showed sensing response toward formaldehyde only after the temperature was raised above 210 °C. All samples showed their best response toward formaldehyde at an operating temperature of 270 °C above which it started to decrease, and 4LBSO sample showed the highest response (220) compared to all other samples tested.
(a) Influence of La content on the sensing response of the various BSO and LBSO samples when exposed to 1000 ppm concentration of formaldehyde as a function of temperature, and (b) response of 4LBSO to various VOCs at a concentration of 1000 ppm.
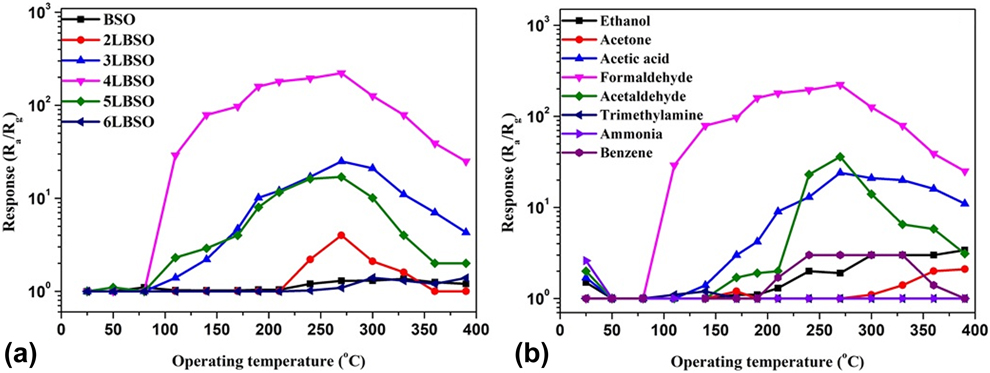
The response of 4LBSO sample to 1000 ppm of various VOCs as a function of temperatures has been illustrated in Fig. 6(b). It can be observed that 4LBSO showed some response to ammonia, acetaldehyde, acetic acid, and ethanol at room temperature which decreased rapidly as the temperature was increased and disappeared at 50 °C above which it increased again. Among all the VOCs tested, the best response was obtained at 270 °C to formaldehyde.
The selectivity of the sample, G, is defined as follows:
 $$G = {{{S_1}} \over {{S_2}}}\quad ,$$
where S 1 is the response of the sample to formaldehyde at a particular temperature and S 2 is the significant response shown to other gas at the same temperature. Using the data obtained from Fig. 6(b) in Eq. (7), we obtained G = 57.14 at 140 °C which is much higher than its value (6.29) obtained at 270 °C, thus confirming that the sample’s best selectivity is at 140 °C.
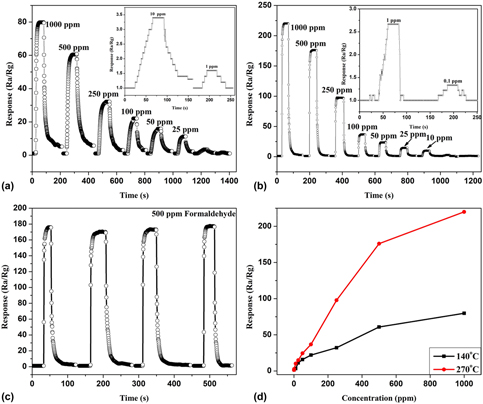
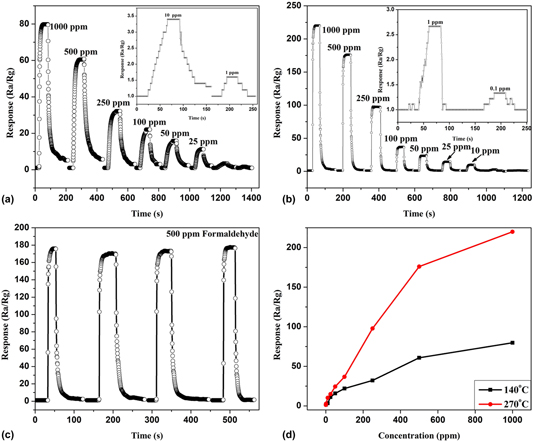
Figures 7(a) and 7(b) depict the response time plot for the 4LBSO sensor to different concentrations of formaldehyde at operating temperatures of 270 °C and 140 °C, respectively. Further, the 4LBSO sample showed a very low detection limit of 0.1 ppm, with a response of 1.33 at 270 °C and at 140 °C, it increased to 1 ppm with a response of 1.6. Figure 7(c) shows that the sensor response is highly reproducible at 270 °C even after five cycles, whereas Fig. 7(d) shows that the sensor response gradually rises as the concentration of formaldehyde is increased.
(a) Sensor response to various concentrations of formaldehyde at 140 °C, and (b) at 270 °C, (c) Repeatability of the sensor response at 270 °C, and (d) Sensor response versus concentration of formaldehyde at 140 and 270 °C.

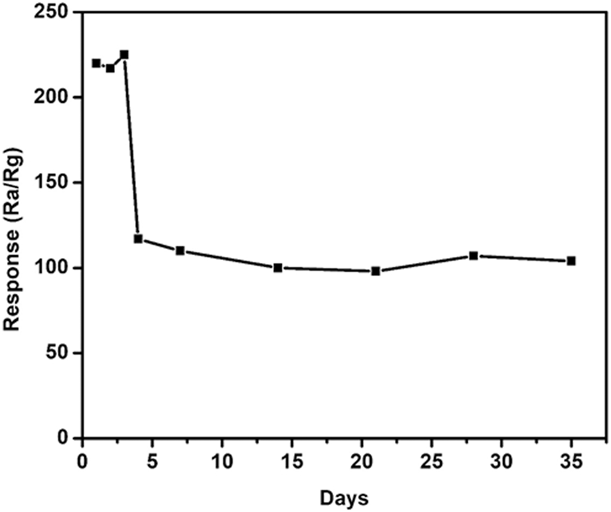
The stability of the sample has been shown in Fig. 8. The response of the sample remained stable in the range of 215–225 for 3 days following which the response declined to approximately half of the original value on the 4th day. The sample then maintained the modified response for a prolonged period of 31 days.
Stability of 4LBSO in responding to the presence of formaldehyde at 1000 ppm concentration.

Formaldehyde-sensing mechanism of LBSO
The sensing mechanism in metal oxide gas sensors is generally explained by the ionosorption of oxygen species on the SMO surface when operating in ambient air. In the temperature range between 100 and 200 °C, oxygen ionosorbs in a molecular (O2−) form and at higher temperatures the atomic form (O−) may be responsible since O2− has a lower activation energy than that of (O−) [Reference Li, Guo, Su, Jin, Tang, Huang, Huang, Li and Liu46, Reference Zhang, Zhang, Zhao, Zhu and Liu47, Reference Mishra, Murali, Kim, Kim, Lim, Kim, Sahay and Lee48, Reference Chen, Hong, Lin, Liu and Zhang49]. BSO being a wide band gap n-type semiconductor and due to its microfiber-like morphology combined with defects produced by La doping, favors the adsorption of oxygen species on its surface and subsequent adsorption of test gases. The adsorption of oxygen species on the surface of the LBSO based sensor, during heating, can be described by the following equation:
 $${{\rm{O}}_2}\left( {{\rm{ad}}} \right) \leftrightarrow {\rm{O}}_2^ - \left( {{\rm{ad}}} \right) \leftrightarrow 2{{\rm{O}}^ - }\left( {{\rm{ad}}} \right) \leftrightarrow 2{{\rm{O}}^{2 - }}\left( {{\rm{ad}}} \right)\quad .$$
As the adsorbed species capture electrons from the SMO, they bring about an increase in the resistance of the SMO caused by the enlargement of the space-charge region.
As the surface of the SMO is further exposed to an analyte gas, the analyte molecules adsorb on its surface which soon interacts with the preadsorbed O2− species. The following reaction, as reported by Wu et al. [Reference Wu, De Wang, Liu, Li and Zhou50], shows a possible exchange scenario that might occur on the surface of LBSO when it is exposed to formaldehyde:
 $${\rm{HCHO}}\left( {{\rm{ad}}} \right) + 2{{\rm{O}}^{2 - }}\left( {{\rm{ad}}} \right) \to {\rm{C}}{{\rm{O}}_2} + {{\rm{H}}_2}{\rm{O}} + 4{{\rm{e}}^ - }\quad .$$
This leads to a release of electrons that have been trapped by the adsorbed oxygen which in turn lowers the resistance of LBSO in accordance with our observation.
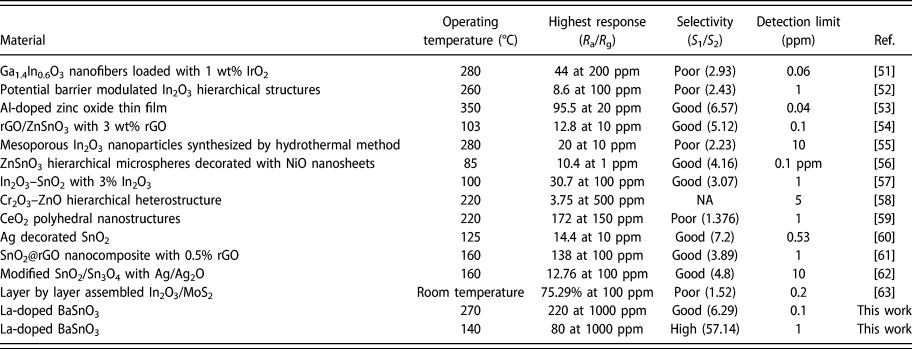
In order to understand the importance of this work with respect to previous reports on formaldehyde sensors, we have listed the main sensing parameters of this work and compared them with those of other reports in Table I.
A comparison of formaldehyde sensing properties of La-doped BaSnO3 and similar metal oxide-based sensors.

Conclusion
BSO and LBSO microtubes, with varying concentrations of La3+ dopant, were synthesized successfully through electrospinning. Characterization by multiple analytical techniques revealed the formation of microtubes having a length of 2.5 µm and a diameter of 280 nm, made up of ∼55 nm nanoparticles of LBSO. LBSO sample prepared with 4 wt% La3+ dopants showed the best response to formaldehyde vapor and at 270 °C, the sensor exhibited response as high as 220–1000 ppm concentration of formaldehyde. The response of the 4LBSO sensor decreased upon increasing and decreasing the temperature, and at 140 °C, it gave a response of 80. It was also noted that the detection limit of the sample was reduced to 0.1 ppm when operating at 270 °C with a response of 1.33, whereas the detection limit was 1 ppm when the sensor operated at 140 °C with a response of 1.6. The stability of 4LBSO reduced rapidly on the fourth day, following which the sample maintained its stability over a duration of 30 days, which signifies the potential of La3+-doped BaSnO3 for application as a stable formaldehyde sensor.
Materials and methods
Materials
Barium nitrate (Ba(NO3)2, 99.999%, Aladdin Chemicals, Ontario, California), tin(IV) chloride pentahydrate (SnCl4·5H2O, 99.999%, Aladdin Chemicals), lanthanum nitrate hexahydrate (La(NO3)3·6H2O, 99.999%, Aladdin Chemicals), polyvinylpyrrolidone (PVP, (C6H9NO)n, 99.999%, Aladdin Chemicals), and dimethylformamide (DMF, HCON(CH3)2, Aladdin Chemicals) were purchased and used without further purification.
Synthesis of undoped and La3+-doped BSO microtubes
Firstly, a solution of Ba(NO3)2 and SnCl4·5H2O was prepared by dissolving in a mixture containing DMF and ethanol in the ratio of 1:9. The solution was stirred for 30 min followed by addition of 10% PVP by weight in the solution. The solution was then stirred for 6 h to form a homogeneous solution. The obtained solution was then transferred into a syringe with a conventional single nozzle. Electrospinning was carried out at an applied voltage of 15 kV while the collection distance was 30 cm. The microtubes were collected on an Al foil and dried at a temperature of 95 °C for 4 h. The sample was then annealed under an oxidative atmosphere in a controlled temperature regime (heating @ 1 °C/min from room temperature to 700 °C, maintaining at 700 °C for 6 h and cooling down to room temperature @ 1 °C/min) to improve the crystallinity of the samples.
To prepare doped BSO samples, La(NO3)3·6H2O precursor was added in appropriate ratio along with the other precursors as above in the mixture of DMF and ethanol while keeping the rest of the procedure unchanged. The various samples thus prepared were named as BSO (undoped), 2LBSO (2 wt% La doped), 3LBSO (3 wt% La doped), 4LBSO (4 wt% La doped), 5LBSO (5 wt% La doped), and 6LBSO (6 wt% La doped).
Materials characterization
To understand the thermal behavior of the precursors thermogravimetric differential scanning calorimetry (TG-DSC), data were recorded in the temperature range of 25–1000 °C with a scan rate of 5 °C/min using a Netzsch STA449F3 system, Netzsch, Selb, Germany. Information on the crystallinity and phase composition of the samples was obtained by X-ray diffraction (XRD) analysis in a Bruker D8 diffractometer (Bruker, Billerica, Massachusetts) illuminated with Cu Kα radiation at a scan rate of 15°/min. The electron microscopic images of 4LBSO sample were obtained using a Hitachi S-4800 (Hitachi, Tokyo, Japan) Field Emission Scanning Electron Microscope (FESEM) at an accelerating voltage of 10 kV. The electronic band gap of the samples was compared by measuring the UV-Vis diffused absorption spectra in a Shimadzu UV-3600 spectrophotometer, Shimadzu, Kyoto, Japan. The elemental composition and oxidation states of the species present in the 4LBSO sample were analyzed by X-ray Photoelectron Spectroscopy (XPS) performed by a Thermo ESCALAB 250 XI spectrometer, Thermo scientific, Waltham, Massachusetts. The specific surface area of 4LBSO was evaluated by Micrometrics ASAP 2020 apparatus, Micrometrics, Norcross (Atlanta), Georgia.
Fabrication of gas sensor and gas-sensing property measurement
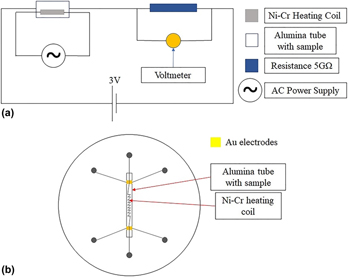
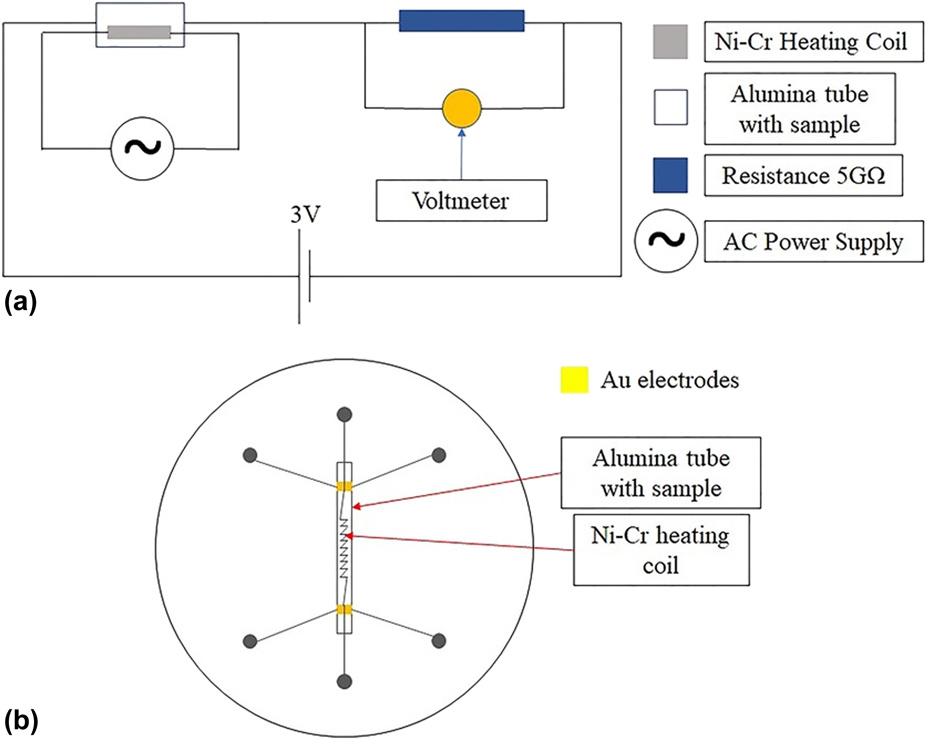
Figure 9(a) shows the schematic circuit diagram of the gas sensing measurement set up used in this work. The LBSO-based formaldehyde sensor was made by coating the exterior surface of an alumina tube with a slurry of the as-prepared LBSO microtubes obtained by dispersing in terpineol followed by drying at 80 °C for 10 h, a step necessary to remove the terpineol. The alumina tube had two gold contacts at two ends to enable resistance measurement across the LBSO film when connected with a multimeter. A Ni–Cr coil was inserted through the alumina tube to heat the sensor at temperatures in the range of 20–450 °C [Fig. 9(b)]. Gas sensing measurement was carried out at a relative humidity of 50% in a sealed chamber.
(a) Circuit used for gas sensing and (b) schematic diagram of a gas sensor.
Acknowledgments
This work was supported by NSFC (No. 61671019).