Implications
Feeding decisions are usually addressed by focusing on the behaviour of individuals. In group-living species, however, decision-making is made through collective processes. Such processes remain largely unexplored, although social interactions have been shown to interact with food preferences and environmental factors to determine the distribution of sheep and cattle on pastures. Lack of data is especially prejudicial for the management of grazing distribution in domestic herbivores. Herds often use heterogeneous grasslands unevenly, which can lead to resource degradation. This study investigates how social relationships and individual traits affect movement orders in domestic cattle and sheep. This is the first work analysing the effect of temperament on leadership and individual positions in spontaneous group movement in these two species.
Introduction
In ungulates, grouping tendency and social relationships influence foraging decisions and the distribution of herds and flocks in heterogeneous environments (Dumont and Boissy, Reference Dumont and Boissy1999). To collectively exploit the resources of their environment, animals make trade-offs between the motivation to stay with their social peers and the motivation to move away from the group for exploiting preferred food patches (Scott et al., Reference Scott, Provenza and Banner1995 and Reference Scott, Banner and Provenza1996; Dumont and Boissy, Reference Dumont and Boissy2000; Boissy and Dumont, Reference Boissy and Dumont2002; Sibbald et al., Reference Sibbald, Erhard, Hooper, Dumont and Boissy2006). Although conflicts of interest tend to disperse individuals, group-living animals usually succeed in reaching consensus decisions and travelling together (Conradt and Roper, Reference Conradt and Roper2005). Feeding decisions are usually addressed by focusing on the behaviour of individuals. In group-living species, however, decision-making is made through collective processes. Such processes remain largely unexplored. It has however been shown that social factors interact with food preferences, vegetation availability and knowledge of the foraging environment to determine the distribution of sheep and cattle on grasslands and rangelands (Scott et al., Reference Scott, Provenza and Banner1995 and Reference Scott, Banner and Provenza1996; Howery et al., Reference Howery, Provenza, Banner and Scott1998). Lack of data is especially prejudicial for the management of grazing distribution in domestic herbivores, as herds often use heterogeneous grasslands unevenly, which can lead to resource degradation. It has therefore been proposed that selecting livestock based on their grazing patterns, e.g. by culling animals with undesirable grazing patterns, could have the potential for improving the grazing distribution of the whole herd (Bailey et al., Reference Bailey, Dumont and WallisDeVries1998).
Previous studies of group movements in mammals focused on the first individual starting to move or taking the first position during travel. In some species, particular individuals lead the group more frequently than others. In packs of dwarf mongooses, the alpha female takes all decisions about routes, distances and sites (Rasa, Reference Rasa1987). In the mountain gorilla, the silverback male consistently decides on the moves (Schaller, Reference Schaller1963). In horses, dominant mares are usually found at the head of movements (Waring, Reference Waring1983). In bovids, no exclusive leader was reported but some females more often initiate movements and hold the front position (bison: McHugh (Reference McHugh1958); zebu: Reinhardt (Reference Reinhardt1983); cattle: Dumont et al. (Reference Dumont, Boissy, Achard, Sibbald and Erhard2005)). In a group of zebus, the cow displaying the greatest diversity of partners while grazing was more frequently observed in the first position (Reinhardt and Reinhardt, Reference Reinhardt and Reinhardt1981). In goats, leaders were females having the larger number of kin-related partners in the group (Escos et al., Reference Escos, Alados and Boza1993). Physiological needs also prompt individuals to look for target resources, with lactating females more often initiating or leading group movements toward water points in zebras (Fischhoff et al., Reference Fischhoff, Sundaresan, Cordingley, Larkin, Sellier and Rubenstein2007). Leadership in ungulates thus seems to be a distributed process since several individuals influence the decision-making process.
Temperament is a further factor liable to affect animal order in collective group movements. It has been defined by Mason (Reference Mason1984) as the ‘individual’s basic stance towards environmental changes and challenges’. So far, we lack information on how temperament influences the position of individuals in group movements. To test for potential correlations between temperament and animal orders, it is necessary to measure the behavioural traits of individuals in a different context than that of group movement. To our knowledge, only two studies have already provided such independent measurements. In a small group of ewes, the individuals which were the more vocal when separated from their peers were more often found in rear positions during forced group movements (Syme, Reference Syme1981), In domestic geese, Ramseyer et al. (Reference Ramseyer, Petit and Thierry2009a) observed that the individuals which were the most responsive to unpredictable noises were also those most often found in front positions during spontaneous group movements.
Few studies have considered the factors influencing individual positions during group movement in domestic ungulates. Most studies focused on forced group movements, i.e. movements that were initiated by human intervention. In forced group movements, animals can keep consistent positions, for instance, dominant individuals were more frequently observed in front in zebu cows (Reinhardt, Reference Reinhardt1983) or in central positions in ewes (Dove et al., Reference Dove, Beilharz and Black1974). The analysis of milking orders in farm environments also reveals a fair amount of consistency (dairy cows: Dickson et al. (Reference Dickson, Barr and Wieckert1967); ewes: Villagra et al. (Reference Villagra, Balasch, Peris, Torres and Fernandez2007); goats: Gorecki and Wojtowski (Reference Gorecki and Wojtowski2004)). Some authors having studied spontaneous group movements did not find consistent patterns for pigs (Meese and Ewbank, Reference Meese and Ewbank1973) and sheep (Dove et al., Reference Dove, Beilharz and Black1974), whereas others reported that some individuals were more frequently observed in front positions in cattle (Dumont et al., Reference Dumont, Boissy, Achard, Sibbald and Erhard2005) and goats (Escos et al., Reference Escos, Alados and Boza1993). No characterization of animal temperament was made in these last experiments.
In this study, we analysed spontaneous movements in a group of heifers and a group of ewe-lambs. For each species, animals were of similar age and grazing experience. We investigated whether (i) the position of individuals during group movements is other than random; (ii) the position of individuals during movements is affected by individual temperament traits; and (iii) affinity and dominance relationships influence patterns of group movement.
Material and methods
Animals and environment
A group of heifers and a group of ewe-lambs were available for this study. The first group was composed of 15 18-month-old Charolaises heifers (liveweight: 334 ± 8.7 kg) without family ties. Animals had been reared together in one group 6 months before the study began, at the Institut National de la Recherche Agronomique (INRA) farm of Laqueuille (45°39′N, 2°46′E). Each subject was identified by a coloured collar. From mid-May, heifers were released in permanent grassland pastures containing an automatic watering dispenser located along one side of the field and a salt stone at the opposite side. We used two fields of 6 and 18 ha to limit grass depletion.
The second group was composed of 19 1-year-old Romane ewe-lambs (liveweight: 45 ± 4.6 kg, i.e. in both species, the animals were at approximately two-thirds of their adult weight) without family ties. Animals were reared as a flock in a sheep pen for 3 months before the study at the INRA farm in Theix (45°43′N, 3°01′E). They were identified using blue and red painted numbers applied on both sides of the body and on the rump. From mid-June, ewe-lambs were released in a permanent grassland pasture of 5 ha. An automatic water dispenser was located along one side of the field and a salt stone on the opposite side.
Group movements
We focused on group movements occurring after a resting period. Both groups were observed in the field between 0630 h and 2100 h, excluding rainy days. The group of heifers was observed from May to October 2006. We completed a total of 234 h of observation over 39 recording days. We recorded 53 movements, 17 of them involving all group members, which according to Dumont et al. (Reference Dumont, Boissy, Achard, Sibbald and Erhard2005) should be sufficient to detect the preferential position of an individual in the front position in a group of 15 heifers.
The group of ewe-lambs was observed from June to September 2007. We completed a total of 256 h of observations in 36 recording days, which was similar to the observation duration for the group of heifers. We recorded 101 movements, 37 of them involving all group members.
During observations of heifers, observers remained still in the field at least 30 m away from the group. As ewe-lambs were quite reactive to the presence of humans, the observers were concealed on a 3-m high platform located in the centre of the field. Two observers continuously videotaped the behaviours of animals. The first observer videotaped the resting group before departure to record behaviours and latencies at departure. The second observer released her camera 30 min after the beginning of the resting period to record the behaviours of all moving individuals. Departure was defined by the movement of the first mover, i.e. the first individual to take six steps without making any stops with the head raised, or which started to graze. To identify departure, we required that none of the animals had moved during the minute preceding the start of the first mover. To ensure that animals were gathered before moving, we also required that heifers were no more than 50 m apart from each other and ewe-lambs were no more than 30 m apart from each other, during the 30 min preceding departure; actually, individuals at rest always met these criteria. We considered that a movement had ended when all individuals had stopped for at least 1 min.
For movements involving all group members, we determined the position of each animal at departure and during the movements, i.e. halfway between the departure and arrival points. We used positions to assess the immediate predecessor and follower of each individual. We built a succession matrix in which each cell provided the number of times an individual followed or preceded a given conspecific.
To identify preferential associations between individuals, we also analysed partnership in subgroups containing 2 to 5 heifers or 2 to 6 lambs moving together, which corresponds to one-third of group members. We built a matrix of association, providing in each cell the number of times when two individuals were present in the same subgroup.
Social relationships
We used the number of agonistic interactions in a given direction (an individual threats or blows another who withdraws) to recognize dominance relationships between pairs of heifers in the field using all-occurrence sampling. Since agonistic interactions between ewe-lambs were rare in the field, we used a food competition test indoors to determine the dominance hierarchy. Observations were made in a pen close to the familiar sheep pen, with a small trough fixed in a corner of the pen that was accessible by only one animal. A corridor system allowed moving animals to be tested by pair. When both animals were inside the pen, the door was closed. Then an observer poured 20 g of barley into the pen every 30 s during 2 min 30 s, totalling 100 g of food. The food was delivered using a pipe from outside the pen. Animals were tested 18 h after their last barley meal between 0800 h and 2400 h. We tested each individual four times a day with four different partners, a total of 190 pairs being tested within 5 days. All tests were videotaped. The higher-ranking individual in a dyad was recognized as the animal responsible for the majority of agonistic behaviours (threat, blow and preventing access to food) (Erhard et al., Reference Erhard, Fabrega, Stanworth and Elston2004). For two dyads no agonistic interactions occurred but only one individual was feeding and was therefore identified as the dominant. We ranked individuals in a dominance hierarchy using MatMan from the higher- to the lower-ranking individual (Noldus©, Wageningen, The Netherlands) (de Vries, Reference de Vries1995); we verified the linearity of the dominance hierarchy with the linearity coefficient (Appleby, Reference Appleby1983).
For both species we used positive interactions in the field, e.g. licking and rubbing for cattle (Bouissou and Andrieu, Reference Bouissou and Andrieu1978) and rubbing for sheep (Fisher and Matthews, Reference Fisher and Matthews2001), to assess affinitive relationships between pairs of individuals. We collected 792 positive interactions in heifers in 39 days and 107 events in ewes in 36 days using all-occurrence sampling. A matrix of affinity was built in which each cell contained the number of time each individual licked or rubbed another one.
Social traits
Three indices were calculated from behaviours collected in the field:
Friendship index
The friendship index of an individual was defined using its number of close partners. To define close partners, we required that at least 10 positive interactions occurred between two heifers and at least one between two ewes. These criteria were chosen according to the average number of interactions recorded in each group.
Cohesion index
Cohesion was measured at pasture during grazing periods. During a 1-h observation period, we scored the closest neighbour of each individual every 5 min using scan sampling. Observation periods were conducted over 10 days to insure independence of data, yielding 120 scans. This cohesion index matches the ‘sociability index’ defined by Sibbald et al. (Reference Sibbald, Elston, Smith and Erhard2005) as the number of times a subject was seen as the nearest neighbour of another one divided by 100. We opted for the term ‘cohesion index’ since it is more neutral when recording proximities between individuals.
Spatial independence index
Independence was measured at pasture during grazing periods. We identified the first individual that grazed away from the group during at least 30 s without monitoring behaviour, meaning that the individual maintained its head under horizontal. We arbitrarily decided that heifers have to graze at least 10 m away from other group members and that ewe-lambs have to graze at least 5 m away from others. We recorded only events separated by an interval of at least 30 min. This index measured the willingness of subjects to move away from their conspecifics.
Emotional traits
Three indices were calculated from behaviours observed in indoor trials. Each animal was individually tested in an arena test used to assess emotional reactions (see Forkman et al. (Reference Forkman, Boissy, Meunier-Salaün, Canali and Jones2007)). The arena measured 6 × 6 m2 for heifers and 3 × 3 m2 for ewe-lambs. Ground coverage was divided into nine equal squares to measure locomotor behaviours. A corridor system gave moving animals access to the arena that was surrounded by opaque fences. When an individual was inside the pen, the door was closed. All tests were videotaped.
Anxiety index
Animals entered the room for the first time. We measured subjects’ responses to an unknown environment and social isolation by recording the number of monitoring postures (raising head over horizontal line) during 5 min.
Novelty index
For the following tests, we accustomed animals to the room with a familiarization period; in a collective phase five individuals were placed in the room during 30 min for ewe-lambs and 2 h for heifers, then in an individual phase animals entered the room individually three times for 5 min, where they should feed on grain for a minimum of 30 s. After familiarization, animals entered the room where a pyramidal cone unknown to animals had been placed facing the door and inside the room. We measured the degree of boldness of subjects by recording their number of contacts with the object. Subjects, which avoided contact, scored zero.
Reactivity index
After a further individual familiarization phase, animals entered the room to feed on grain in the trough placed facing the door and inside the room. We measured the degree of reactivity from the latency to feed after emission of an acoustic or visual stimulus. A whistle was blown, 30 s after heifers began eating. If heifers did not eat again, the period was equal to the length of the test (60 s). As ewe-lambs could overreact to the whistle, instead we used a system whereby a panel fell behind the trough 15 s after animals began eating (Greiveldinger et al., Reference Greiveldinger, Veissier and Boissy2007); we recorded subjects’ responses to this sudden event as the number of monitoring postures until they came back to eat. If ewe-lambs did not eat again, the period was equal to the length of the test (300 s).
Statistical analyses
We processed Spearman correlations to assess the influence of dominance relationships on individual positions during movement and to measure concordance between mean rank orders, which run five times with different permutations to check the robustness of testing. To test the influence of preferential bonds on individual positions during movement, we performed partial correlation analyses using Kendall’s row-wise (Kr) tests (Hemelrijk, Reference Hemelrijk1990) between three matrices: matrix of succession, matrix of association in subgroups and matrix of affinity. We used Kr matrix correlation coefficients (t) and tests of significance based on 10 000 permutations. We computed them using MatMan software (Noldus©). We reported one-tailed P-values. We used χ 2 tests, Spearman rank correlation tests and Pearson partial correlations tests, two-tailed, performed using SPSS (version 10 for Macintosh).
We applied multiple regression analyses to test whether behavioural traits affected the positions of subjects as first mover and/or during group movements. We used R software (RFSC, version 2.6.2: http://www.R-project.org) to perform General Linear Models with a Poisson law since models were composed of a discrete dependent variable which was either the number of times an individual was the first mover or the mean order during movement. Independent variables were behavioural indices. We first verified the lack of colinearity between independent variables using the Variance Inflation Factor test. We considered group movements as independent events in the analyses. Significance level was set at 0.05.
Results
For heifers, the average speed of group movements was 0.02 m/s ± 0.06 (mean ± s.e.) and the distance travelled was 28 m ± 5. The speed of movements involving only some individuals was 0.22 m/s ± 0.07 and the distance travelled was 12 m ± 2. The activity of heifers before departure was resting. For movements involving the entire group, arrival activities were grazing (94.1%) and resting (5.9%). For movements involving only some individuals, arrival activities were grazing (69%), resting (24.1%) and drinking (6.9%). In ewe-lambs, the average speed of group movements was 0.18 m/s ± 0.03 (mean ± s.e.) and the distance travelled was 80 m ± 11. The speed of movements involving only some individuals was 0.55 m/s ± 0.06 and the distance travelled was 7 m ± 1. The activity of ewes before departure was resting. For movements involving the entire group, arrival activities were grazing (97.7%) and resting (2.3%). For movements involving only some individuals, arrival activities were grazing (27.1%), resting (45.8%), drinking (23.7%), monitoring (1.7%) and grooming (1.7%).
First movers and individual positions
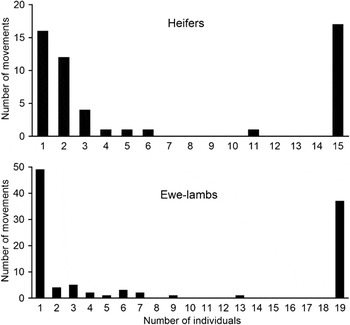
In heifers, 39% of the movements involved the entire group (Figure 1). Any heifer could be the first mover but nine were followed by the entire group at least once. Among them three individuals (H1, H7, H9) initiated 64% of these group movements, with one of them (H9) being at the origin of 38% of these movements. In ewe-lambs, 36% of the movements involved the entire group (Figure 1). Two of the 19 lambs had never been first movers and 11 of them were able to recruit the entire group. Among them, six individuals (E1, E2, E3, E4, E7, E13) initiated 79% of these movements involving all group members with two of them (E1, E4) being at the origin of 45% of these movements.
Number of movements recorded as a function of the number of individuals involved.

For each group, we tested the links between four variables using partial correlations (Pearson tests): (i) number of times an individual was the first mover regardless of the number of followers (heifers: N = 53 departures; ewe-lambs: N = 102), (ii) number of times an individual was the first mover and was followed by the whole group (heifers: N = 17 group departures; ewe-lambs: N = 37), (iii) number of times an individual was in the first position during movement, i.e. halfway between the departure and arrival points (heifers: N = 23 orders; ewe-lambs: N = 37) and (iv) friendship index (heifers: N = 15 individuals; ewe-lambs: N = 19). The first two variables were positively correlated for ewe-lambs (1/2: r = +0.91, P < 0.001), i.e., the individuals acting most often as the first mover more frequently recruited the entire group. In heifers, individuals acting most often as the first movers had lower numbers of close partners (1/4: r = −0.62, P = 0.023). Other correlation coefficients did not reach statistical significance (heifers 1/2: r = +0.09, P = 0.759; 1/3: r = −0.14, P = 0.642; 2/3: r = −0.10, P = 0.746; 2/4: r = −0.39, P = 0.182; 3/4: r = −0.22, P = 0.468; ewe-lambs 1/3: r = +0.25, P = 0.329; 1/4: r = +0.24, P = 0.361; 2/3: r = +0.05, P = 0.845; 2/4: r = −0.18, P = 0.499; 3/4: r = −0.26, P = 0.306).
To know whether individuals displayed preferential positions during travel, we tested correlations between movement orders involving all group members. Movement orders were obtained by attributing a position to each individual. We randomly separated the total number of movement orders in two series. A mean order was calculated for each of these two series. Then we tested the correlation between these two mean orders. We repeated this procedure five times to check the robustness of the results. In heifers one case out of five was significant (1st drawing: r = +0.49, P = 0.066; 2nd:+0.25, P = 0.366; 3rd:+0.04, P = 0.894; 4th:+0.32, P = 0.240; 5th:+0.58, P = 0.023; N = 23 group movements). In ewe-lambs three cases out of five had mean orders that were significantly correlated (1st drawing: r = +0.52, P = 0.023; 2nd: +0.41, P = 0.079; 3rd: +0.49, P = 0.033; 4th: +0.56, P = 0.013; 5th: +0.31, P = 0.205; N = 37 group movements).
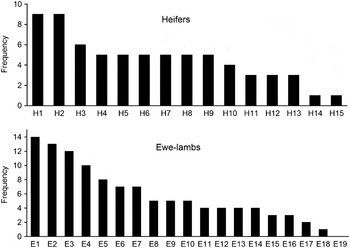
It could be that some individuals held similar positions during group movements despite variations in mean orders. To know whether animals had similar positions during different movements, we compared the number of times each individual was found in the first three positions and in other positions. We produced contingency tables and then compared observed and expected numbers using the χ 2 test. When distributions were significantly different we then calculated partitioned χ 2 values for each individual seen in the three first positions for more than one quarter of the total number of movements. We found that ewe-lambs held preferential positions during movement (χ 2 = 60.25, P < 0.001) (Figure 2); three individuals in particular were in the front positions more frequently than others (E1: χ 2 = 11.28, P = 0.001; E2: χ 2 = 8.86, P = 0.003; E3: χ 2 = 6.70, P = 0.010). The same tendency was observed in heifers but the smaller number of events recorded did not reach statistical significance (χ 2 = 21.65, P = 0.086) (Figure 2).
Number of times each individual was observed in the first three positions during group movement.

Social relationships
No significant correlations were found between dominance hierarchies and mean orders using Spearman tests (heifers: r = −0.22, P = 0.438; ewe-lambs: r = +0.14, P = 0.574). We found that heifers with a higher number of positive interactions were spatially closer to each other during group movements (affinity and succession: τrwXY,Z = +0.37, P < 0.001) and they frequently moved in subgroups (affinity and association: τrwXY,Z = +0.12, P = 0.046). No correlations between association and succession matrices were statistically significant (τrwXY,Z = +0.04, P = 0.294). In the case of ewe-lambs, individuals with preferential relationships were spatially closer to each other during movement (affinity and succession: τrwXY,Z = +0.56, P < 0.001; association and succession: τrwXY,Z = +0.16, P = 0.008). The correlation between association and affinity matrices was positive as in heifers but it did not reach statistical significance (τrwXY,Z = +0.10, P = 0.089).
Social and emotional traits
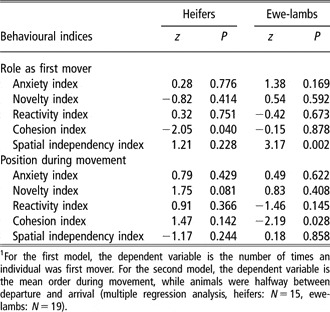
Results showed that heifers with the lowest cohesion indices (GLM: Akaike Information Criterion, AIC = 73.4, d.f. = 14) and ewe-lambs with the highest spatial independency indices (AIC = 135.3, d.f. = 18) acted significantly more often as the first mover (Table 1). Ewe-lambs with the highest cohesion indices were also found more frequently in front of the moving group halfway between departure and arrival of the movement (AIC = 130.7, d.f. = 18) (Table 1). Emotional traits did not significantly explain the mean movement order observed (AIC = Inf, d.f. = 14) in either heifers or ewes.
Relations between behavioural traits and positions of individualsFootnote 1

1 For the first model, the dependent variable is the number of times an individual was first mover. For the second model, the dependent variable is the mean order during movement, while animals were halfway between departure and arrival (multiple regression analysis, heifers: N = 15, ewe-lambs: N = 19).
Discussion
After a resting period, both heifers and ewe-lambs moved to change activities, which most of the time was grazing. Most movements involved either the entire group or only a few individuals. In both species the average speed of movements was lower and the distance travelled was higher, when all group members participated. A study of recruitment processes conducted in the same group of ewe-lambs confirmed that decision-making lasted longer when the movement involved a larger number of individuals (Ramseyer et al., Reference Ramseyer, Boissy, Dumont and Thierry2009c). The present study further illustrates the gregariousness of cattle and sheep; when only part of the group moves, animals tend to remain close to other mates at rest.
Most individuals could act as first mover and recruit the entire group, but a majority of group movements were initiated by the same three heifers whereas half of these movements were initiated by the same two ewes. Results showed that the most frequent first movers in ewe-lambs were also those most likely to recruit the entire group. In heifers, those individuals acting more often as first movers had a smaller number of close partners than others, suggesting that compared to other individuals, first movers are primarily motivated by moving away rather than remaining in the group.
Some individuals or categories of individuals are regularly found at the head of moving groups in mammals (Boinski and Garber, Reference Boinski and Garber2000). When comparing the identity of first movers and those which were in the front position halfway between the departure and arrival points, we found that they were usually different individuals in both species. Dove and collaborators (Reference Dove, Beilharz and Black1974) did not find regularities in movements of flocks of 10 to 12 young male sheep going to pasture, whereas the positions of ewe-lambs exhibited some consistencies in the present study. First, animal mean orders were usually significantly correlated. Three individual ewes were also more frequently observed than random in the front positions during progression, and these three ewes were amongst those most liable to recruit the whole group when acting as first movers. The reliability of movement positions appeared more limited in heifers, though three individuals were at the origin of two-thirds of group movements. These last results are consistent with previous observations. Some individuals have already been observed to display preferences for reliable positions in a group of adult zebu cows (Reinhardt, Reference Reinhardt1983) and in a group of 15 Charolais heifers of the same age (Dumont et al., Reference Dumont, Boissy, Achard, Sibbald and Erhard2005).
The motivation to move to a new feeding site may conflict with the motivation to stay close to other group members (Scott et al., Reference Scott, Provenza and Banner1995; Dumont and Boissy, Reference Dumont and Boissy2000; Boissy and Dumont, Reference Boissy and Dumont2002). Less sociable animals are more likely to move away from other animals: Sibbald et al. (Reference Sibbald, Erhard, Hooper, Dumont and Boissy2006) have shown that sheep which were more often the closest neighbour of other group members were also those less willing to move away from their social group. Here we found that some indices relating to sociability predicted the positions of individuals at departure and during movement. Ewe-lambs which exhibited strong spatial independence at grazing were the modal first movers and were also those individuals better able to recruit the whole group. Likewise, heifers with low indices of cohesiveness and which had a smaller number of close partners than others more often acted as first movers. Results thus indicate that the behaviour of individuals in group departure may be partly accounted for their traits related to social dependence with first movers being the most socially independent animals in both groups. Individuals’ positions during group movement could indeed be more dependent on social relationships in heifers relative to ewes.
Although there was no significant correlation in heifers between social dependence and specific positions during spontaneous group movement, we found that ewe-lambs displaying high indices of cohesiveness more often held front positions during travel. Group members could be more prone to follow preferential partners as also suggested by the observations made by Reinhardt and Reinhardt (Reference Reinhardt and Reinhardt1981). It is worth noting that we did not find any significant correlation between the individual’s position during group movements and its emotional reactivity, boldness and fearfulness. The only tendency (Table 1) was a positive correlation between the facility to approach a novel object and the position in front of the moving group in heifers, which suggests a possible link between exploratory tendency and propensity to lead the group. In any case, individual traits related to social dependence thus appeared more influential on group movements than emotional traits. The presence of conspecifics would have a stronger influence on the decisions of individuals than their own behavioural traits for spontaneous group movements at pasture. It could however be that the balance between individual traits and social factors depends on levels of potential disturbance and danger. In natural populations submitted to predation, individual traits could have a stronger influence in collective decision-making (Boissy and Le Neindre, Reference Boissy and Le Neindre1997; Réale and Festa-Bianchet, Reference Réale and Festa-Bianchet2003).
Individuals linked by preferential bonds clustered during group movements in both ewe-lambs and heifers. In the latter they also often split into subgroups. It has already been observed that individuals linked by preferential bonds often occupy neighbouring positions in moving groups in species as diverse as horses (Wells and von Goldschmidt-Rothschild, Reference Wells and von Goldschmidt-Rothschild1979) and domestic geese (Ramseyer et al., Reference Ramseyer, Petit and Thierry2009a). Within large herds of ungulates, females linked by preferential bonds stay in close proximity during grazing and resting periods (e.g., Estes, Reference Estes1974; Poole and Moss, Reference Poole and Moss1989; Nituch et al., Reference Nituch, Schaefer and Maxwell2008). In addition, the strength of social bonds within a group of ewe-lambs influenced inter-individual distance during grazing bouts (Boissy and Dumont, Reference Boissy and Dumont2002). Social factors also partly determined the formation of subgroups in heterogeneous environments and individual tendency to move away from the rest of the group (Boissy and Dumont, Reference Boissy and Dumont2002). Conversely, we did not find any evidence that dominance status influenced individual positions during group progression in ewe-lambs and heifers, which confirms previous observations by Dove et al. (Reference Dove, Beilharz and Black1974) and Reinhardt (Reference Reinhardt1983). This seems to be a very general conclusion that affinities are more influential than dominance on group orders in spontaneous group movements for domestic mammals, as already observed in domestic birds (Ramseyer et al., Reference Ramseyer, Petit and Thierry2009b).
In the present study, both study groups were homogeneous in age and sex, and this may have favoured social cohesion. When group members contrast in experience and needs, they can constitute subgroups that differ in their foraging choices (Scott et al., Reference Scott, Provenza and Banner1995; Fischhoff et al., Reference Fischhoff, Sundaresan, Cordingley, Larkin, Sellier and Rubenstein2007), thus influencing the decision-making process. This could slow down the decision process or give different weight to some individuals in the group. It is also important to keep in mind that the present results hold for two groups only. Future works should extend this study to further groups of different breed and demographic structure to assess the generality of our conclusions. If these studies confirm that the individuals most likely to initiate collective group movements are those exhibiting higher levels of social independence, we could target these individuals to manipulate the composition of social groups and improve the grazing distribution of the whole herd in heterogeneous environments (Bailey et al., Reference Bailey, Dumont and WallisDeVries1998).
Acknowledgements
We thank A. Blaison, J. Devillechabrolle and E. Nottelet for their assistance in collecting data. We are grateful to the staff of the INRA farms of Laqueuille (UEMA) and Theix (URH) for providing us with excellent research facilities. The doctoral work of A. Ramseyer was funded by a grant from the Région Alsace and the Animal Physiology and Livestock Systems Division of INRA. The study also benefited from a financial support by the Groupement de Recherche d’Ethologie (GDR 2822).