I. INTRODUCTION
Layered perovskite oxides show the full spectrum of exceptional physical properties, such as extraordinary magnetic properties and related magnetoresistive property in manganites [(La–A)n + 1MnnO3n + 1 (A = Sr, Ca, n = 1, 2, 3, …)] with Ruddlesden–Popper crystal structuresReference Kimura and Tokura1; the evolution from paramagnetic p-wave superconductor in Sr2RuO4, quantum metamagnetism in Sr3Ru2O7, to ferromagnetic metal in SrRuO3 in Srn + 1RunO3n + 1 Ruddlesden–Popper seriesReference Lee, Lee, Noh, Nakatsuji, Fukazawa, Perry, Maeno, Yoshida, Ikeda, Yu and Eom2; as well as layered Bi2Sr2Can − 1CunO7 high temperature superconductor whose superconductor transition temperature is strongly dependent on layer number n.Reference Marechal, Defourneau, Rosenman, Perriere and Simon3 These layered oxides provide the ideal playgrounds to elucidate the interplay among geometric dimensionality, electronic orbital freedom, spin freedom, electron–phonon interaction, and electron–electron interaction, which determine the exceptional physical properties in these systems.Reference Rao and Raveau4 However, due to the closely degenerated formation free energy among the high-order (n > 2) layered oxides, intergrowth (or local stoichiometry deviation, the structure collapse) is a universal phenomenon in these materials.Reference Tian, Pan, Haeni and Schlom5–Reference Parinov7 On the one side, high density of intergrowth may shield the intrinsic physical property; on the other side, ordered intergrowth phases open a new avenue to tailor the physical properties.Reference Subbanna, Guru Row and Rao8 Among many structural characterization tools [such as x-ray diffraction (XRD), Raman spectroscopy], transmission electron microscopy (TEM) provides the direct and unambiguous study for the intergrowth in layered oxides.Reference Tian, Pan, Haeni and Schlom5, Reference Zurbuchen, Tian, Pan, Fong, Streiffer, Hawley, Lettieri, Jia, Asayama, Fulk, Comstock, Knapp, Carim and Schlom6 Up to now, there are a lot of TEM studies on layered perovskite oxides such as Srn + 1RunO3n + 1, Srn + 1TinO3n + 1, (La–A)n + 1MnnO3n + 1, and Bi2Sr2Can − 1CunO7.Reference Tian, Pan, Haeni and Schlom5, Reference Zurbuchen, Tian, Pan, Fong, Streiffer, Hawley, Lettieri, Jia, Asayama, Fulk, Comstock, Knapp, Carim and Schlom6, Reference Van Tendeloo, Lebedev, Hervieu and Raveau9, Reference Wen, Yang, Yan and Fung10
Bi-contained oxide with “Aurivillius structure” is a member of layered perovskite oxides. Aurivillius structure, general formula as (Bi2O2)2+(Am − 1BmO3m + 1)2−, is formed by Bi2O2 layers interleaved with pseudoperovskite type layers Am − 1BmO3m + 1, where A, B, and O are two cations and oxygen anion in perovskite ABO3, respectively, m represents the number of BO6 oxygen octahedra between two successive Bi2O2 layers.Reference Jardiel, Caballero and Villegas11 Inserting the different Am − 1BmO3m + 1 (A = Sr, Ba, Pb; B = Fe, Ti, Cr, Mn) and various m leads to different physical properties, such as fatigue-free ferroelectricity in Bi4Ti3O12 (BTO),Reference Jardiel, Caballero and Villegas11 relaxor ferroelectric property in BaTiO3–BTO,Reference Kobayashi, Noguchi and Miyayama12 as well as multiferroic property in Bi(Fe0.5Co0.5)O3–BTO.Reference Mao, Wang, Chen and Lu13
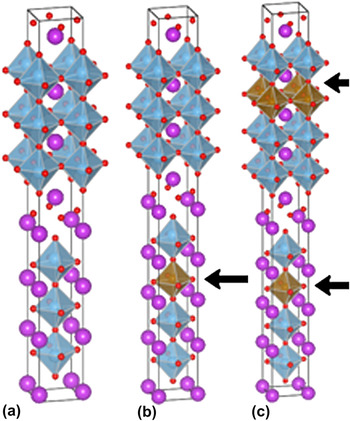
It is worth mentioning that there are two ways for inserting the pseudoperovskite layer ABO3 into the BTO.Reference Jardiel, Caballero and Villegas11 One is the integer insertion; the other is fraction number insertion. Integer insertion is to dope the equal numbers of perovskite cell into two successive half-unit cell of BTO, which has the similar structure of Bim + 1TimO3(m + 1) (m = 4, 5, …). While there are even–odd numbers of perovskite cells inserting in two successive half-unit cell of BTO in fraction number ABO3-BTO sample.Reference Jardiel, Caballero and Villegas11 For example, 0.5-ABO3–BTO is the insertion of an ABO3 perovskite in a half-unit cell of BTO but no insertion in the successive half-unit cell one. Other number of perovskite-doped BTO can be understood in the identical way. It has been demonstrated that the 0.5-BaTiO3-doped BTO has dramatically enhanced ferroelectric property.Reference Kobayashi, Noguchi and Miyayama12 The schematics for crystal structures of BTO, 0.5-ABO3–BTO, and 1.0-ABO3–BTO are shown in Fig. 1.
The schematics of atomic structures of BTO (a), 0.5-ABO3–BTO (b), and 1.0-ABO3–BTO (c).

Compared with detailed TEM characterization on other layered perovskite oxides (such as Ruddlesden–Popper Bi2Sr2Can − 1CunO7 high temperature superconductor series), there are quite limited microstructure characterizations on Bi-contained oxides with Aurivillius structure.Reference Zurbuchen, Tian, Pan, Fong, Streiffer, Hawley, Lettieri, Jia, Asayama, Fulk, Comstock, Knapp, Carim and Schlom6, Reference Suzuki, Nishi, Fujimoto, Ishikawa and Funakubo14–Reference Zurbuchen, Sherman, Tagantsev, Schubert, Hawley, Feng, Streiffer, Jia, Tian and Schlom16 For example, Gopalakrishnan et al.Reference Gopalakrishnan, Ramanan, Rao, Jefferson and Smith15 characterized the microstructure of Bi9Ti6O27 and Bi9Ti6CrO27 samples; Zurbuchen et al.Reference Zurbuchen, Tian, Pan, Fong, Streiffer, Hawley, Lettieri, Jia, Asayama, Fulk, Comstock, Knapp, Carim and Schlom6, Reference Zurbuchen, Sherman, Tagantsev, Schubert, Hawley, Feng, Streiffer, Jia, Tian and Schlom16 conducted the microstructure study on SrBi2Nb2O9, Bi7(Mn,Ti)6O21, and 4-STO–BTO thin films. Considering the intimated relationship between physical properties and microstructure in given materials, it is crucial to characterize the microstructure of n-ABO3–BTO systematically.
In this paper, we have successfully synthesized a series of various n-SrTiO3 (STO)-doped, n-LaFeO3 (LFO)-doped, n-BiFeO3 (BFO)-doped BTO thin films on (001) STO substrates by pulsed laser deposition (PLD). The structures and microstructures of n-ABO3–BTO (ABO3 = STO, BFO, and LFO) are “systematically” studied. The XRD is conducted to characterize the macrostructure of these samples. The microstructure of films is further studied by TEM and high-resolution transmission electron microscopy (HRTEM). The structural stability in these systems is the focus point in our study. To understand the underlying physical principles, the formation enthalpy at absolute zero temperature of these materials is calculated by the density functional theory (DFT). The theoretical results are in reasonable agreement with experimental ones. At finite temperature, the entropy induced by intergrowth is considered to discuss the structural instability in these layered oxides. Based on these theoretical and experimental efforts, the structural stability in the layered Aurivillius oxides is rationalized. These informations are necessary to explore the multifunctionality based on Aurivillius n-ABO3–BTO.
II. EXPERIMENTAL AND THEORETICAL DETAILS
A series of BTO thin films doped by different perovskite oxides with various layer numbers [n-LFO (n = 0.5, 1.0, 1.5, 2.0, 2.5), n-BFO (n = 3), and n-STO (n = 0, 1, 2, 3)] are fabricated on (001) STO substrates by PLD using Brilliant Nd:YAG laser (Quantel, Les Ulis, CEDEX, France) (355-nm output) with a repetition rate of 10/3 Hz and a pulse energy of 120 mJ. The targets used in PLD are prepared by the standard solid-state reaction process. Fine powders of high purity TiO2, La2O3, SrCO3, Fe2O3, and Bi2O3 (with 10% excess) with nominated molar ratio are mixed thoroughly and sintered at 1050 °C for 5 h in air. Before thin films deposition, the PLD chamber is evacuated to a base pressure of 3 × 10⁻⁵Pa. The substrates’ temperatures for the growth of BFO–BTO, LFO–BTO, and STO–BTO are 730, 730, and 750 °C, respectively. The oxygen partial pressure is set as 20 Pa during the deposition. After deposition, all the films are in situ annealed at 730 °C under 200 Pa oxygen pressure for 10 min. The crystal structure of thin films is characterized by XRD (Rigaku, Tokyo, Japan). The microstructure of these samples is characterized by TEM (Tecnai F20, FEI, Hillsboro, OR). The TEM specimens are prepared by conventional methods including mechanical grinding, dimpling, and ion milling (Gatan PIPS, Gatan, Pleasanton, CA) at the final stage. The TEM micrographs are processed by Gatan Micrograph and Photoshop software.
The geometric and electronic properties of n-ABO3-doped BTO are calculated by the DFT in the generalized gradient approximation implemented in the Vienna ab initio Simulation Package,Reference Kresse and Hafner17 in which the projected augmented wave methodReference Blöchl18 and Perdew–Burke–Ernzerhof exchange correlation are used.Reference Perdew, Burke and Ernzerhof19 The plane wave cutoff energy is 520 eV throughout the calculation. The Brillouin zone integrations are performed with a 9 × 9 × 1 gamma-centered k-point mesh, and the Gaussian smearing width is 0.05 eV. The lattice constants and all the atomic positions are relaxed by using the conjugate gradient algorithm until the residual forces of all atoms are less than 0.01 eV/Å.
III. RESULTS AND DISCUSSIONS
A. n-STO–BTO (n = 0, 1, 2, 3) and 3-BFO–BTO systems
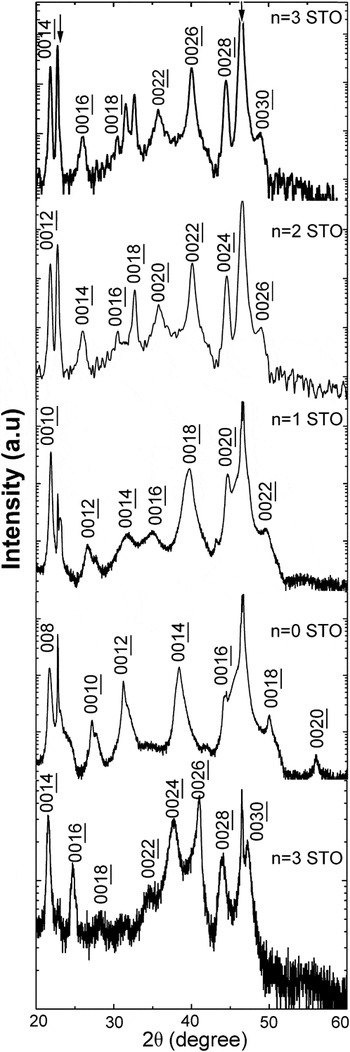
Figure 2 shows the XRD θ–2θ results of n-STO–BTO (n = 0, 1, 2, 3) and 3-BFO–BTO thin films grown on (001) STO substrates. One can see that there are only {002L} reflections coming from thin films (the reflections coming from substrates are indicated by the hexagonal stars). Thus, it can be concluded that the growth directions of all these thin films are along the c-axis of Aurivillius structure. And occurrences of (002L) reflections in n-STO–BTO (n = 0, 1, 2, 3) are in agreement with space groups of Bi-layered Aurivillius phases. Previous works substantiate that space groups of even and odd n-STO–BTO are A21am and B21bm, respectively.Reference Hervoches, Snedden, Riggs, Kilcoyne, Manuel and Lightfoot20, Reference Nakashima, Fujisawa, Ichikawa, Park, Kanashima, Okuyama and Shimizu21
XRD θ–2θ results of n-STO–BTO (n = 0, 1, 2, and 3) and 3-BFO–BTO. Two arrows show the reflections from STO substrates.

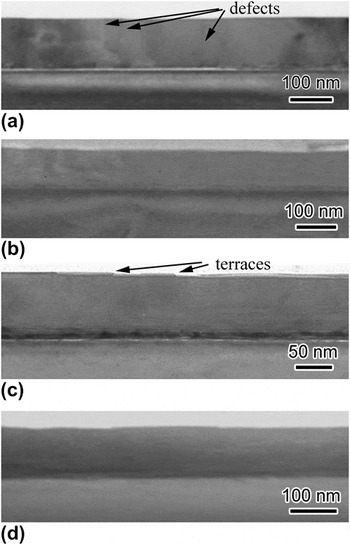
The low-magnification TEM micrographs of n-STO–BTO (n = 0, 1, 2, 3) thin films are depicted at Figs. 3(a)–3(d). It is evident that BTO, STO–BTO films show the clear interfaces with STO substrates and quite flat surfaces. But there are step-like surface morphologies in n-STO–BTO (n = 2, 3) thin films. One of the terraces is highlighted by an arrow in Fig. 3(c). Some fringes corresponding to crystalline defects are also observed in these figures. These defects are indicated by arrows in Fig. 3(a). Most of defects are out-of-phase boundaries identified by HRTEM (not shown here). Existence of out-of-phase boundary is a universal phenomenon in materials with Aurivillius structure.Reference Zurbuchen, Tian, Pan, Fong, Streiffer, Hawley, Lettieri, Jia, Asayama, Fulk, Comstock, Knapp, Carim and Schlom6
(a)–(d) The low-magnification TEM images of n-STO–BTO (n = 0, 1, 2, and 3), respectively. Several terraces and defects are indicated by arrows.

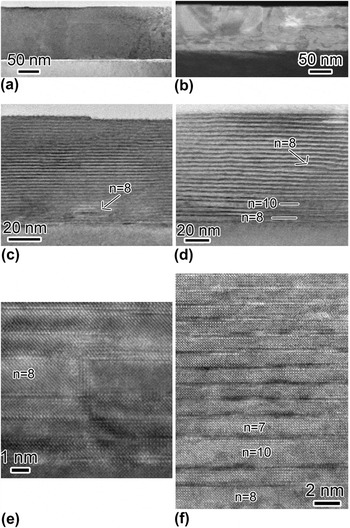
Structural instability in this system is observed. Figures 4(a)–4(d) are the high-magnification TEM micrographs of n-STO-doped (n = 0, 1, 2, 3) BTO films. As shown in Figs. 4(a) and 4(b), the lattice repetition along the c-direction (or growth direction) is nearly constant. In other words, the BTO and STO–BTO samples have structure in accordance with nominated chemistry formula. However, close inspection proves that the lattice fringes of 2-STO- and 3-STO-doped BTO samples are not homogeneous as shown in Figs. 4(c) and 4(d). A small intergrowth area begins to appear in 2-STO–BTO sample, which is indicated by an arrow. And there are high density intergrowth in n = 3 sample. Some of these areas are carefully studied by HRTEM, which are shown in Figs. 4(e) and 4(f). Figure 4(e) is taken from 2-STO–BTO film. It is evident that there is a local area with n = 8 intergrowth in this sample. Statistical measurement proves that the area density of n = 8 intergrowth in 2-STO–BTO films is about 2%. Intergrowth is much more serious in 3-STO–BTO sample compared with n = 2 sample. The intergrowth with various n (n = 7, 8, and 10) in 3-STO–BTO films can be observed, which was shown in Fig. 4(f). And area densities of the intergrowth with n = 7, 8, and 10 were measured statistically as 2.7%, 7.1%, and 8.2%, respectively. Based on above-mentioned characterizations, the structure of n-STO-doped BTO becomes unstable in the case of n = 3. Generally believing, the formation of intergrowth/structural disruption is related to the local nonstoichiometry. This in turn affects the corresponding physical properties. Thus, quite diverse ferroelectric properties of n-STO–BTO reported in previous papers might be related to different intergrowth density in samples synthesized in growth conditions.Reference Zurbuchen, Tian, Pan, Fong, Streiffer, Hawley, Lettieri, Jia, Asayama, Fulk, Comstock, Knapp, Carim and Schlom6
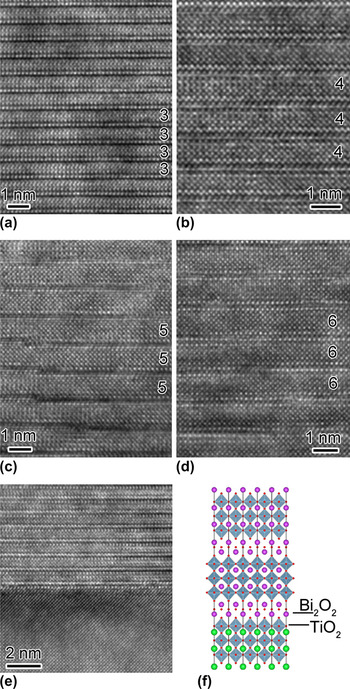
(a)–(d) The high-magnification TEM micrographs for n-STO–BTO (n = 0, 1, 2, and 3) samples, respectively. Intergrowth areas in (c) and (d) are indicated by arrows. (e) and (f) are the HRTEM images for 2-STO–BTO and 3-STO–BTO samples showing the existence of intergrowth. The numbers labeled in the micrographs (including Figs. 6 and 9) are indicated by the numbers of BO6 octahedra between two successive Bi2O2layers.

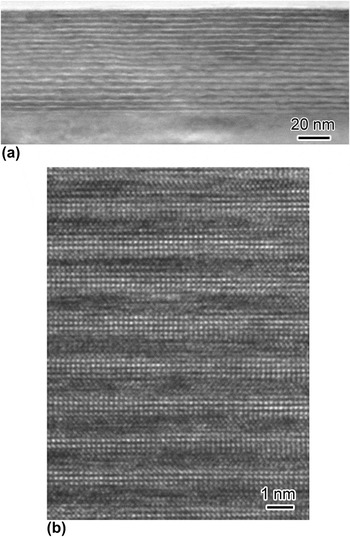
In contrast to 3-STO–BTO, 3-BFO–BTO is free of any intergrowth. Figure 5(a) shows the high-magnification TEM image of 3-BFO–BTO thin films grown on STO substrates. Evidently, lattice repetition of films is quite uniform. In other words, there is no any intergrowth in 3-BFO–BTO. The local atomic structure is rigorously arranged as six-layered Aurivillius structure, as revealed by HRTEM image [Fig. 5(b)]. Krzhizhanovskaya et al.Reference Krzhizhanovskaya, Filatov, Gusarov, Paufler, Bubnova, Morozov and Meyer22 reported that the 3-BFO–BTO structure is stable supported by high-resolution XRD result. In Sec. III. C, we try to understand the structural stabilities of n-STO–BTO, n-BFO–BTO, and n-LFO–BTO by the DFT calculations and thermodynamic arguments.
(a) The high-magnification TEM micrograph of 3-BFO–BTO sample. (b) The HRTEM image of same sample, which shows the perfect Aurivillius structure.

The atomic structures of these samples in the intergrowth-free areas have been studied by HRTEM as well. Figures 6(a)–6(d) are HRTEM images for n-STO-doped (n = 0, 1, 2, and 3) BTO films, respectively. As shown in Fig. 6, Bi2O2 and different perovskite layers are stacking along the c-axis in these samples. The numbers of oxygen octahedra along the c-axis are labeled in these figures. One can see that our films do have designed layered Aurivillius structures in regular areas. Interfacial structures between films and substrates of these samples are revealed by HRTEM. Figure 6(e) is the HRTEM image of interface in BTO films. One can see that the interfaces of these samples between films and substrates are atomically sharp. In other words, the interdiffusion between films and STO substrates is negligible at the growth temperature (750 °C). Close inspection shows that the atomic stacking along the interface can be built as STO–SrO– TiO2–Bi2O2–TiO2–BiO–TiO2–BiO–Bi2O2…. Italic symbol represents the atomic stacking at the interface. The schematic of interfacial configuration is shown in Fig. 6(f). Similar results (not shown here) can be obtained in other samples too.
(a)–(d) The HRTEM images of n-STO–BTO (n = 0, 1, 2, 3) samples. (e) The HRTEM image of BTO/STO interface. The corresponding schematic of interfacial structure is depicted on (f).

B. n-LFO–BTO (n = 0.5, 1.0, 1.5, 2.0, 2.5) systems
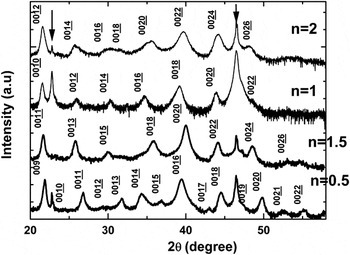
In this part, the similar characterizations for STO-doped BTO are conducted for n-LFO–BTO (n = 0.5, 1.0, 1.5, 2.0, 2.5) system. Figure 7 is the XRD θ–2θ curves for n-LFO–BTO (n = 0.5, 1.0, 1.5, and 2.0) samples. It is evident that there are (00L) (L = even) reflections observed in 2.0-LFO–BTO sample, while other three samples do show the reflection with L being both even and odd numbers. This might be determined by the permitted reflections in space group P21am, but the space group of 1.0-LFO–BTO and 2.0-LFO–BTO might be A21am.Reference Hervoches, Snedden, Riggs, Kilcoyne, Manuel and Lightfoot20, Reference Nakashima, Fujisawa, Ichikawa, Park, Kanashima, Okuyama and Shimizu21
XRD θ–2θ results for n-LFO–BTO films (n = 0.5, 1.0, 1.5, 2.0). Two arrows show the reflections from STO substrates.

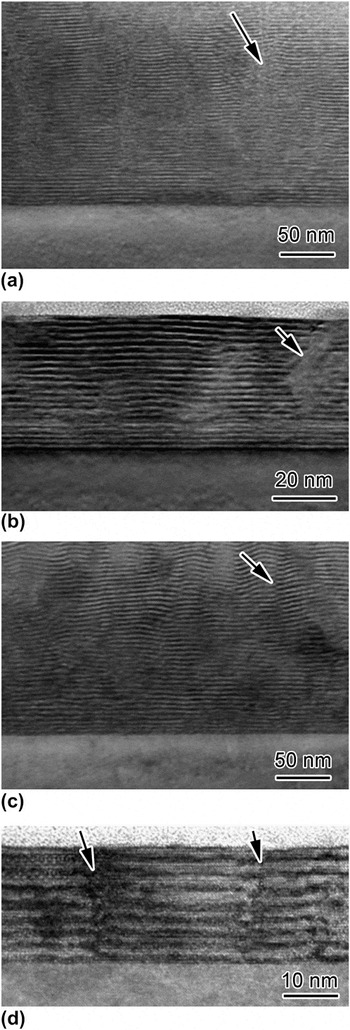
The low-magnification images of n-LFO–BTO (n = 0.5, 1.0, 1.5, and 2.0) samples are depicted on Figs. 8(a)–8(d), respectively. One can see that compared with quite homogeneous contrast in n-STO-doped BTO samples (Fig. 3), all the LFO–BTO films show quite inhomogeneous contrast, which means high density of crystal defects in these samples. Several crystal defects are indicated by arrows in Fig. 8. HRTEM results (not shown here) prove that they belong to the out-of-phase boundaries.
(a)–(d) Low-magnification TEM images of n-LFO–BTO films (n = 0.5, 1.0, 1.5, 2.0), respectively. Several defects are indicated by arrows in figures.

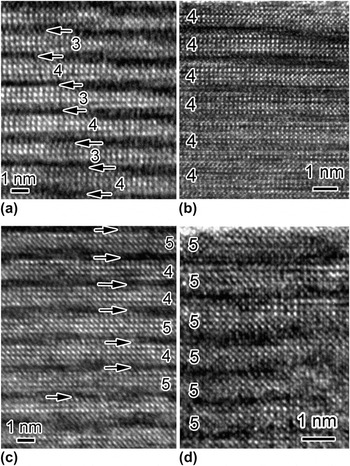
The atomic structure of n-LFO–BTO (n = 0.5, 1.0, 1.5, and 2.0) in the defect-free areas is revealed by HRTEM images [Figs. 9(a)–9(d)]. One can see the clear even–odd number stacking of oxygen octahedra along the growth direction in 0.5-LFO-doped [Fig. 9(a)] and 1.5-LFO-doped BTO samples [Fig. 9(c)]. And there are even–even numbers of oxygen octahedra stacking in other two samples. It should be emphasized that there are some disordered areas; one area (two 4 oxygen octahedra connected successively) can be seen in Fig. 9(c). But this is different from intergrowth shown in STO–BTO system (see Fig. 4). And the structure keeps the designed crystal structure in average, which is supported by XRD results (Fig. 7). Thus, we can conclude that the grown n-LFO–BTO (n = 0.5–2.0) do have designed crystal structure. It is worth mentioning that the fraction number of LFO–BTO shows the significant ferrimagnetic property even up to room temperature, which might be due to nonsymmetric distribution of LFO in a unit cell of BTO.Reference Wu, Chen, Chen, Zhang, Zhou, Zhu and Chen23
(a)–(d) HRTEM micrographs of n-LFO–BTO films (n = 0.5, 1.0, 1.5, 2.0), respectively. The boundaries between successive half-unit cells are highlighted by arrows in (a) and (c).

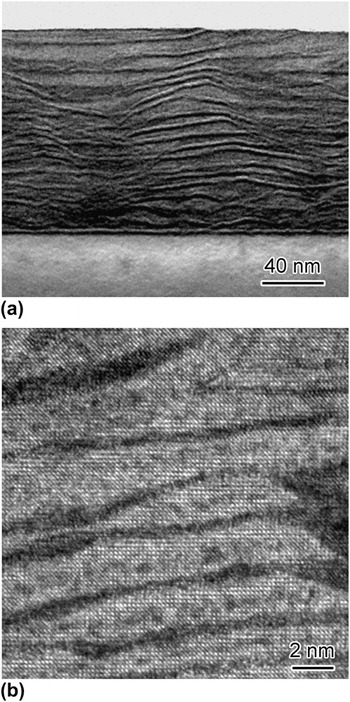
The remarkable feature of LFO–BTO samples is the Aurivillius structure disruption in 2.5-LFO–BTO, which is depicted in Fig. 10(a). It shows the quite inhomogeneous dark fringes in 2.5-LFO–BTO sample. Figure 10(b) is a HRTEM image of 2.5-LFO–BTO samples. It can be seen clearly that there are no predesigned regular lattice fringes. The areas between the curved dark fringes show the perovskite stacking. This substantiates vividly that the structure of n-LFO-doped BTO films is disrupted when the n is equal or larger than 2.5. In Sec. III. C, the structural stability of n-BFO–BTO, n-LFO–BTO, and n-STO–BTO will be discussed theoretically.
(a) The low-magnification TEM of 2.5-LFO–BTO film. It shows the disrupted Aurivillius structure in this sample. (b) The HRTEM image taken from same sample.

C. Structural stability in ABO3-doped BTO
To elucidate the underlying physical origin of structural stabilities of n-STO–BTO, n-BFO–BTO, and n-LFO–BTO, the theoretical calculations of formation enthalpy at absolute zero temperature of these systems are conducted. The ideal structural models for n-ABO3–BTO are set as those shown in Figs. 1(b) and 1(c). To simulate the mechanical strain constrained by STO substrates, the crystal structures are relaxed by fixing the a–b plane lattice constants of ABO3-doped BTO as those in STO. The formation enthalpy of a compound can be defined as the total energy difference of the compound and their constituent elements in their stable states. For example, the formation enthalpy of BTO matrix can be calculated by the equationReference Zhou, Luo, Chen, Zhang, Gu, Yao and Chen24:
 $$\Delta H_{{\rm{Bi}}_{\rm{4}} {\rm{Ti}}_{\rm{3}} {\rm{O}}_{{\rm{12}}} } = \,[E({\rm{BTO}}) - 4E({\rm{Bi}}) - 3E({\rm{Ti}}) - 12E({\rm{O}})]/19\quad,$$
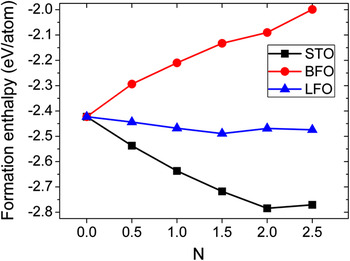
where E(BTO), E(Bi), E(Ti), and E(O) are the total energies of BTO per formula cell, bulk Bi, bulk Ti, and O2 molecule per atom, respectively. And the formation enthalpies of n-STO–BTO, n-LFO–BTO, and n-BFO–BTO are calculated in the similar way, which are shown in Fig. 11. One can see that formation enthalpies of these systems show the different trends with the increase of inserted perovskite numbers. In n-STO-doped BTO case, the formation enthalpy of n-STO–BTO is decreased before n = 2. But the formation enthalpy of n = 2.5 STO is close to degenerate with that of n = 2.0. It thus can be concluded that the structure of n-STO-doped BTO will be instable according to the thermodynamic limitation law. Thermodynamic limitation law claims that the pure phase will be instable if the corresponding free energy is degenerate with those in other phases.Reference Porter and Easterling25 Our experiments [Fig. 4(d)] show that the intergrowth begins to appear in n = 2 sample, and there are high density of intergrowth in n = 3 sample. Therefore, the agreement between theory and experiment is reasonable good though the calculated formation enthalpy is at absolute zero temperature. Recently, Zurbuchen et al.Reference Zurbuchen, Sherman, Tagantsev, Schubert, Hawley, Feng, Streiffer, Jia, Tian and Schlom16 reported the successful growth of intergrowth-free 4-STO–BTO by charge-mediated synthesis. Charge-mediated synthesis may lift the degeneracy of enthalpy of high n number STO–BTO. How to account this effect in the first-principles calculation is an interesting problem. The formation enthalpy of n-LFO-doped BTO (n = 0.5–2.5) system also decreases when n is up to 1.5. Then, formation enthalpy of n = 2.0 increases and degenerates with that of n = 2.5 case. Then, we can infer that structure of n-LFO–BTO will be clasped when n is close to 2.5. It is evident that the theoretical result is in agreement with experimental result too (see Fig. 10). In contrast, the formation enthalpy of n-BFO–BTO (n = 0.5–2.5) is totally different from those in n-STO–BTO and n-LFO–BTO cases. The formation enthalpy of n-BFO–BTO is increased with the increase of BFO numbers. And we can see that the formation enthalpies are all negative, which means that all these phases are stable theoretically. More importantly, there is no degeneracy in formation enthalpies between n-BFO–BTO and (n − 1)-BFO–BTO. It is therefore reasonable to postulate that the structure of n-BFO–BTO system is the most robust among the three systems studied in this contribution. This is in agreement with our TEM work, which proves that 3-BFO–BTO has quite uniform structure and nearly free of crystal defects (Fig. 5). In conclusion, the theoretical enthalpy calculations reasonably explain the corresponding experimental results.
The inserted perovskite layer number dependence of theoretical enthalpy in n-STO–BTO, n-BFO–BTO, and n-LFO–BTO systems.(color online)

Extension of above discussion to finite temperature should consider not the enthalpy but the Gibbs free energy, which can be written as G = H − ST (where G, H, S, and T are the Gibbs free energy, enthalpy, entropy, and temperature, respectively).Reference Porter and Easterling25 Up to now, there are not reliable experimental and theoretical data of Gibbs free energy of STO–BTO, BFO–BTO, and LFO–BTO systems. It is beyond the scope of this paper to calculate the Gibbs energy for these systems. We mainly focus on discussing the intergrowth phenomena in these systems qualitatively. If there is formation energy degeneracy among the several different phases, such as intergrowth observed in 3-STO–BTO [Fig. 4(f)], increased configuration entropy in mixed state always leads to the intergrowth state more stable than single phase state, whose configuration entropy is 0. It should be mentioned that we ignore the entropy changes contributed from phonon and electron changes in intergrowth state, as well as interfacial energy between different intergrowth states.Reference Tian, Pan, Haeni and Schlom5 Some previous works have proved that these effects can be ignored compared with configuration entropy. Quantitatively, configuration entropy in the intergrowth state can be written asReference Porter and Easterling25:
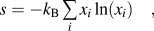 $$s = - k_{\rm{B}} \mathop\sum\limits_i {x_i \ln (x_i )} \quad,$$
where k B is the Boltzmann constant, i labels the all possible degenerated phases (or possible intergrowth phases), xi is the overall fractional makeup of each type of intergrowth module in the sample. The order of free energy contribution coming from ST (entropy times temperature) can be approximated as several hundred millielectron Volts (∼55 meV, which is simply evaluated as x 1 = x 2 = 0.5). The temperature is chosen as thin films synthesis temperature (∼1000 K). Compared with enthalpy different between n = 2-LFO–BTO and n = 2.5-LFO-BTO (6 meV, measured from Fig. 11), it can be seen that the mixed phase, with the configuration entropy contribution, do have lower free energy than pure phase. However, the enthalpy difference between n =2-BFO-BTO and n =2.5-BFO-BTO is calculated as 92 meV, which is larger than ST contribution due to configuration entropy. It infers that intergrowth is free in BFO–BTO systems even at finite temperature. Therefore, above qualitative discussions are also in line with experimental observations. Obviously, above discussions are based on equilibrium thermodynamics. But it is a typical nonequilibrium process in PLD. More advanced methods, such as molecular dynamic simulation,Reference Pirovano, Saiful Islam, Vannier, Nowogrocki and Mairesse26 therefore should be applied to elucidate the underlying origin of structural instability in n-ABO3–BTO layered systems.
IV. CONCLUSIONS
In closing, a series of n-STO-, BFO-, and LFO-doped BTO thin films are synthesized epitaxially on (001) STO substrates by PLD. Microstructures of these films are characterized by the TEM. It is revealed that intergrowth begins to generate in 2-STO–BTO, and there are high density of intergrowth in 3-STO–BTO. While 3-BFO-BTO still keeps perfect designed structure. In the case of n-LFO–BTO, the layered Aurivillius structure of 2.5-LFO–BTO has been disrupted. The formation enthalpies of these systems have been calculated theoretically. The degeneracy of formation energy explains the intergrowth structure in n-STO–BTO and n-LFO–BTO when n is larger than or equal to 3 and 2.5, respectively. Similarly, the nondegeneracy of formation energy in n-BFO–STO is the reason why 3-BFO–BTO is still stable. These results maybe shed light on the physical properties of these systems.
ACKNOWLEDGMENTS
We would like to acknowledge the financial support from the National Science Foundation of China (Grant Nos. 10874069, 51032003, 10974083, 51002074, and 11004094), the State key program for basic research (Grant Nos. 2007CB613202, 2009CB929503), specialized Research Fund for the Doctoral Program of High Education (Grant No. 20100091120008), and the New Century Excellent Talents in University (Grant No. NCET-09-0451).