1. INTRODUCTION
The objective of this work is the study of three-dimensional (3D) Richtmyer–Meshkov instability (RMI) and the Rayleigh–Taylor instability (RTI) on metal surface induced by the laser shock. Growth of spikes and bubbles and subsequent turbulent mixing arise when a shock passes through an interface between two fluids (Richtmyer, Reference Richtmyer1960; Meshkov, Reference Meshkov1969). The RTI occurs for the constant acceleration of the heavy fluid into the lighter one. The RMI occurs for the impulsive acceleration either of the light fluid into the heavy one, or vice versa (Wouchuk & Nishihara, Reference Wouchuk and Nishihara1996; Zabusky, Reference Zabusky1999).
The RMI is present in a wide variety of natural phenomena from astrophysical to atomic scales as well as in many technological applications. Examples include supernova explosion with formation of circumstelar structures (Kane et al., Reference Kane, Drake and Remington1999; Peng et al., Reference Peng, Zabusky and Zhang2003; Zhang & Zabusky, Reference Zhang and Zabusky2003; Zhang et al., Reference Zhang, Zabusky and Nishihara2003), laser–material interactions with complex micro-fluid dynamics (Fukumoto & Lugomer, Reference Fukumoto and Lugomer2003; Zabusky et al., Reference Zabusky, Lugomer and Zhang2005; Lugomer, Reference Lugomer2007), laser inertial confinement fusion (Alon et al., Reference Alon, Ofer, Shvarts, Young, Glimm and Boston1966; Nishihara et al., Reference Nishihara, Ishizaki, Wouchuk, Fukuda and Shimuta1998; Shvarts et al., Reference Shvarts, Sadot, Oron, Kishony, Srebro, Rikanati, Kartoon, Yedvab, Elbaz, Yosef-Hai, Alon, Levin, Sarid, Arazi and Ben-Dor2001; Matsuoka et al., Reference Matsuoka, Nishihara and Fukuda2003), explosive combustion (Yang et al., Reference Yang, Kubota and Zukoski1993), and the shock-tube phenomena (Palekar et al., Reference Palekar, Vorobieff and Truman2007; Balakumar et al., Reference Balakumar, Orlicz, Tomkins and Prestridge2008; Probyn & Thornber, Reference Probyn and Thornber2013; Ting et al., Reference Ting, Zhigang and Xisheng2014).
When the shock wave strikes the density interface, the light fluid (ρL) is accelerated impulsively into the heavy one (ρH) causing baroclinic vorticity deposition. In the presence of the re-shock, additional vorticity is deposited during its interaction with the evolving interface (Yang et al., Reference Yang, Zabusky and Chern1990; Brouilette & Sturtevant, Reference Brouilette and Sturtevant1994; Balakumar et al., Reference Balakumar, Orlicz, Tomkins and Prestridge2008; Probyn & Thornber, Reference Probyn and Thornber2013).
The amplitude and the wavelength of the spikes and bubbles depend on the initial perturbation of the interface. For the multi-modal perturbation the bubble amplitude scales in a different way than the spike amplitude. The latter strongly depends on the fluid density ratio expressed by the Atwood number, A = (ρH − ρL)/(ρH + ρL) (Alon et al., Reference Alon, Ofer, Shvarts, Young, Glimm and Boston1966).
With the passage of a shock front, the interface begins to decelerate after shock refraction. Since the pressure decreases monotonically with distance behind the shock front, the reversal of pressure and of density gradients occurs from the heavy into the light fluid. Such a condition at the interface causes the RTI (Miles et al., Reference Miles, Blue, Edwards, Greenough, Hansen, Robey, Drake, Kuranz and Leibrandt2005). Under the influence of the RMI/RTI, interface perturbations grow into spikes of heavy-fluid into light-fluid and bubbles of light-fluid into heavy-fluid. The subsequent shear development along the growing spikes causes the Kelvin–Helmholtz instability and formation of mushroom-shape caps at the spike tips (Miles et al., Reference Miles, Blue, Edwards, Greenough, Hansen, Robey, Drake, Kuranz and Leibrandt2005).
The RTI exponentially grows in time with the growth rate which depends on the Atwood number A, on the perturbation amplitude A 0 and the spatial period of the perturbation mode. The evolution of RTI starts in the linear regime, then passes into nonlinear and finally into the turbulent mixing regime (Abarzhi, Reference Abarzhi1998). In the linear regime, small perturbations grow fast, and the dynamics of the structure formation is governed by the amplitude and the spatial period. The spatial period λ is set by the mode of fastest growth or by the initial perturbation. In the nonlinear regime, the growth rate slows and the interface is transformed into a composition of the large-scale self-organized structures on discrete lattices and the small-scale irregular (unorganized) structures driven by the shear. The nonlinear phase starts when the vertical scale (amplitude) becomes equal to the horizontal scale (wavelength, λ) (Abarzhi, Reference Abarzhi1998; Reference Abarzhi2008). The self-organization on discrete symmetry lattices appears with the onset of the coherent flow and of evolution of the mushroom-shape spikes. In the turbulent mixing regime, the growth of structures is self-similar with the length scale, characteristic for the fractal nature of turbulent mixing.
The growth of RMI/RTI structures, their dependences on the Atwood number, and on the initial conditions are the subject of intensive studies. The effects of the initial conditions have been experimentally and theoretically studied for the single-mode perturbation (Long et al., Reference Long, Krivets, Greenough and Jacobs2009), and for the multi-modal perturbation in the shock tube experiments (Velikovich & Dimonte, Reference Velikovich and Dimonte1996; Rikanati et al., Reference Rikanati, Alon and Shvarts1998; Cohen et al., Reference Cohen, Dennevik, Dimits, Eliason, Mirin, Zhou, Porter and Woodward2002), as well as for the rippled shock perturbation in the high-power laser ablation experiments (Nishihara et al., Reference Nishihara, Wouchuk, Matsuoka, Ishizaki and Zhakhovsky2010).
The multi-modal initial perturbation consists either of a random combination of short wavelengths only, or of the combination of the long- and the short wavelengths. The question of interest is what is the effect of the initial perturbation on the nonlinear RMI and RTI and on the scaling of the growth rate of bubble/spike fronts at late times. Alon et al. (Reference Alon, Ofer, Shvarts, Young, Glimm and Boston1966) have shown that the growth of structures and the mixing rate do not depend on the initial perturbation in the RTI. However, in the RMI the penetration and evolution of structures (bubble front) depend on the information from the initial perturbation at all time of the experiment (Alon et al., Reference Alon, Ofer, Shvarts, Young, Glimm and Boston1966).
Regarding the growth rate the situation is also different for RMI and RTI. When considering the spike front where jets of heavy fluid penetrate the light fluid at high density ratio between the fluids, the spike behaves as freely falling drop. In the RT case, at A = 1, this leads to the spike and the bubble front penetration at the same scaling law reaching the scale invariant dynamics. However, in the RM case, at A = 1, the spikes fall at the constant velocity much faster than the bubbles. Thus, in the RM case, the bubble and spike fronts display different power laws (Alon et al., Reference Alon, Ofer, Shvarts, Young, Glimm and Boston1966).
In this paper, we consider the RMI/RTI connected with laser–matter interaction in which plasma detonation causes the blast wave that impulsively accelerates the vapor plume (light fluid) into the molten metal layer (heavy fluid). The nanosecond laser interaction with the metal surface in the air was driven by a rectangular beam with one-dimensional (1D) Gaussian-like power distribution. The lateral vapor/plasma expansion in the background gas causes a variation of the A number distribution being higher in the central region (CR) below the Gaussian maximum than in the near-central region (NCR) below the Gaussian wing [A(CR) > A(NCR)]. The momentum M transferred to the fluid parcel depends on the local laser energy density and is also higher in the central region of the spot, than in the near-central region [M(CR) > M(NCR)]. In RT mixing flow, the dynamics of a fluid parcel is governed by a balance per unit mass of the rate of momentum gain M and the rate of momentum loss M ′. The rate of momentum gain is proportional to the energy gain induced by the buoyant force which is the function of the A number (Abarzhi, Reference Abarzhi2010). The rate of momentum loss is proportional to the rate of kinetic energy dissipation in turbulent mixing and formation of structures at the horizontal and vertical scales.
The laser-generated RMI/RTI structures that evolve on the surface stay frozen permanently because of the fast solidification after pulse termination making possible a posteriori analysis. Fast solidification of ablative RMI/RTI structures offers a direct view into their characteristics and organizational complexity, which in some other experimental concepts is very difficult to realize.
Such experimental concept offers possibility to study 3D RMI/RTI structures and the difference in their growth rate and size in the CR and the NCR. It gives insight into the formation of the large- and/or the small-scale structures, into the onset of the coherent flow, into the turbulent mixing-and-merging and into the spatial organization in these two regions of the spot.
We show that in the CR (below the Gaussian maximum), the high momentum transfer, the high A number, and the small (negligible) horizontal velocity component, form the coherent large-scale flow field and the small-scale incoherent field. The growing structures are analyzed and compared with 3D numerical simulation of RMI at large and small perturbation scales.
In the NCR (below the Gaussian wing), the smaller momentum transfer, the higher horizontal velocity component, and the smaller A number, form the small-scale coherent flow fields in various local domains, with the alignment of vorticity and self-organization of structures. These structures and their self-organization on discrete lattices are analyzed and compared with theoretical analysis and 3D simulations of RMI/RTI (Abarzhi, Reference Abarzhi1998; Reference Abarzhi2008).
2. EXPERIMENT
The experiments were performed by a Q-switched ND:YAG laser of energy E ~ 1.5 J on the titanium plates of 1 × 1 × 0.1 cm3 (melting point T M = 1933 K, boiling point T B = 3560 K), as schematically shown in Figure 1a. The laser beam of rectangular cross-section had the 1D Gaussian-like power distribution in the X-direction and a constant power in the Y-direction of the laboratory system (Fig. 1b). It has generated the spot of the size S = 0.1 cm × 0.35 cm = 0.035 cm2 (E s ~ 43 J/cm2; P s ~ 1.1 W/cm2; τ = 40 ns, λ = 10.6 µm). The target surface was roughly polished in order to introduce corrugations which serve as the origin of multi-modal perturbation. Two groups of random corrugations (scratches) were introduced: (i) the small-scale scratches with the scratch–scratch distance, d small scratch that varied from few hundreds nm to ≲1 µm and the amplitude, A 0 ~ 500 nm–2 µm; and (ii) the large-scale ones with the scratch–scratch distance, d large scratch ~ 40–60 µm. The multi-modal perturbation of the density interface consisted of a random combination of short-wavelength modes (incomensurate modes) and of the long-wavelength modes.
Layout of the experiment and the laser beam characteristics schematically. (a) A small He:Ne laser is put in the geometric axis of the beam for adjustment of the sample irradiation before the firing Nd:YAG laser. (b) Gaussian-like laser power distribution in the X-direction, and constant power distribution in the Y-direction. (c) Rectangular laser beam generates the spot with two regions: The CR below the Gaussian maximum, and the NCR below the Gaussian wing at both sides of the CR.

The laser beam was focused to the target surface by the cylindrical silica lens of the focal length f = 30 cm. The target was irradiated by the single pulse in the air at the atmospheric pressure. The 1D Gaussian-like power distribution generated the spot in which the CR below the Gaussian maximum, and the NCRs below the Gaussian wings, can be distinguished (Fig. 1c).
The experimental details and parameters responsible for the evolution of the RMI/RTI on the target surface, plasma detonation, and generation of the shock wave, as well as the reshock and the inversion of the vapor/plasma plume density due to compression of the background gas, are described in Supplement A.
The RMI structures that evolve on the surface are the spikes of a heavy fluid that have propagated into the light fluid (above the target) and stay frozen after pulse termination making possible a posteriori analysis. The shape and surface organization of RM/RT structures were studied by the scanning electron microscope (SEM) Hamamatsu. A more detailed study of the morphology, of the profiles, and of the amplitude variation along the selected sections, as well as the fast Fourier transform (FFT) of the modes have been done by the atomic force microscope (AFM), PSIA XE-100.
3. RESULTS AND DISCUSSION
The SEM micrograph (Fig. 2a) shows the rectangular Gaussian-like spot on Ti surface with RMI/RTI structures, which at magnification appear as the well-developed spikes [Fig. 2b(i, ii)]. The evolution of RMI/RTI spikes/bubbles is schematically shown in Figure 2c. The light fluid is on the top, and the arrows indicate the direction of the fluid motion at the tip of the bubble (down) and spike (up). The spike/bubble structures grow in the (X, Y)-plane normal to the direction of fluid acceleration, g, and show different shape and organization in the CR and the NCR.
The formation of ablative RM instability. (a) SEM micrograph of rectangular spot on Ti surface extending in the Y-direction (below the vapor/plasma cigar-like plume). (b) SEM micrograph of RMI surface morphology developed in the center of the spot (i). The RMI structures at large magnification show well-developed spikes (ii). (c) Formation of coherent structure of bubbles and spikes in the RMI. (i) The cross-section of the structure in the (Z, Y)-plane. The horizontal scale (spatial period) is λ, the vertical scale (amplitude) is h, g is the gravity. The light fluid is on the top, and the heavy one at the bottom; the arrows indicate the direction of the fluid motion at the tip of the bubble (down) and spike (up). (ii) Shear-driven small-scale structures produce a mushroom-shape spike. The coherent structure is periodic in the (X, Y)-plane normal to gravity (3D flow) or in one direction (2D flow).
3.1. Spike–bubble structures in the CR (A ~ 1)
3.1.1. Large-scale structures
The AFM micrographs in Figure 3 show the large regular hillocks and valleys (large-scale spikes and bubbles) which resemble the top and bottom of the oscillating rectangular membrane (the “egg-carton” morphology) and the number of small-scale superimposed random spikes and bubbles. The wavelength of the large-scale spikes ranges from λ ≲ 45 µm in Figure 3a, to ~50 µm in Figure 3b, and to λ ~ 60 µm in Figure 3c. It may be attributed to the long-wavelength perturbation on the surface corrugation, d scratch ~ 40–60 µm, indicating strong dependence on the initial conditions. The amplitude of the large spikes reaches ~(+) 1600 nm, and of bubbles ~(−) 600–700 nm in depth indicating approximately three times higher growth rates of spikes than of bubbles. This is in agreement with Alon et al. (Reference Alon, Ofer, Shvarts, Young, Glimm and Boston1966) that multi-mode RMI spike and bubble amplitude scale in different ways; the bubble amplitude h B scales as h B = αB•t•ΘB, where ΘB = 0.4 at all A, while the spike amplitude h S scales as h S = αS·t·ΘS, where ΘS depends on A, which does not appear in these relations (Alon et al., Reference Alon, Ofer, Shvarts, Young, Glimm and Boston1966). The αB and αS depend on the initial perturbation, and consequently the penetration of heavy fluid into the light fluid depends on the initial conditions at all times with A = 1. The spikes penetrate (at a constant velocity) as, h S = αS·t, (ΘS = 1), as compared with ΘB = 0.4 for the bubbles (Alon et al., Reference Alon, Ofer, Shvarts, Young, Glimm and Boston1966). Based on these relations one can explain why the growth of spikes in Figure 4a–4c is three times faster than in the case of bubbles (also in the region of a high density ratio, A ~ 1).
AFM micrographs of the CR showing the RMI structures. (a) Large-scale structures (hillock-valley) structures with λ ~ 45 µm, and superimposed small-scale structures. (b) Large-scale structures (hillock–valley) structures with λ ~ 50 µm, and superimposed small-scale structures. However, notice that there also appear the central hillock and valley which do not comprise any small-scale structure. (c) Large-scale structures (hillock–valley) structures with λ ~ 60 µm, and superimposed small-scale structures. Notice again, the central hillock and valley without any small-scale structure.
AFM micrographs showing a more detailed view of the central hillock and valley which do not comprise the small-scale structures. (a) Magnification of the large hillock (i) and the valley (ii) in Figure 3c reveals only a small surface irregularity. (b) Large micrograph of the hillock (i) and valley (ii) in Figure 4a reveals almost flat surface.
Consider the structures in Figure 3a–3c. One can see the central large-scale hillock (large spike) and valleys without any small-scale structure. At magnification, the large spike [Fig. 4a(i)] and bubble [Fig. 4a(ii)] show only small surface irregularities, possibly due to the fluid layer thinning. The layer thinning with tendency to zero-thickness does not enable the evolution of the small-scale RMI spikes and bubbles.
The large-scale “egg-carton” structures may be successfully compared with the large RMI structures numerically simulated assuming the single-mode (Miles et al., Reference Miles, Blue, Edwards, Greenough, Hansen, Robey, Drake, Kuranz and Leibrandt2005; Long et al., Reference Long, Krivets, Greenough and Jacobs2009) and the multi-modal perturbations Cohen et al., Reference Cohen, Dennevik, Dimits, Eliason, Mirin, Zhou, Porter and Woodward2002; Kartoon et al., Reference Kartoon, Oron, Arazi and Shvartz2003). An example are the large “egg-carton” structures obtained for the vertical interface oscillation in a square as a single-mode 3D perturbation
 $$z(x,y) = {a_0}\cos \,({k_x}x)\cos \,({k_y}y),$$
where a 0 = 3.45 mm, k x = k y = √2 π/W, and W = width of the test section, for the weak shock of M a = 1.22 and the low Atwood number A = 0.65 (Long et al., Reference Long, Krivets, Greenough and Jacobs2009).
The large hillock–valley structure – the “egg-carton interface” – was also obtained by Miles et al. (Reference Miles, Blue, Edwards, Greenough, Hansen, Robey, Drake, Kuranz and Leibrandt2005). They used multi-mode 3D perturbation and the “mode 4-run” given by z(x, y) = a 0cos(k 4x)cos(k 4y), where k 4 corresponds to the l = 4 mode. The perturbation amplitude was a 0 = 2.5 µm, the Atwood number was A = 0.7, while the Reynolds number, Re,
 $$Re\; = \displaystyle{{hv} \over v}, $$
(h is the height of the vertical structure, v is the fluid velocity, and ν is the kinematic viscosity), varied in time reaching Re = 4400 at the end of pulse at t = 40 ns (Miles et al., Reference Miles, Blue, Edwards, Greenough, Hansen, Robey, Drake, Kuranz and Leibrandt2005).
The most complex 3D numerical simulation of RMI with a two scale initial perturbation which has given the regular egg-carton interface as well as the superimposed random small-scale structures – quite similar to our experimental ones – was performed by Cohen et al. (Reference Cohen, Dennevik, Dimits, Eliason, Mirin, Zhou, Porter and Woodward2002). The surface displacement at the interface for the membrane shocked through the grid was (Cohen et al., Reference Cohen, Dennevik, Dimits, Eliason, Mirin, Zhou, Porter and Woodward2002; Martin et al., Reference Martin, Taylor, Wu and Weirs2006; Schilling & Latini, Reference Schilling and Latini2010)
 $$z = {A_0}[ \vert \sin \,({k_x}) \vert \vert \sin \,({k_y}) \vert -\cos \,(2{\rm \pi} x)\cos \,(2{\rm \pi} y)],$$
where A 0 is the non-dimensional perturbation amplitude A 0 = 0.01 (A 0 = a 0/λp, λp is the perturbation wavelength), and k is the scaled wavenumber defined by k = k⊿ = 10π (k is the wavenumber in cm−1 and ⊿ is the grid spacing in cm). The first term |sin(k x)∣|sin(k y) represents the small-scale perturbation associated with pushing the membrane through the wire grid. The second term cos(2πx)cos(2πy) which represents the perturbation associated with the transverse dimension of the shock tube scaled to have width of 2π (Cohen et al., Reference Cohen, Dennevik, Dimits, Eliason, Mirin, Zhou, Porter and Woodward2002; Schilling & Latini, Reference Schilling and Latini2010). The conjecture with our experiment is that the first term may indicate the local deformation of the target with the large-scale perturbation scratches (40–60 µm), while the second term indicates the perturbation of the fluid layer in the transversal direction of the rectangular spot. The numerical simulation performed at about 8 billion computational zones reveals the growth, organization of the RMI structures, and their subsequent mixing in non-dimensional time (Cohen et al., Reference Cohen, Dennevik, Dimits, Eliason, Mirin, Zhou, Porter and Woodward2002) (Figure 5). The Re number ranged from 1700 to 8000 indicating that the mixing transition occurs for a macroscale Re number of the order of 104, in agreement with Dimotakis (Cohen et al., Reference Cohen, Dennevik, Dimits, Eliason, Mirin, Zhou, Porter and Woodward2002; Dimotakis, Reference Dimotakis2000). The variable plotted in Figure 5 is the entropy S chosen because it displays the contact discontinuity. The color mapping is chosen to be transparent red on the high density (low entropy and low temperature) side and transparent blue on the low-density side of the contact discontinuity (Cohen et al., Reference Cohen, Dennevik, Dimits, Eliason, Mirin, Zhou, Porter and Woodward2002). The formation of the large “egg-carton” spike/bubble structures with the superimposed small-scale ones, very similar to our micrographs in Figure 3a–3c, is clearly visible.
Numerically simulated growth of RMI and turbulent mixing. The variable plotted is the entropy S chosen because it displays the contact discontinuity. The color mapping is chosen to be transparent red on the high-density (low entropy, low temperature) side and transparent blue on the low-density side of the contact discontinuity. Notice the formation of the large-scale hillock–valley structures (spike/bubble structures) with the superimposed small-scale ones, similar to Figure 3a–3c. Courtesy of Dr. R.H. Cohen. Reproduced with permission from [Cohen et al., Reference Cohen, Dennevik, Dimits, Eliason, Mirin, Zhou, Porter and Woodward2002]. Copyright [2002], AIP Publishing LLC.
Regarding the small-scale structures in the micrographs (Fig. 3a–3c), we assume that they appear at the places where the liquid layer thickness is increased (interface thickening). The increase of the local fluid layer thickness resembles the local shock-induced flat membrane (interface) thickening in agreement with Vetter and Sturtevant (Vetter & Sturtevant, Reference Vetter and Sturtevant1995).
The random small-scale structures in Figure 3a–3c evolve from the incommensurate modes of the small scratch wavelength on the target surface (and of the eventual harmonics). The simulated small-scale structures in the shock tube evolve for the initial perturbation 2k/(2π) with the maximum allowed choice for k ~ 30 (Cohen et al., Reference Cohen, Dennevik, Dimits, Eliason, Mirin, Zhou, Porter and Woodward2002). As seen in Figure 5, they show very good regular organization for 1.5 ≥ t ~ 4.5, with the onset of randomization and turbulent mixing for t > 4.5 (Cohen et al., Reference Cohen, Dennevik, Dimits, Eliason, Mirin, Zhou, Porter and Woodward2002). Consequently, our small-scale structures in Figure 3a–3c which all are random and belong to the strong turbulent mixing, can be favorably compared with these “late time” small-scale structures for t > 4.5 (especially with those for t = 9), in Figure 5 of Cohen et al. (Reference Cohen, Dennevik, Dimits, Eliason, Mirin, Zhou, Porter and Woodward2002).
3.1.2. Small-scale spikes randomly organized
The analysis of the small-scale RMI spikes in Figure 3 can be started from their 2D topographic image in Figure 6a(i). The cross-section of the AFM data along the (white) line shows the variation of amplitude between h S ≳ 200 and 220 nm (spikes), and h B ~ (−) 80 nm (bubbles) [Figure 6a(ii)]. Comparison of the amplitudes of small spikes h S and bubbles h B indicates the slower growth rate of bubbles than spikes, h B/h S ~ 0.36–0.4 ~ 0.4 for the RMI, again in agreement with Alon et al. (Alon et al., Reference Alon, Ofer, Shvarts, Young, Glimm and Boston1966).
Characteristics of the RMI small scale structures. (a) 2D AFM topographic image of the structures in Figure 3a, (i); Section analysis along the white line in (i) shows variation of surface amplitude (ii); Histogram of the FFT modes (iii). Spectral amplitude rms = 0.308 nm. (b) 2D AFM topographic image of the structures in Figure 3c, (i); Section analysis along the white line in (i) shows variation of amplitude of spikes and bubbles (ii); Histogram of the FFT modes (iii). Spectral amplitude rms = 0.033 nm.
Considering the modes that take place in the RMI structure formation, the histogram of discrete 1D FFT in Figure 6a(iii) shows their relative amplitude versus frequency, ranging from DC (zero frequency) to Min (minimal frequency difference that can be resolved), along the section length. About ~30 Fourier modes have the amplitude which exponentially decreases to zero for N > 30, and the root-mean-square (rms) amplitude = 0.308 nm.
The 2D topographic image and the analysis of AFM data along the selected line in Figure 6b(i) – (that corresponds to Fig. 3a) – reveals the variation of amplitude between ~(–) 100 nm and ~(+) 150 nm and of the wavelength between λ ~ 5 and 8 µm [Fig. 6b(ii)]. The corresponding FFT histogram in Figure 6b(iii) shows an intermittent spectrum of modes with the amplitude which decreases from maximal to the zero value for N > 40. The rms amplitude = 0.033 nm, that is, one order of magnitude lower than in the case above.
3.1.3. Small-scale aperiodic spikes organized into wavy structures: The rows
The AFM analysis of patterns in Figure 3 – besides the domains of completely random small-scale spikes – reveals the domains of ~100 × 100 µm2 in size with sharp spikes organized into wavy-like rows (Fig. 7a). Mostly asymmetric spikes, characteristic for the large A numbers (Long et al., Reference Long, Krivets, Greenough and Jacobs2009), are fully or partially merged along the rows. The rows are almost parallel to the Y-axis of the laboratory system, that is, they extend along the direction of the constant laser power distribution (Fig. 7b).
AFM micrograph of the RTI structures in the CR showing small-scale structures organized into rows. (a) The rows of spikes in the domain of ~100 × 100 µm2. (b) The rows of spikes in the domain of ~55 × 35 µm2.
3.1.4. Mixing and merging of aperiodic spikes along the rows
The analysis of rows indicates that mixing and merging and transition to turbulence dominantly occur along the Y-axis. It is known that the transition to turbulence occurs in the domains where the shear layers from individual spikes have merged, due to the process which is seeded by the small-scale incomensurate perturbation modes (Miles et al., Reference Miles, Blue, Edwards, Greenough, Hansen, Robey, Drake, Kuranz and Leibrandt2005). Assume, for the simplicity, that merging occurs only along the rows as a quasi-2D process without interaction with the neighbor rows. Thus, the size of the rows or the “chain-like domain” determines the size of the mixing zone. The length of the rows ranges from L ~ 100 to 150 µm, while their width is about W ~ 5 µm, so that the size of the mixing zone ranges from ≲500 to ~750 µm2.
However, a detailed view of Figure 8a reveals that the rows are the irregular lines with slight lateral fluctuation (zigzag like) because the neighbor off-line-spikes (at the lateral distance equal or smaller than the half of the spike width), become also merged into the same row. It means that such lateral interaction of spikes increases the width of the mixing zone to W ~ 10–15 µm, so that the size of the mixing zone reaches ≲1000–2250 µm2. According to Miles et al. (Reference Miles, Edwards, Blue, Hansen and Robey2004), the transversal merging may be connected with compressibility effects of the quasi-2D evolution of hydrodynamically unstable interfaces. In fact, for the high Mach numbers the pressure associated with kinematic drag on developing spikes can be sufficient to partially redirect spike growth into the direction transverse to the Y-axis (Miles et al., Reference Miles, Edwards, Blue, Hansen and Robey2004).
Mixing and merging of the sharp spikes in the segment of the length L ~ 8300 nm selected from the long row. (a) The AFM micrograph of the domain in the CR showing mixing and merging of sharp spikes. The rows are not perfect lines but the irregular ones, because the neighbor off-line-spikes (at the lateral distance equal or smaller than the half of the spike width), are also merged into the same row. The interval between the spikes (the segment length) is marked l 1, l 2,…,l n, while the height of the segments (between the spikes) is marked h 1, h 2,…,h n. (b) Diagram of the mixing and merging cycles of spikes, Δ versus Γ, along the segment L = 8300 nm, shown in Figure 8a. Notice that periods Δ = 1 and 2 are the stable periods, while all other periods (between them) are unstable. Behavior of the unstable cycles resembles the kicked oscillator which is pushed from the stable oscillation into the unstable one until it falls into the stable period again. Thus, the periods represent the limit cycles of the supercritical Hopf bifurcation.
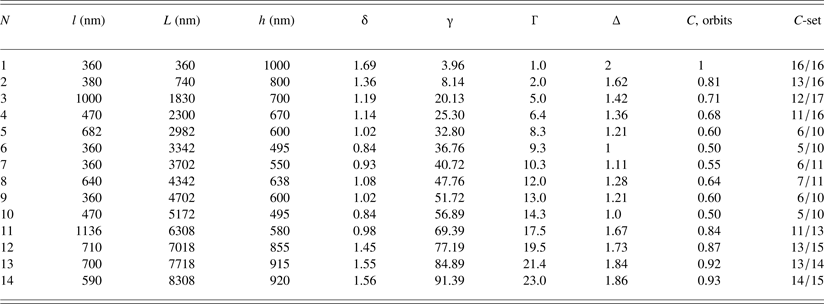
To analyze the mixing and merging process we select a short part of the length, L ~ 8300 nm, from the row; Figure 8a. The distance (segment) between the two spikes is marked by l 1, l 2, l 3, …, l n (n = 1,…,14), and the corresponding height of the segments by h 1, h 2,…,h n (Table 1). The average length of the segments “l” is assumed to be a quasi-period, λ (“l” = λ = 590 nm), with the corresponding average wave vector k (k = 2π/λ = 6.28/590 = 0.011 nm−1). From Figure 8a and Table 1, it follows that the ratio of the spike amplitude and the wavelength h S/λ ~ 1–2 (h S ≳ λ), indicating fast linear growth of sharp asymmetric spikes.
Characteristics of merged spikes along the row in Figure 8a.
The length of the row of merged spikes, L ≂ 8300 nm; the average wavelength between the spikes “l” = λ=8300/14 ~ 590 nm; h, height of the interval of merged spikes; average wave vector “k” = 2π/λ = 6.28/590 ~ 0.011 nm−1; L = l 1 + l 2 + · · · + l n; Γ = γ/γmin [γ = (L·k)/3.96, γmin = 3.96]; δ = h/λ; ∆ = δ/δmin (δmin = 0.84); C, orbits shown as the fraction of period 2.
The insight into turbulent mixing is obtained from the ratio, δn (δn = h n/λ ) in Table 1, which reveals the repetition at δn = 1, δn = 24, δn = 6, and δn = 10, indicating cyclic nature of the process along the row. Better insight gives the set of ratios, ∆n (∆n = δn/δmin; δmin = 0.84), which shows that the system returns to the same value ∆n = 1 and ∆n = 24 as well as to ∆n = 6 and ∆n = 10 (which represent the steady states). These states may be identified as the stable periods P = 1 and 2. All other ∆-values represent the unsteady states, or the unstable cycles in the mixing process along the row.
Better insight into the mixing cycles along the row is obtained if the non-dimensional variable γ (γn = L nk), is introduced. Normalizing γ to the minimal value (γmin = 3.96) gets the new variable, Γ = γ/γmin, what makes possible to present the diagram of mixing and merging cycles, Δ versus Γ (Fig. 8b). At Γ = 1, one finds the first stable period P 1 = 2 which decreases intermittently through the unstable cycles until at Γ = 9.3 the cycle P 2 = 1 is reached as the next stable period. With further increase of Γ, the cycle increases intermittently to P = 1.28 at Γ = 12, and then decreases reaching again P 2 = 1 at Γ = 14.3. Beyond this value, the unstable cycle intermittently increases up to P = 1.86 at Γ = 23.0 and eventually comes to the stable period P 1 = 2 at Γ > Γ14. The behavior of the unstable cycles resembles the kicked oscillator which is pushed from the stable into the unstable oscillation until it falls into the stable period again (Table 1). Thus, the periods P = 1 and 2 represent the limit cycles of the Hopf bifurcation. Since all unstable cycles tend to the stable ones, the Hopf bifurcation is supercritical.
Expressing ∆n as the fraction of the largest limit circle (P = 2), gives the Cantor set, C
 $$\eqalign{C = & \; 16/16,\,\,13/16,\,\,12/17,\,\,11/16,\,\,6/10,\,\,5/10,\,\,6/11, \cr & 7/11,\,\,6/10,\,\,5/10, 11/13,\,\,13/15,\,\,13/14,\,\,14/15, \ldots,} $$
which is not the Cantor fractal set because n is finite and short Table 1. However, one can assume that there exist many narrow spikes, which are also merged but cannot be distinguished due to limited resolution of the microscope. In that case, n is very large (it may be assumed n → ∞), and the set C becomes a fractal Cantor set. Obviously, the l n and h n become small, what has the consequence that δn tends to the same value (becomes constant) indicating – self-similarity – characteristic for the turbulent mixing process (Shvarts et al., Reference Shvarts, Sadot, Oron, Kishony and Srebro2000; Llor, Reference Llor2003). Therefore the self-similarity appears in CR where the spikes are arranged into rows.
3.1.5. Small periodic spikes inside the row of aperiodic spikes: No spike merging
In some long rows the periodic intervals of spikes appear inside the aperiodic ones (Fig. 9a). Their wavelength λ ~ 15–20 µm and the height h s ~ 1000 nm [Fig. 9b(i, ii)] give the ratio h S/λ = 0.05–0.07, (h S ≪ λ), which indicates slow nonlinear growth. The sharp aperiodic spikes (at both sides of the periodic intervals) have h s ~ 1000 nm and the wavelength λ ~ 7–10 µm, so that their ratio h S/λ = 0.10–0.14, (h S < λ), indicating faster growth. However, their growth although faster than of the periodic spikes is not as fast as in the case of the aperiodic spikes, considered above. One can say that the appearance of the periodic spike intervals – as the consequence of locally coherent flow – slows down the mixing process along the row. The periodic spike organization on the symmorphic pm11 symmetry group (Abarzhi, Reference Abarzhi2008) is characteristic for 2D flow (Y, Z) what is an argument in favor of our quasi-2D treatment of the spike organization into rows. In the other domains, the periodic segments of spikes are arranged in two parallel rows. The AFM in Figure 10a (side view) shows periodic spike segments (shifted one with respect to the other), that belong to the anti-simmorphic p2gm group (Fig. 10b), formed by the combination of translation and reflection (glide planes) (Abarzhi, Reference Abarzhi2008). Thus, the spikes inside the same row appear organized in two space groups, the symmorphic and the anti-symmorphic.
AFM micrograph of the domain of the CR showing the rows of spikes almost parallel to the Y-axis of the laboratory system. (a) The sharp spikes are symmetric and show the segments of periodic organization among the aperiodic ones. (b) Periodic spike organization (i), (ii) belongs to the same pm11 symmetry group characteristic for 2D flow.
AFM micrograph of the domain of the CR showing two parallel rows of spikes. (a) Two parallel rows of periodic spikes organized on the p2gm anti-symmorphic symmetry group. (b) Geometry of the p2gm symmetry group.
The space group G describes the symmetry operations of an organized structure consisting of a lattice which can be generated by successive translations of primitive vectors and a basis that may possess point-group operations: Rotations, inversions, and reflections (Liao, Reference Liao2012). The basic difference between these two space groups is that for a symmorphic space group all the translational and non-translational elements form the point group, which is a subgroup of the space group. For an anti-symmorphic space group, however, the non-translation elements do not form a subgroup of the space group (Liao, Reference Liao2012) (see Supplement B).
The effect of viscosity on the evolution of such RMI structures is expressed through the Reynolds number. Assuming the kinematic viscosity of light-fluid ν ~ 2 × 10⁻⁷ m2/s, the linear dimension of fluid motion due to vertical shock perturbation, h s ~ 0.6–0.8 µm, and the velocity of the accelerated light-fluid v ~ 2100 m/s, one finds the Re number for the light-into-heavy fluid penetration, Re = h sv/ν ~ 6.1 × 10³–8.4 × 10³, in good agreement with the Re numbers of Cohen et al. (Reference Cohen, Dennevik, Dimits, Eliason, Mirin, Zhou, Porter and Woodward2002) and Dimotakis (Reference Dimotakis2000).
Notice that in the qualitative sense the sharp RMI spikes for A ~ 1 and Re ~ 6.1 × 10³–8.4 × 10³ treated as the quasi-2D phenomenon, are in very good agreement with the sharp spikes obtained by Abarzhi and Hermann (Reference Abarzhi and Hermann2003) for the similar parameters A ~ 0.9, and Re = 6.97 × 103 by 2D numerical simulation.
3.2. Spike–bubble structures in the NCR (A < 1)
3.2.1. Discrete self-organization of mushroom-shape spikes
The AFM micrograph of the NCR in Figure 11a of ~100 × 100 nm2 in size shows quite different shape of RTI spikes. The symmetric spikes – characteristic for the lower A numbers (Long et al., Reference Long, Krivets, Greenough and Jacobs2009) – are not organized into rows except those in some smaller domains. In the NCR, the transition to mixing occurs in a different way than in the CR due to formation of correlated flow field in localized domains.
AFM image of the domain of the NCR showing the small-scale structures organized on 2D lattice in the (X, Y)-plane. (a) Domain of the size ~100 × 100 µm2. (b) Characteristics of the small-scale structures. (i) 2D AFM topographic image of the structures in Figure 11a; (ii) section analysis along the white line in (i) shows variation of amplitude of spikes and bubbles; (iii) Histogram of the FFT modes along the white line in (i). Spectral amplitude rms = 0.006 nm.
The 2D topographic image and the cross-sectional analysis of the AFM data along the selected line in Figure 11b(i) show the surface variation between ~(–) 100 and ~(+) 200 nm and of the wavelength between λ ~ 3.5 and ~10 µm [Fig. 11b(ii)]. General observation is that in the NCR the horizontal scale of the small structures grows much faster than the vertical one. The corresponding FFT histogram shows an intermittent spectrum of modes with the amplitude which decreases from maximum to the zero value for N > 20 [Fig. 11b (iii)]. Spectral amplitude rms = 0.006 nm, that is, it is extremely small and does not have any influence on the linear growth saturation.
Different type of the spike shape and organization as the result of 3D flow correlated in the (X, Y)-plane, is observed in the smaller domains of the NCR. An example is the domain of ~10 × 10 µm2 in size with thick mushroom-shape spikes of the height h S ~ 0.2–0.3 µm and the period, λ1 = λ2 = λ ~ 3.2 µm (Figure 12a). The corresponding isotropic square lattice (p4mm) has the inversion point and is therefore a stable structure (Abarzhi, Reference Abarzhi1998; Reference Abarzhi2008). The ratio h S/λ ~ 0.06–0.09, (h S ≪ λ), indicates slow nonlinear growth of spikes. Notice that the dark concave-spaces (between the mushroom-shape spikes) indicate bubbles (of upper light fluid growing into the lower dense fluid). The bubbles are almost flat – the phenomenon which occurs in the late phase of the RMI/RTI (Abarzhi et al., Reference Abarzhi, Nishihara and Glimm2003).
Domain of the NCR showing the mushroom-shape spikes organized on 2D lattice in the (X, Y)-plane. (a) AFM image of the domain ~ 10 × 10 µm2 (square lattice), λ1 ~ 3.2 µm, λ2 ~ 3.2 µm. (b) AFM image of the domain ~ 10 × 10 µm2 (rhombic lattice), λ1 ~ 3.2 µm, λ2 ~ 3.2 µm. (c) Organization of the mushroom-shape spikes on the square and the rhombic lattices with the c4mm and cmm symmetry groups, respectively (transformation between the lattices).
The transformations of organization of the mushroom-shape spikes in the inhomogeneous flow field occur independently in the local domains. The domain in Figure 12b shows spikes organized on the (cmm) rhombic lattice with the same period (λ1 = λ2 ~ 3.2 µm) as of the rectangular one in the case above. The dark, slightly concave spaces between the spikes are flat bubbles. The transformation between two latices is shown in Figure 12c.
Figure 13a(i) of the domain of ~20 × 20 µm2 in size shows the mushroom-shape spikes organized on the lattice (λ1 ~ 6.5 µm, and λ2 ~ 9.5 µm) that belongs to the p2 symmetry group [Fig. 13a(ii)]. Again, the dark spaces (which seem more curved than in the case above), are the flattened bubbles (Abarzhi et al., Reference Abarzhi, Nishihara and Glimm2003).
Domain of the NCR showing the mushroom-shape spikes organized on 2D lattice in the (X, Y)-plane. (a) AFM image of the domain ~20 × 20 µm2 with λ1 ~ 6.5 µm, λ2 ~ 9.5 µm (i); Organization of the mushroom-shape spikes on the rhomboid lattice with p2 symmetry group (ii). (b) AFM image of the domain ~ 40 × 40 µm2 with λ1 ~ 9.5 µm, λ2 ~ 13 µm (i); Organization of the mushroom-shape spikes on the rhomboid lattice with p2 symmetry group (ii).
Figure 13b(i) of the domain of ~30 × 30 mm2 in size shows the mushroom-shape spikes organized on the periodic lattice (λ1 ~ 9.5 µm, and λ2 ~ 13 µm), which also belongs to the same p2 symmetry group and represents the stable structure [Fig. 13b(ii)]. Since the height of the spikes, h S ≲ 1.0 µm, the ratio h S/λ ~ 0.07 indicating a slow nonlinear growth of spikes. Notice that some of the bubbles are only slightly curved (almost flat), whereas the others (dark ones) are more curved and deeper. In a qualitative sense, the 3D flattening of the bubble surface in Figures 12 and 13 can be favorably compared with the bubble curvature obtained by numerical simulation of Abarzhi and Hermann (Reference Abarzhi and Hermann2003), although their simulation is 2D.
According to Abarzhi et al. (Reference Abarzhi, Nishihara and Glimm2003), the bubble curvature and velocity in RMI, change and in the linear regime their curvature reaches the extreme value, dependent on the initial conditions. As t/τRM → ∞ the bubble flattens and decelerates. For A < 1, the bubbles move faster than those for A = 1, and for A ≤ 1 the bubbles are flat. The flattening of the bubble front is a distinct feature of RMI universal for all A (Abarzhi et al., Reference Abarzhi, Nishihara and Glimm2003).
The horizontal scales λ1 and λ2 increase from Figures 12 to 13. The selection of scales is a result of the horizontal flow field which transforms the isotropic lattice into the anisotropic. The fluid acceleration is inhomogeneous and the organization of mushroom-shape spikes in various domains has different lattice periods λ1 and λ2. The isotropic square lattice in Figure 12 (p4mm) with λ1 = λ2 = λ ~ 3.2 µm is transformed into the rhombic one (cmm) with the same period λ. The rhomboid structure (p2) in Figure 13a, has λ1 ~ 6.5 µm (which is ~2λ), and l2 ~ 9.5 µm (which is just ~ 3l). Also, the structure in Figure 13b, has λ1 ~ 9.5 µm which is ~3λ, whereas λ2 ~ 13 µm which is just 4λ. Therefore, the lattice periods λ1 and λ2 become two, three, or four times larger indicating formation of superstructure with double, triple, or quadruple lattice size (Abarzhi et al., Reference Abarzhi, Nishihara and Glimm2003). Characteristic of the isotropic turbulence is that the local momentum is balanced (Mlocal = 0), while the time- and scale-invariance of the energy dissipation rate is comparable with the inertial interval and non-dissipative energy transfer between the scales (Abarzhi & Rosner, Reference Abarzhi and Rosner2010). In accelerated turbulent mixing, the local momentum is imbalanced (Mlocal ≠ 0), and time- and scale-invariance imply that at any time and length scale the specific momentum is being lost at the same constant rate, and momentum transfer between the scales is non-dissipative (Abarzhi & Rosner, Reference Abarzhi and Rosner2010).
Assuming for the NCR, the kinematic viscosity of light-fluid ν ~ 10−7 m2/s, the velocity of the accelerated light-fluid v ~ 2100 m/s, the height of linear dimension of fluid motion is, h s ~ 0.35–0.50 µm, one finds the Re number for the light-into-heavy fluid penetration, Re ~ 7.35 × 10³–1 × 10⁴, that is, or Re ~ 104.
4. CONCLUSION
In this experimental study, the 1D Gaussian-like laser pulse caused the ablative RMI/RTI by the plasma detonation above the metal target. Fast solidification of ablative RMI/RTI structures makes possible a posteriori analysis and the direct insight into their formation and organizational complexity, resulting from the multi-modal perturbation of the density interface. The analysis revealed different characteristics of spikes and bubbles and of the mixing process caused by the inhomogeneous momentum transfer and the A number in different regions (the CR and the NCR) of the Gaussian-like spot.
CR: (A ~ 1, Ra ~ 103). Below the Gaussian maximum, the RMI/RTI spikes and bubbles appear in two different ways: (i) as the regular “egg-carton morphology” of large-scale spikes and bubbles with superimposed random small-scale ones; and (ii) as the wavy-like rows of small-scale asymmetric spike and bubbles with disturbed periodicity. The following conclusions are drawn:
(a) The growth rate of the large-scale spikes is about three to four times faster than of bubbles indicating scaling according to different laws.
(b) The wavy-like rows of small-scale spikes caused by the surface tension along the thermal gradient ΔT x. The small-scale sharp aperiodic spikes result from the fast linear growth. The rows are oriented in the direction of the constant power distribution and represent a quasi-2D phenomenon of (Z, Y) flow. Turbulent mixing and merging occurs along the rows seeded by the incommensurate perturbation modes; it occurs in the unstable cycles oscillating as the kicked oscillator between two stable periods. The tendency of unstable cycles to the stable ones with periods 1 and 2 (as the limit cycles) represents the supercritical Hopf bifurcation. The mixing and merging cycles form self-similar structures that represent a Cantor set.
(c) The rows of aperiodic spikes which comprise the periodic spike-segments also represent a quasi-2D process in the (Z, Y)-plane. Such organization results from the locally coherent flow. The intervals of the coherent flow appear inside the incoherent flow field (along the rows) with the nucleation of 1D periodic lattice segments inside the aperiodic ones.
NCR: (A < 1, Ra ~ 104). Below the Gaussian wing, the RMI/RTI spikes and bubbles appear as the mushroom-shape spikes organized on discrete symmetry lattices. The organization of symmetric mushroom-shape spikes appears via “nucleation” of one or two cells in various domains as the result of locally coherent flow. The “nucleation” of the isotropic square lattice appears due to balanced local momentum (Mlocal = 0). The lattices in other domains are anisotropic showing multiplication of the lattice periods. In these domains, the isotropic square lattice with λ1 = λ2 = λ, is transformed into the rhombic one with the same period λ. In other domains, it is transformed into the rhomboid either with λ1 ~ 2λ and λ2 ~ 3l, or with λ1 ~ 3λ and λ2 ~ λ. The increase of the periods λ1 and λ2 for two, three or four times indicates formation of superstructure with double, triple, or quadruple lattice size as the result of the imbalanced local momentum (Mlocal ≠ 0).
The growth of symmetric cells of the mushroom-shape spikes in local domains increasingly covers the surface area. The nucleation of the new phase inside the old one represents the analogy with the phase transitions.
The growth of RMI/RTI spikes is the result of both, horizontal, and vertical flow fields. However, in the CR the growth of sharp asymmetric spikes is an energetic uncorrelated and fast linear process, while in the NCR, the growth of thick symmetric mushroom-type spikes is much slower, correlated, and nonlinear process.
ACKNOWLEDGMENTS
This work was supported by the Croatian Science Foundation under the project: No. IP-2014-09-7046. The author is grateful to Professor N. J. Zabusky, Weizmann Institute of Science, Rehovot, Israel, for extremely helpful discussions of the literature, particularly emphasizing simulations of the RM instability and turbulence and their relation to experiments.
Supplementary material
To view supplementary material for this article, please visit http://dx.doi.org/10.1017/S0263034615000956.