INTRODUCTION
Aspidochirote holothuroids are amongst the most important bioturbators of sediments in many marine ecosystems (Massin, Reference Massin, Jangoux and Lawrence1982). Aspidochirotes ingest the uppermost few millimetres of surface sediment, include organic and inorganic compounds, and reject the non-assimilated fraction in their faeces (Uthicke, Reference Uthicke1999). During transit through the digestive tube, organic and inorganic fractions are digested, but only a portion of the ingested molecules is assimilated into the organisms' tissues. It is now broadly accepted that holothuroids assimilate carbon from bacteria and diatoms, in addition to carbon made labile as a result of microbial degradation (Yingst, Reference Yingst1976; Massin, Reference Massin, Jangoux and Lawrence1982; Lopez & Levinton, Reference Lopez and Levinton1987). However, this understanding is based on a very small number of direct and indirect observations, either using labelled tracers or deduced from various experiments on sea cucumbers, respectively. Amongst the direct observations, Yingst (Reference Yingst1976) ably demonstrated that Parastichopus parvimensis assimilates species of diatoms of the genus Nitzschia and uptakes labelled carbon (14C) from bacteria. Baird & Thistle (Reference Baird and Thistle1986) demonstrated that exopolymers produced by the estuarine marine bacterium Pseudomonas atlantica could be a source of nutrition for the deposit-feeding holothuroid Isostichopus badionotus. Several studies exploring sea cucumber assimilation include indirect observations showing that their foregut contains more bacteria and diatoms than either the surface sediment or the hindgut (Taddei, Reference Taddei2006; Plotieau et al., Reference Plotieau, Lavitra, Gillan and Eeckhaut2013a). These studies suggest that holothuroids select bacteria and diatoms in the sediment and/or culture them in the foregut and then digest them. Moreover, some species are able to make patch selectivity: Stichopus chloronotus selects sediments with the highest content of microalgae (Uthicke & Karez, Reference Uthicke and Karez1999). In the same way, Slater & Jeff (Reference Slater and Jeffs2010) demonstrated that Australostichopus mollis displayed better growth when higher microphytobenthic activity was recorded. Some Mediterranean holothuroids ingest both coarse and fine sediment, while others select fine to very fine sediment (Mezali & Soualili, Reference Mezali and Soualili2013). Belbachir et al. (in press) also demonstrated that Mediterranean holothuroids show selectivity for organic matter: H. sanctori is the most selective species, followed by H. forskali, H. poli and H. tubulosa. They attribute these differences to the various micro-distribution of species in the different habitats of Posidonia meadows.
Holothuria scabra occurs in areas of shallow sea in the Indo-Pacific, featuring sandy–muddy bottoms and generally colonized by seagrass beds. Holothuria scabra is an important member of these ecosystems (Wolkenhauer et al., Reference Wolkenhauer, Uthicke, Burridge, Skewes and Pitcher2010); it has a diurnal cycle with adults that remain buried in the upper layer of sediment during the day and move out to forage at night (Mercier et al., Reference Mercier, Battaglene and Hamel1999). Although H. scabra is widely distributed and is one of the best candidates for the development of a sustainable tropical sea cucumber aquaculture, very little information is available on the fraction of organic sediment it assimilates. In this study we tested various 15N-labelled sediment components to better understand what fractions of the sediment organic matter are incorporated into its tissues.
MATERIALS AND METHODS
Experiments were conducted at the Polyaquaculture Research Unit of the Institut Halieutique et des Sciences Marines (University of Toliara; Madagascar) (www.polyaquaculture.mg) using H. scabra juveniles obtained from Madagascar Holothurie S.A. (Eeckhaut et al., Reference Eeckhaut, Lavitra, Rasolofonirina, Rabenevanana, Gildas and Jangoux2009). Larvae were raised for 2 wk in hatchery tanks and, after metamorphosis, juveniles of H. scabra were kept in the tanks for a further 2 wk. Following this, they were used for the experiments (30 d old, ~2 cm long and from 38 to 88 mg; see Table 1).
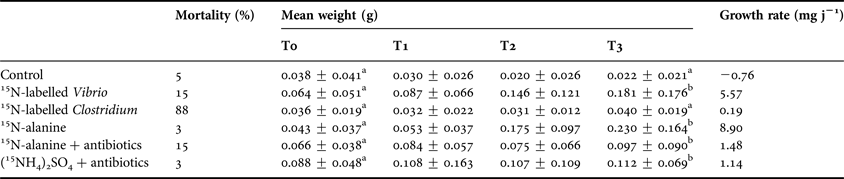
Mortality rate, growth rate calculated at the end of the experiments and mean weight (±standard deviation) of Holothuria scabra juveniles. T0, T1, T2, T3 = time at the beginning, after 1, 2 and 3 wk of the experiments, respectively. Values in a same column sharing at least one symbol (a, b) did not differ significantly (Tukey's HSD test; α = 0.05).

In order to study which organic fractions from the sediments are assimilated by H. scabra, five treatments and one control were conducted. In each of these treatments and in the control, 32 H. scabra individuals (192 individuals in total) were first acclimatized in the aquaria for 1 wk before the beginning of the study and then reared for a further 3 wk in aerated 50 l aquaria containing a 5 cm layer of sediment taken from natural seagrass beds (density of 150 ind m−2).
All living individuals were weighed each week (at T0, T1, T2 and T3) over the duration of the study. A weight record was made by immersing individuals freshly collected from the experiment tank in sterile seawater. Weights were measured three times for each individual (replaced in sterile seawater for 10 min between each measurement) with a high precision balance (precision of 1 mg). With the exception of the experiment with Clostridium (where a high mortality was recorded) a minimum of 15 individuals from each experimental group were weighed each week. Mortality rates were also recorded.
After the acclimatization period (T0), 1 wk later (T1) and at the end of the treatment 3 wk later (T3), six juveniles from each of the six aquaria were placed separately in a tank containing only seawater for 48 h in order to eliminate gut content and any labelled compounds not integrated in their tissues. They were then oven-dried at 60°C for 48 h, before being crushed with a mortar and pestle to obtain a fine powder. The powder was then acidified with 37% fuming HCl in a bell jar for 48 h in order to remove skeleton carbonates. Isotopic ratios and elemental content measurements were performed with a mass spectrometer (VG Optima, Isoprime, UK) coupled to a C–N–S elemental analyser (Carlo Erba, Italy) for combustion and automated analysis. Relative concentration of nitrogen is expressed as a percentage relative to dry weight (N%DW). Isotopic ratios are presented as δ values (‰), expressed relative to atmospheric N2. Reference materials were IAEA-N1 (δ15N = +0.4 ± 0.2‰). Experimental precision (based on the standard deviation of replicates of an atropina standard) was 0.4‰. Atom% notation (15N atom%) was also used to calculate the quantity of tracer assimilated by H. scabra over time at the end of the experiment. This quantity was calculated according to:
 $${}^{15}\hbox{N}_{\rm excess} = \% {}^{15} \hbox{N}_{\rm excess} \times \hbox{N} \% \lpar DW\rpar \times \hbox{final biomass}$$
%15Nexcess was obtained by subtracting the natural abundance of 15N in holothurian tissues (0.376 atom%) from the measured 15N abundance.
Because this quantity is dependent on the initial amount of tracer added in the aquarium, we also calculated the integration percentage (i.e. the percentage of the initial quantity of 15N added to the experimental aquarium and effectively assimilated in the holothurian tissues).
Analyses of variance (ANOVAs) were performed on the growth data in order to compare mean weight, with significant differences determined by Tukey's HSD test (α: 0.05) (Statistica 7.0). To detect any effects of treatments over time, an analysis of covariance (ANCOVA) was realized with R 2.15.0. For isotope (15N values), non-parametric Mann–Whitney U-tests were performed (a: 0.05) (Statistica 7.0).
The control
The aquarium contained sediment, seawater and 32 individuals. Isotopic analyses were made on the individuals at T0, T1 and T3 to determine 15N levels in standard rearing conditions.
Treatments 1 and 2: assimilation of compounds from 15N-labelled bacteria of the genera Vibrio (closest strain in blast search: JQ665337.1) and Clostridium (closest strain in blast search JF836014.1)
These experiments investigated the potential of H. scabra to assimilate organic components from Vibrio and Clostridium. Vibrio is a genus commonly observed in seawater, marine sediments and in the digestive tube of H. scabra (Plotieau et al., Reference Plotieau, Lavitra, Gillan and Eeckhaut2013a). Clostridium is less common in marine environments and has not been recorded in the list of the 114 phylotypes identified in the digestive tube of H. scabra (Plotieau et al., Reference Plotieau, Lavitra, Gillan and Eeckhaut2013a). Bacteria were cultured in Petri dishes with LB medium (tryptone (10 g l−1), yeast extract (5 g l−1) and agar (15 g l−1), NaCl (30 g l−1), with MilliQ water containing 15N-alanine 98% (Eurisotop, France) (5 mg per Petri dish containing 9 ml of LB medium). Alanine is an important amino acid present in the bacterial wall (Schleifer & Kandler Reference Schleifer and Kandler1972). In order to check incorporation of 15N by cultured bacteria (Vibrio and Clostridium), three samples of each bacterial strain were rinsed three times with 0.22 µm filtered seawater and oven-dried at 60°C for 48 h before measurements with a mass spectrometer (see below).
Gram coloration was achieved in order to select one gram-negative (Vibrio) bacterium and one gram-positive (Clostridium) bacterium from the sample groups of pure cultures (Adamse, Reference Adamse1970). For each bacterial strain, the content of three Petri dishes (3 g w/w) was added once a week to the experimental tanks. Before these additions, living bacteria were rinsed three times with 0.22 µm filtered seawater in order to remove non-integrated 15N-alanine.
In order to identify the two strains of bacteria in the cultures and to check for any contamination that might occur during the 4 wk duration of the study, three samples of each bacterial culture were fixed in absolute ethanol (100%) at the beginning of the experiment and again after 1, 2 and 3 wk. Bacterial DNA from 5–10 mg of fixed samples was extracted using an Invisorb spin tissues minikit (Invitek) and a 550 bp-long 16S rRNA gene fragment was then amplified by touchdown-PCR using the protocol developed by Plotieau et al. (Reference Plotieau, Lavitra, Gillan and Eeckhaut2013a). Generated sequences were submitted to the BLAST database (http://www.ncbi.nlm.nih.gov/BLAST) in order to identify the closest species, found in each case to be Vibrio and Clostridium, respectively.
Treatments 3 and 4: assimilation of 15N-alanine in the presence or absence of antibiotics
These experiments investigated the ability of H. scabra to assimilate alanine dissolved in water and the role of bacteria in this assimilation. Accordingly, in treatment 3, 15N-alanine (12 mg) was added to the aquarium each week for 3 wk (concentration of 0.24 mg l−1). In treatment 4, 15N-alanine (12 mg) and antibiotics (4 g ampicillin and 1 g streptomycin according to Malmcrona-Friberg (Reference Malmcrona-Friberg, Tunlid, Mardén, Kjelleberg and Odham1986) and Mary et al. (Reference Mary, Mary, Rittschof and Nagabhushanam1993)) were added each week over the duration of the study in a separate experimental tank. The hypothesis tested was the following: if 15N-alanine was assimilated directly from seawater by H. scabra, their tissues would contain more 15N than juveniles in the control. Conversely, if bacteria took part in the assimilation of 15N from alanine, the concentration 15N in H. scabra's tissues reared with 15N-alanine + antibiotics would prove to be less abundant than the concentration in juveniles reared only with 15N-alanine.
Treatment 5: assimilation of organic compounds from autotrophic microorganisms
Ammonium is the preferred nitrogen source for most autotrophic bacteria and other microautotrophs (Von Wirén & Merrick, Reference Von Wirén and Merrick2004). 15N-ammonium sulphate 99% (Eurisotope, France) (300 mg) and antibiotics (4 g ampicillin and 1 g streptomycin) were added to the aquarium each week for the duration of the study. Antibiotics were added to enhance the development of labelled non-bacterial microorganisms. At the end of the experiment, if the 15N amount in H. scabra's tissues was found to be higher than in the control, this would suggest that H. scabra was able to assimilate organic compounds from autotrophic microorganisms.
RESULTS
At the end of the experiment, the percentage of dead individuals in the control was of 5%. The mortality rates after 4 wk varied significantly according to the treatment applied (Table 1). More than 85% of juveniles died when 15N-alanine labelled Clostridium were added. Clostridium-fed individuals did not grow during the study period: their weight only progressed from 36 to 40 mg in 4 wk. Diseased juveniles appeared 1 wk after Clostridium introduction, with juveniles presenting spots on their tegument. A few days following this, the juveniles died and their bodies completely deteriorated and liquefied. Juveniles that fed on 15N-alanine labelled Vibrio and on sediments with 15N-alanine + antibiotics had a mortality rate between 15.5 and 22%. The lowest mortality rates (less than 5%) were obtained when 15N-alanine or 15N-ammonium sulphate + antibiotics were introduced to the aquaria.
The individuals undergoing all treatments grew more than those in the control (Table 1), with recorded growth rates varying between 1.14 and 8.90 mg j−1. Juveniles in the control did not grow well, with a recorded growth rate of −0.76 mg j−1; as such, the average weight of control individuals at the end of the experiment that was not different than that recorded at the beginning. The average weight of juveniles undergoing the following four treatments differed from that of the control at the end of the treatment: juveniles reared with 15N-alanine labelled Vibrio, juveniles reared with 15N-alanine, those with 15N-alanine + antibiotics and those with (15NH4)2SO4 + antibiotics (ANOVA plus Tukey; P < 0.05) (Table 1). The highest growths were observed for juveniles reared with 15N-alanine (8.9 mg j−1) and those feeding on Vibrio (5.57 mg j−1); the lowest growths were recorded for individuals fed with Clostridium (0.19 mg j−1).
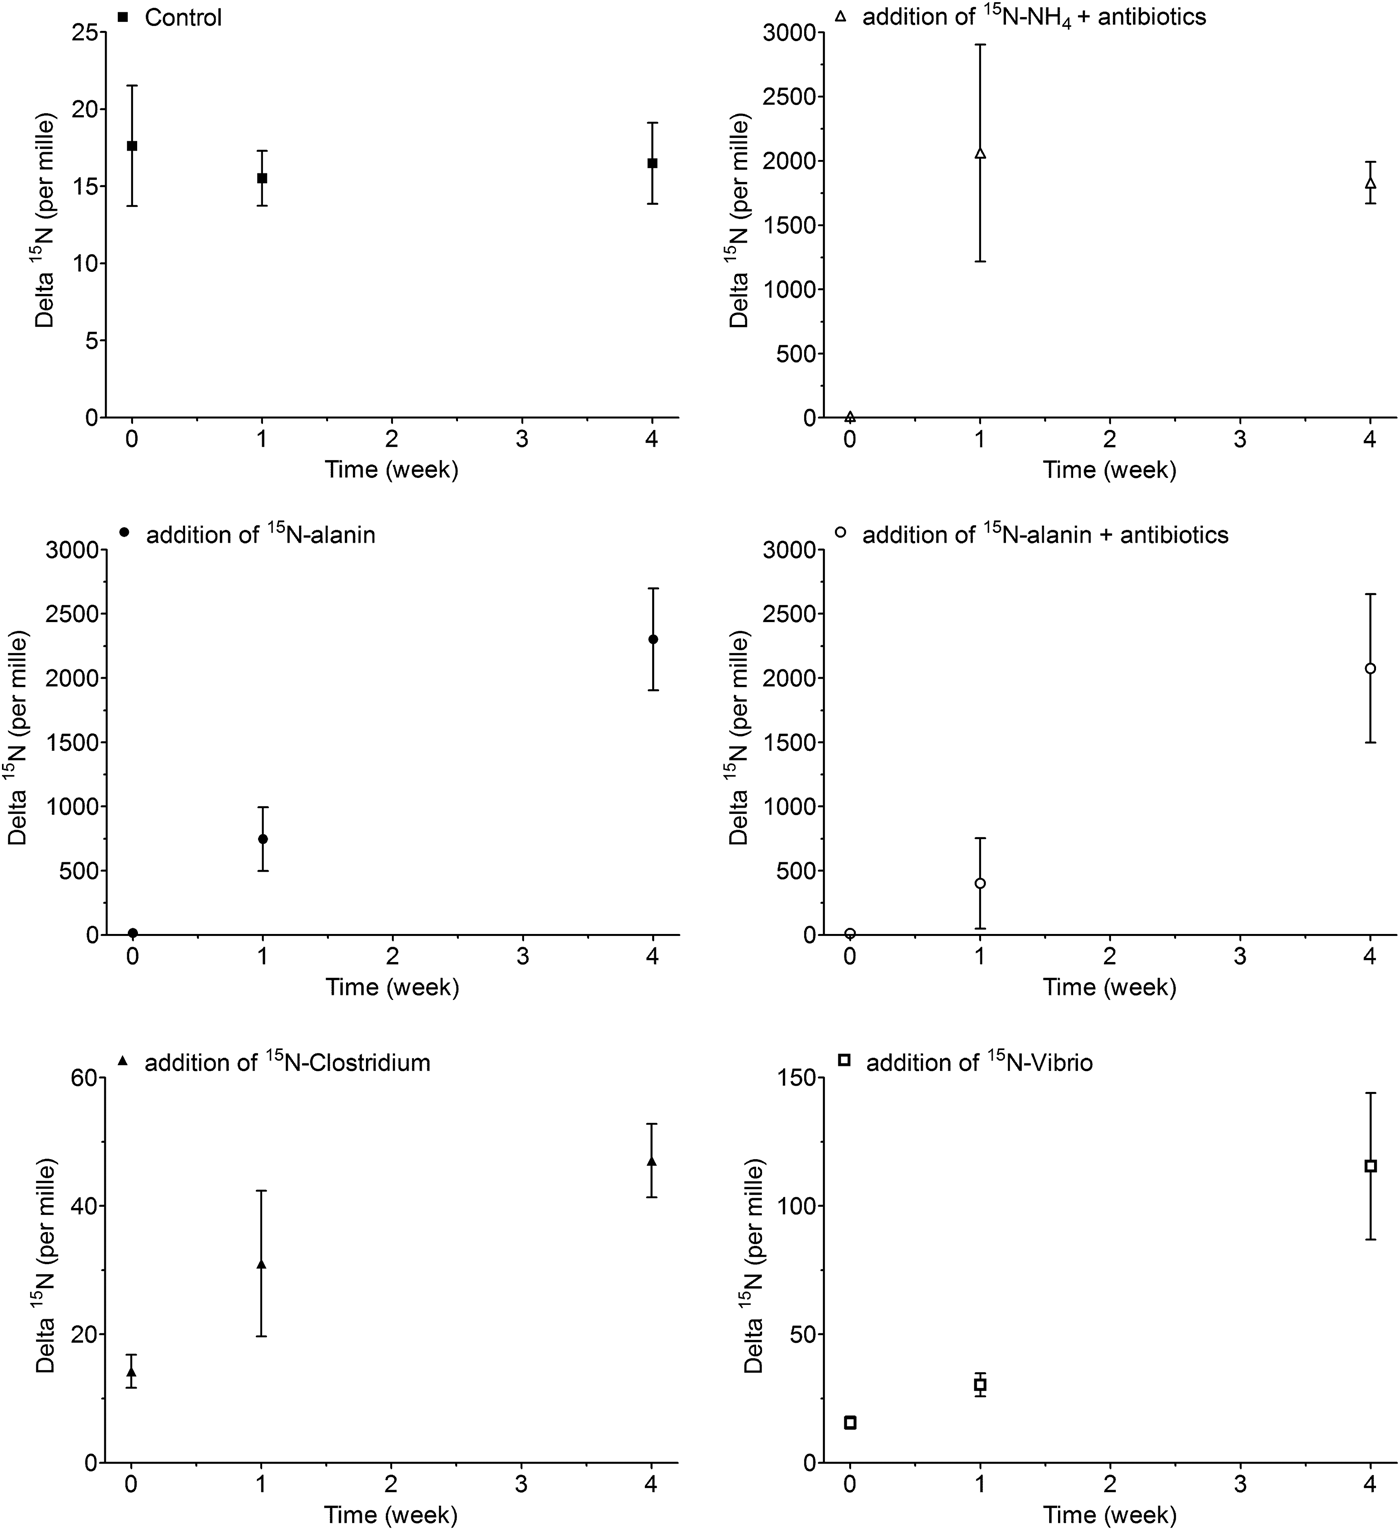
There was no difference in δ15N values over time for the control individuals. δ15N values at the end of the all treatments differed significantly from the control, showing a significant incorporation of 15N in all treatments (Mann–Whitney U-tests; P > 0.05). Assimilation seems particularly rapid in the ammonium sulphate treatment, as values of δ15N reached more than 2000‰ after 1 wk of experiment (Figure 1).
Mean δ15N values (±standard deviation) in ‰ measured in Holothuria scabra tissues reared in aquaria in presence of different 15N-tracer treatments.
Treatments conducted with Clostridium and Vibrio showed a similar pattern of evolution for δ15N, indicating that in both cases there was an assimilation of 15N from labelled bacteria into holothurian tissues: the δ15N of holothurian tissues passed from 14.2 to 47.0‰ in individuals fed with Clostridium and from 15.6 to 115.5‰ in individuals fed with Vibrio (Figure 1). Although the δ15N values in the tissues of individuals fed with Clostridium increased over time (indicating that they had eaten these bacteria and assimilated their components) the high mortality rate (88%; Table 1) and the low growth (0.19 mg j−1; Table 1) suggest that some of these components were toxic for the holothuroids. The values of δ15N of juveniles reared with 15N alanine labelled Vibrio (from ±15.62‰ to ±115.47‰) indicated that there was significant assimilation of Vibrio during the study duration (Figure 1). Moreover, growth (5.57 mg j−1; Table 1) was significantly higher than that of the control individuals and 29 times higher than that of individuals fed with Clostridium (P < 0.05).
Holothuria scabra's tissues showed a high 15N labelling when 15N-alanine was added, either alone or with antibiotics, to the aquaria (Figure 1), demonstrating that bacteria is part of H. scabra's source of alanine, with the rest being derived directly through uptake from seawater. Over the same period no significant difference (P > 0.05) in δ15N values was observed between juveniles reared with alanine alone and those reared with alanine and antibiotics (Figure 1). δ15N values in juveniles reared in presence of 15N-ammonium sulphate and antibiotics were significantly different than values for juveniles in the control (Figure 1).
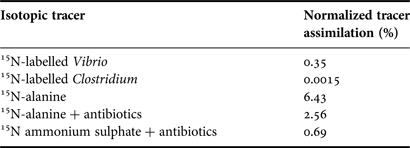
As we did not add the same quantity of labelled substances in each experimental tank, δ values are not directly indicative of the level of assimilation. For this reason we calculated a normalized tracer assimilation rate where each 15N assimilated quantity over the whole experiment time was normalized with the quantity of labelled tracer added during this time (Table 2). We found that only a small percentage of the tracer was incorporated in the holothurian tissues (between 0.0015 and 6.43). The percentage of assimilated tracer was, however, higher in the alanine treatment than in either the alanine + antibiotic treatment, the ammonium sulphate treatment, the 15N alanine labelled Vibrio treatment or the 15N alanine labelled Clostridium treatment (Table 2).
Proportion of 15N assimilated over time relative to initial 15N tracer added quantity according to the experimental treatment.
DISCUSSION
This study concerned 30 d old juveniles of Holothuria scabra (15 d of larval development and 15 d of postmetamorphic development). The use of these juveniles allowed the recording of assimilated tracers in entire individuals, and also created the opportunity to work with a high number of holothuroids (192 individuals) treated with labelled tracers in controlled conditions. The survival rate in the control individuals was similar (in fact slightly higher) to that of individuals reared by Madagascar Holothurie S.A.: the survival rates of juveniles fed over 8 wk by Madagascar Holothurie S.A. varied from 72.5 to 84% for the same population density used here (150 ind m−2) (Lavitra et al., Reference Lavitra, Rasolofonirina, Grosjean, Jangoux and Eeckhaut2009). Lavitra et al. (Reference Lavitra, Rasolofonirina, Grosjean, Jangoux and Eeckhaut2009) observed that the growth rate of freshly metamorphosed juveniles of H. scabra is very slow at the beginning of the post-metamorphic development phase, a result also observed in the course of this study, where the growth rates varied from −0.76 to 8.9 mg d−1.
The main finding of this study is that the food sources for H. scabra are varied and come from a combination of dissolved nutrients, heterotrophic bacteria and autotrophic microorganisms: all the components tested here were assimilated to some extent, although at different rates and with different effects on the growth of the holothuroids.
The four most abundant amino acids in the integument of Apostichopus japonicus are alanine, lysine, glutamic acid and aspartic acid (Gao et al., Reference Gao, Xu and Yang2011). The three first amino acids are also present in bacterial walls (Schleifer & Kandler, Reference Schleifer and Kandler1972). In the course of this study we observed that alanine could be rapidly taken up by H. scabra in its dissolved form (i.e. treatment with alanine + antibiotic). Free amino acids are an important constituent of dissolved organic matter, particularly in the seagrass sediments where H. scabra juveniles metamorphose. This could, therefore, represent an easily accessible food source for young holothuroids. Alanine incorporation may also be mediated by the microbial biomass (i.e. treatment with alanine alone), though more slowly. Bacterial consumption was also emphasized through the use of Vibrio and Clostridium bacteria, which were evidently assimilated by H. scabra. Nevertheless, Clostridium probably involved the uptake of harmful toxic substances into holothuroids, leading to a significant mortality rate. Previous studies have already demonstrated the role of bacteria in the diet of the holothuroids P. parvimensis (Yingst, Reference Yingst1976) and I. badionotus (Baird & Thistle, Reference Baird and Thistle1986). The present research team also recently demonstrated that bacterial concentration decreased significantly in substrates subject to holothurian farming (Plotieau et al., Reference Plotieau, Baele, Vaucher, Hasler, Kounad and Eeckhaut2013b). Vibrio are a very common bacteria found in marine sediment (Baross & Liston, Reference Baross and Liston1970; Ward-Rainey et al., Reference Ward-Rainey, Rainey and Stackebrandt1996) and in the sediment transiting through H. scabra's gut (Plotieau et al., Reference Plotieau, Lavitra, Gillan and Eeckhaut2013a). Clostridium is a genus less common than Vibrio in marine sediment (Yakimov et al., Reference Yakimov, Deanro, Genovese, Cappello, D'Auria, Chernikova, Timmis, Golyshin and Giluliano2005) and it was not observed in the 114 phylotypes revealed in H. scabra's gut (Plotieau et al., Reference Plotieau, Lavitra, Gillan and Eeckhaut2013a). Vibrio supplementation of the sediment had a positive effect on the growth of H. scabra. Nevertheless, the proportion of tracer assimilated during alanine treatment tended to be higher than that in Vibrio treatment. This could partly be explained by the results described in one of our recent studies (Plotieau et al., Reference Plotieau, Lavitra, Gillan and Eeckhaut2013a) regarding the bacterial composition of the sediment passed through the gut. We found that the sediment bacterial community entering the holothurian gut is very diverse and changes significantly from the foregut to the hindgut: many bacterial strains disappear, but Vibrio is the most represented genus in the gut sediment (although this is not the case in the sediments on which H. scabra feeds). This result suggests that Vibrio are bacteria well adapted to resist the digestion process of H. scabra.
Our treatment using ammonium sulphate also showed an incorporation of the isotopic tracer. There is actually no evidence that heterotroph marine animals take ammonium from the seawater as a nitrogen source. Conversely, ammonium is the preferred nitrogen source for most microautotrophs (Von Wirén & Merrick, Reference Von Wirén and Merrick2004) and, therefore, the 15N ammonium sulphate was first integrated into microautotrophs before their eventual incorporation into H. scabra's tissues. As antibiotics were used, most ammonium served the growth of microautotrophs other than bacteria, and (probably mostly for diatoms) as a major contributor in microphytobenthos. Incorporation of the tracer in this experiment showed lower tracer assimilation than during the treatments using alanine (both with and without antibiotics) or Vibrio. This suggests that dissolved organic matter and bacteria are very important food sources for H. scabra juveniles in comparison to microphytobenthos. Yingst (Reference Yingst1976) showed that Parastichopus parvimensis assimilates bacteria, diatoms of the genus Nitzschia and photoautotroph flagellates Dunaliella. She also observed that sea cucumbers do not assimilate organic compounds from the green algae Ulva or from the red algae Gelidium. The algae she used provided little direct nutritive value to the sea cucumbers, but did feed the bacteria attached to their surface. This is consistent with various studies indicating that plant material does not provide an important source of nutrients for many deposit feeders (Newell Reference Newell1965; Odum, Reference Odum1971; Fenchel, Reference Fenchel1972).
In conclusion, elements assimilated into the tissues of H. scabra juveniles come from a mixture of dissolved nutrients, heterotrophic bacteria and autotrophic microorganisms. Therefore, the diet of this holothuroid is more complex than generally assumed. These components found in the sediment are all assimilated to some extent but at different rates and with different effects on the growth of the holothuroids. As H. scabra is a commercial species of high value, supplementation of sediment in aquaculture by bacteria or microautotrophs such as diatoms should be considered and analysed further.
FINANCIAL SUPPORT
We wish to thank the FNRS (Fonds National pour la Recherche Scientifique), CUD (Commission Universitaire pour le Développement), AMPA (Agence Malgache de la Pêche et de l'Aquaculture) and the FAO (Food and Agriculture Organization) for financing assignments in Madagascar. T.P. benefited from a doctoral grant courtesy of the FRIA (Fonds pour la formation à la Recherche dans l'Industrie et l'Agriculture). This study is a collaborative project between the CIBIM (Centre Interuniversitaire de Biologie Marine) and the PRU (Polyaquaculture Research Unit).