Implications
This 4-year study is the first work investigating how grazing cattle modify their feeding station behavior seasonally and interannually in response to varying meteorological and sward conditions. Bite number per feeding station was affected positively by the sward height and dry matter digestibility of the pasture, and was affected negatively by the air temperature during stocking, as the major variable responsible for the seasonal and interannual variation. There is an opportunity for livestock and pasture managers to control feeding station behavior by animals through managements such as fertilizer application and manipulation of stocking intensity and stocking time within the day.
Introduction
Large herbivore foraging consists of a range of hierarchical processes occurring at different spatio–temporal scales from the bite to the home range or regional system (Senft et al., Reference Senft, Coughenour, Bailey, Rittenhouse, Sala and Swift1987; Bailey et al., Reference Bailey, Gross, Laca, Rittenhouse, Coughenour, Swift and Sims1996). The feeding station is the area of forage a grazing animal can reach without moving its forefeet (Goddard, Reference Goddard1968; Ruyle and Dwyer, Reference Ruyle and Dwyer1985). Grazing behavior can be divided into residence within feeding stations (with bites as benefits) and movement between feeding stations (with steps as costs). The animal is considered to move to a new feeding station at the cost of taking steps when intake rate from the current feeding station falls below the threshold level under repeated bites (Searle et al., Reference Searle, Hobbs and Shipley2005; Gregorini et al., Reference Gregorini, Clark, McLeod, Glassey, Romera and Jago2011). Bite number, residence time and intake per feeding station, feeding station number per unit foraging time and step number between feeding stations are major feeding station behavior variables, which reflect profitability or unprofitability of feeding stations (Ruyle and Dwyer, Reference Ruyle and Dwyer1985; El Aich et al., Reference El Aich, Moukadem and Rittenhouse1989; Roguet et al., Reference Roguet, Prache and Petit1998b; Gregorini et al., Reference Gregorini, Gunter, Masino and Beck2007, Reference Gregorini, Gunter, Beck, Caldwell, Bowman and Coblentz2009 and Reference Gregorini, Clark, McLeod, Glassey, Romera and Jago2011; Hirata et al., Reference Hirata, Sakou, Terayama, Furuya and Nanba2008; Shingu et al., Reference Shingu, Kondo and Hata2010). The cost–benefit concept of the feeding station behavior is useful for a better understanding of foraging behavior of animals (Roguet et al., Reference Roguet, Prache and Petit1998b) and adjusting management strategies of various grazing systems ranging from an intensively managed small paddock of a sown pasture to an extensive rangeland across a landscape (e.g. Ruyle and Dwyer, Reference Ruyle and Dwyer1985).
The feeding station behavior of animals varies at different scales of time such as hour, day and season (e.g. Ruyle and Dwyer, Reference Ruyle and Dwyer1985; El Aich et al., Reference El Aich, Moukadem and Rittenhouse1989; Gregorini et al., Reference Gregorini, Clark, McLeod, Glassey, Romera and Jago2011). However, previous studies have focused mainly on relatively short-term (<1 day to about 30 days) variations in feeding station behavior in order to investigate the effects of forage availability (Ruyle and Dwyer, Reference Ruyle and Dwyer1985; Roguet et al., Reference Roguet, Prache and Petit1998b), sward structure (Gregorini et al., Reference Gregorini, Gunter, Beck, Caldwell, Bowman and Coblentz2009), plant species (Hirata et al., Reference Hirata, Sakou, Terayama, Furuya and Nanba2008), grazing management (Gregorini et al., Reference Gregorini, Clark, McLeod, Glassey, Romera and Jago2011), animal species (Shingu et al., Reference Shingu, Kondo and Hata2010) and rumen fill (Gregorini et al., Reference Gregorini, Gunter, Masino and Beck2007). Relatively little information has been reported on how grazing animals modify feeding station behavior seasonally and interannually in response to varying environmental conditions (El Aich et al., Reference El Aich, Moukadem and Rittenhouse1989; Jiang and Hudson, Reference Jiang and Hudson1993). Meteorology and vegetation are the major environmental components surrounding animals. Meteorological conditions are assumed to affect feeding station behavior of animals both directly (e.g. heat stress) and indirectly via sward conditions (e.g. rainfall-induced changes in forage availability), whereas sward conditions influence feeding station behavior directly.
The objective of this study was to examine the effects of sward and meteorological conditions on the feeding station behavior of beef cows stocked on a tropical grass pasture. It was hypothesized that (1) cows would adjust their feeding station behavior seasonally and interannually according to varying meteorological and sward conditions, and (2) the susceptibility to meteorological and sward conditions would provide livestock and pasture managers with an opportunity to control feeding station behavior through managements.
Material and methods
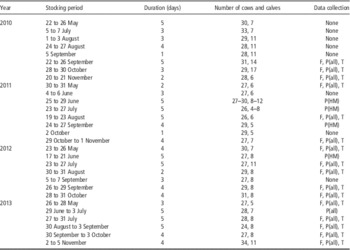
The study was conducted from late September 2010 to early November 2013 at the Sumiyoshi Livestock Science Station (31°59′N, 131°28′E), Faculty of Agriculture, University of Miyazaki, southern Kyushu, Japan (Table 1). The procedures used in the study were approved by the Animal Care and Use Committee of the university (#2009–006–2, 2009–006–3, 2012–001 and 2012–001–2).
Stocking conditions in the experimental pasture and times of data collection

F=feeding station behavior of cows; P(all)=sward height, herbage mass and nutritive value of pasture; P(HM)=herbage mass of pasture; T=air temperature.
Measurements of F were carried out on the initial day of the stocking period, and those of P(all) and P(HM) were performed on the previous day. Data for T were obtained from Japan Meteorological Agency (2014) for the days of F measurements. Data collections between May and early September 2010 were not carried out because of the outbreak of foot-and-mouth disease in Miyazaki Prefecture.
Pasture and animals
The experimental pasture (1.1 ha) was one of the five pastures rotationally stocked by a herd of Japanese Black cows and calves during the stocking season from May to October or November each year. The pasture was fully covered by herbaceous vegetation dominated by bahiagrass (Paspalum notatum Flügge), with a low cover of Japanese lawngrass (Zoysia japonica Steud.) and centipedegrass (Eremochloa ophiuroides (Munro) Hack.). During the stocking season, the pasture was stocked six to eight times by a group of 24 to 34 cows and 4 to 17 calves for 1 to 5 days (0900 to 1600 h each day) at intervals of 17 to 34 days (Table 1). The total duration of stocking was 26 to 29 days annually. Mean BW of cows ranged from 444 (s.e. 8.4) to 487 (s.e. 10.6) kg. The pasture was fertilized with compound fertilizer and urea at annual rates of 81 kg N (40 kg in April or May and 41 kg in August), 15 kg P (April or May) and 23 kg K (April or May) per ha.
Feeding station behavior measurements
Feeding station behavior measurements were carried out on the initial day of the rotational stocking periods in late September, October and November 2010, in May, August and October to November 2011, in May, July, August, late September and October 2012 and in May, July, August to September, September to October and November 2013 (three, three, five and five times between 2010 and 2013, respectively; Table 1). On each occasion, 14 to 31 cows (77±6% (mean±s.e.) of the cows in the herd) were randomly selected as focal animals, and their feeding station behavior was measured during the 7-h stocking period (0900 to 1600 h). The measurements in 2010 commenced in late September and did not cover the stocking season (Table 1), because the outbreak of foot-and-mouth disease in Miyazaki Prefecture limited the entry to the station from late April to early September. Throughout the 4-year study, focal animals were observed from a distance of 3 to 5 m to minimize the effect of the presence of the observer (Hirata et al., Reference Hirata, Nakayama and Tobisa2010b). The observers had been trained before the measurements were carried out.
In 2010, 2011 and 2012, the focal animals were divided into three groups of the same or almost the same numbers, and the groups were observed rotationally by three observers having a stopwatch and a counter. Each observer moved from one group to another in a predetermined order, and recorded the feeding station behavior of animals in the allotted group for 30 (2010 to 2011) or 15 (2012) min before moving to the next one. For each animal, measurements commenced when the animal reached a feeding station and ended when it took at least 60 bites after uninterrupted alterations of residence within feeding stations and movement between feeding stations. The number of feeding stations visited (N FS) and the number of bites taken (N bite) were recorded along with the time (sec) from the start to the end of the measurements (T obs). No measurements were made when the focal animal was not engaged in grazing activity (e.g. resting and ruminating).
In 2013, the focal animals were video recorded (HDR-CX180; Sony, Tokyo, Japan) by four to eight observers in a predetermined random order while they visited at least 80 sequential feeding stations. Video records were analyzed using a computer with timing software (precision, 0.033 s; VideoStudio 8; Corel, Ottawa, Ontario, Canada) to determine the number of feeding stations (N FS), bites (N bite) and steps (N step), and divide the recording time (T obs) into residence time within feeding stations (T residence) and moving time between feeding stations (T move).
The number of feeding stations selected per unit foraging time, number of bites per feeding station and bite rate were calculated as N FS/T obs, N bite/N FS and N bite/T obs, respectively, for the 4 years. For 2013, the number of steps and step rate between feeding stations were also computed as N step/N FS and N step/T move, respectively. Bite rate quantified in this study may also be termed ‘bite rate across feeding stations’ (Hirata et al., Reference Hirata, Sakou, Terayama, Furuya and Nanba2008), because the rate is based on foraging time, including moving time between feeding stations as well as residence time within feeding stations and is discriminated from ‘bite rate within feeding stations’ defined as N bite/T residence. However, this paper uses the term ‘bite rate’ for simplicity.
Pasture measurements
Pasture measurements were carried out on the previous day of feeding station behavior measurements (Table 1). On each occasion, pre-grazing sward height was measured using a ruler, and compressed height was recorded using a rising plate (Filips Folding Pasture Meter; Jenquip, Feilding, New Zealand) at 1-m intervals along two 90-m permanent line transects laid parallel to each other on the pasture (2×91 locations). Pre-grazing herbage mass and nutritive value (dry matter digestibility (DMD) and nitrogen (N) concentration) of herbage at the 182 locations on the transects were estimated using calibration equations modified from Hirata (Reference Hirata2000). The modified equations used compressed height as an independent variable and nutritive value as well as herbage mass as dependent variables. Pasture samples for developing calibration equations were taken from six to nine 0.5×0.5 m locations, whose compressed heights covered the compressed height range on the transects. Herbage from 3 cm above the ground surface (the part accessible to the animals) was sampled using scissors. The samples were oven-dried at 85°C for 72 h for dry matter (DM) determination, and were further analyzed for herbage nutritive value after being ground to pass a 1-mm screen. DMD was estimated with the pepsin–cellulase technique and corrected by a calibration equation to give predicted in vivo DMD (Goto and Minson, Reference Goto and Minson1977). N concentration was determined using an N/C analyzer (Sumigraph NC-220 F; Sumika Chemical Analysis Service, Tokyo, Japan).
Pasture measurements were also carried out before (1 day before) the rotational stocking periods in late June, July and September 2011, in June 2012 and from June to July 2013 (Table 1). The first four measurements estimated only herbage mass, whereas the last quantified all sward characteristics (sward height, herbage mass, DMD and N concentration).
Meteorological data
Meteorological data were obtained from the observation records at the Miyazaki Meteorological Office (31°56′N, 131°25′E; about 7 km from the study site) (Japan Meteorological Agency, 2014). Mean air temperature during the daily stocking period for feeding station behavior measurements was calculated as an average of hourly data from 0900 to 1600 h.
Statistical analysis
ANOVA was performed to evaluate seasonal variations in feeding station behavior and sward conditions within individual years, and the means were separated based on Tukey’s honest significant difference (P<0.05). Interannual variations were not statistically evaluated because of the unbalanced structure of data (different numbers and timings of measurements among the 4 years; Table 1). Correlation analysis was used to evaluate the relationships between feeding station behavior variables, between sward variables and between feeding station variables and environmental (sward and meteorological) variables. Correlation coefficients (r) were deemed statistically significant at P<0.05. Multiple regression analysis was used to evaluate the effect of sward and meteorological conditions on the feeding station behavior of animals. Explanatory variables (independent variables) were selected from herbage mass, sward height, DMD, N concentration and mean air temperature during stocking using a forward selection method (F IN level at P<0.05). No interactions between the variables were considered. Multiple regression equations with model-to-error F-ratios at P<0.05 were judged statistically significant. All statistical analyses were performed using STATISTICA (version 10; StatSoft, Tulsa, OK, USA).
Results
Meteorological conditions
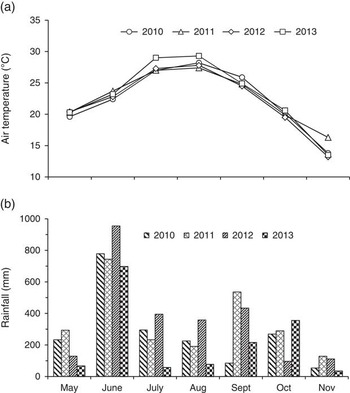
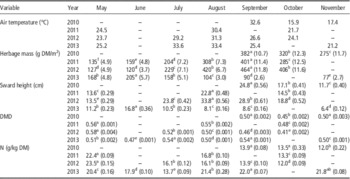
A severe summer drought occurred in 2013 (Figure 1). Mean monthly air temperature in July and August 2013 (29.0°C and 29.3°C, respectively) was 1.1°C to 2.0°C higher than that recorded between 2010 and 2012 (27.0°C to 28.2°C). Monthly rainfall in July and August 2013 (58 and 77 mm, respectively) was 15% to 40% of the 2010 to 2012 values (191 to 395 mm). A drought also occurred in May 2013, receiving 23% to 52% of rainfall recorded for that month in 2010 to 2012 (67 mm v. 129 to 294 mm).
(a) Mean monthly air temperature and (b) monthly rainfall during the stocking season in the study years.

Variation in feeding station behavior
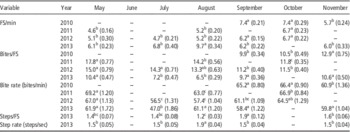
Feeding station behavior of cows showed similar seasonal patterns between 2011 and 2012; however, the pattern in 2013 differed from the preceding patterns (Table 2). Feeding station number per minute increased in August (P<0.05) and decreased in September (P<0.05) in 2013, whereas it stabilized from May to August and increased in September or October (P<0.05) in 2011 and 2012. The value recorded in August 2013 (9.7 feeding stations/min) was markedly high compared with those recorded on the other occasions. Bite number per feeding station was lowest between July and August (P<0.05) in 2013, whereas it decreased with the progress of the stocking season (P<0.05) in 2011 and 2012. The values attained in July and August 2013 (7.2 and 6.5 bites/feeding station) were lower than those obtained on the other occasions. Bite rate decreased in July (P<0.05) and increased in August (P<0.05) in 2013, whereas it decreased in July or August (P<0.05) and increased in October (P<0.05) in 2011 and 2012. The value attained in July 2013 (47.0 bites/min) was lower than those recorded on the other occasions. The limited coverage of the 2010 data (only September to November) was not enough to judge the similarity or dissimilarity of this year’s pattern to those in the other years.
Seasonal and interannual variations in feeding station (FS) behavior of cows (feeding stations selected per minute, bites per feeding station, bite rate, steps between feeding stations and step rate)

See Table 1 for the dates of data collection and text for the calculation of the variables.
Values are means (s.e.) over 14 to 31 cows. Means followed by different letters within the same variable and the same year differ (P<0.05).
Step number between feeding stations and step rate in 2013 peaked in September and August, respectively (P<0.05; Table 2). Almost all movements (89%, s.e. 1.1) were single-step moves, with the percentages of two-step to seven-step moves being as low as 3% (s.e. 0.6), 2% (0.4), 1% (0.3), 1% (0.3), 1% (0.2) and 1% (0.2), respectively.
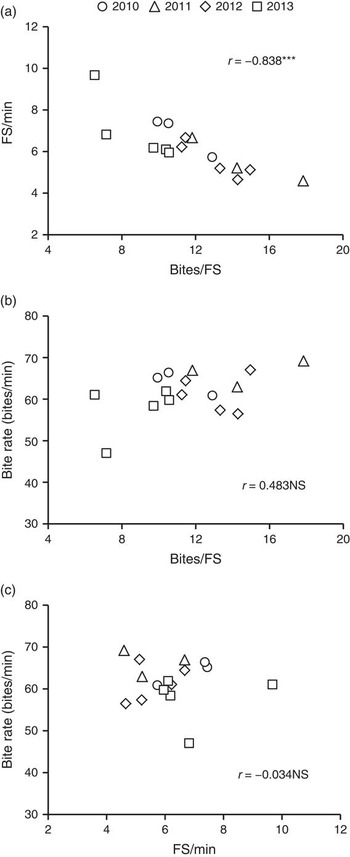
Feeding station number per minute was negatively correlated with bite number per feeding station (r=−0.838, P<0.001; Figure 2a). No significant correlation was detected between bite rate and bite number per feeding station (Figure 2b) or between bite rate and feeding station number per minute (Figure 2c).
Relationships between feeding station (FS) behavior variables in cows. (a) feeding stations selected per minute v. bites per feeding station, (b) bite rate v. bites per feeding station and (c) bite rate v. feeding stations per minute. ***P<0.001; NS, P⩾0.05.

Variation in meteorological and sward conditions
Mean air temperature during stocking was higher from July to September than in May and from October to November (Table 3). Cows were subjected to hot weather (>30°C) during the stocking in July 2013, August 2011 to 2013 and September 2010. No rainfall occurred during the daily stocking periods when the feeding station behavior measurements were carried out.
Seasonal and interannual variations in mean air temperature during stocking and sward characteristics of pasture (herbage mass, sward height, dry matter digestibility (DMD) and nitrogen (N) concentration)

See Table 1 for the dates of data collection.
Values are means (s.e.) over 192 locations in the pasture except for air temperature. Means followed by different letters within the same variable and the same year differ (P<0.05).
Herbage mass, sward height, DMD and N concentration of herbage exhibited similar seasonal patterns for 2010, 2011 and 2012, although data in 2010 covered only the late stocking season (Table 3). Herbage mass and sward height increased from May to August or September (P<0.05) and decreased thereafter (P<0.05). Herbage DMD and N concentration decreased with the progress of the stocking season (P<0.05). A stark contrast to these patterns was observed in 2013. Herbage mass and sward height increased from May to June (P<0.05) and decreased thereafter (P<0.05). DMD and N concentration were lowest in June or July (P<0.05). As a result, herbage mass from August to November 2013 (77 to 104 g DM/m2) and sward height from July to November 2013 (6.4 to 10.5 cm) were lower, and N concentration from August to November 2013 (21.4 to 22.0 g/kg DM) was higher compared with the values recorded during the same periods between 2010 and 2012.
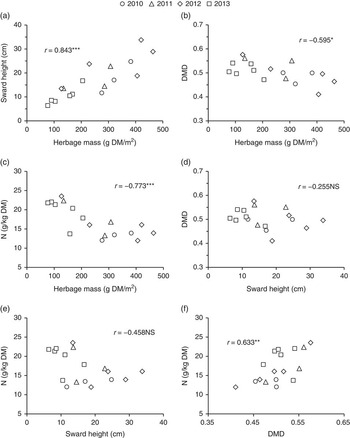
There was a positive correlation between sward height and herbage mass (r=0.843, P<0.001; Figure 3a). Herbage nutritive value was negatively correlated with herbage mass (r=–0.595, P<0.05 for DMD; r=–0.773, P<0.001 for N; Figure 3b and c), but not with sward height (Figure 3d and e). There was a positive correlation between DMD and N concentration of herbage (r=0.633, P<0.01; Figure 3f).
Relationships between sward characteristics of pasture. (a) Sward height v. herbage mass, (b) dry matter digestibility (DMD) v. herbage mass, (c) nitrogen (N) concentration v. herbage mass, (d) DMD v. sward height, (e) N concentration v. sward height and (f) N concentration v. DMD. ***P<0.001; **P<0.01; *P<0.05; NS, P⩾0.05.

Relationship between feeding station behavior and environmental conditions
None of the feeding station behavior variables were significantly correlated with a single sward characteristic or the mean air temperature during stocking (P⩾0.05). However, two feeding station behavior variables were significantly regressed against the combination of sward and meteorological variables. Feeding station number per minute (N FS/min) was explained by an equation with sward height (H, cm), DMD (D) and mean air temperature during stocking (T,°C) as predictors:
 $$N_{{{\rm FS/min}}} =16.1-0.107H-23.1D{\plus}0.139T\quad \quad \left( {R^{2} =0.642,\;P\lt 0.01} \right)$$
Partial regression coefficients detected negative effects of H (P<0.01) and D (P<0.01) and a positive effect of T (P<0.05) on N FS/min. Bite number per feeding station (N bite/FS) was also explained by H, D and T:
 $$N_{{{\rm bite/FS}}} =-7.39{\plus}0.259H{\plus}47.7D-0.362T\quad \;\left( {R^{2} =0.658,\;P\lt 0.01} \right)$$
Partial regression coefficients showed positive effects of H (P<0.01) and D (P<0.01) and a negative effect of T (P<0.01) on N bite/FS.
Discussion
Cows varied their feeding station behavior seasonally and interannually during the 4 years (Table 2). Based on this aspect, the following discussion focuses on two issues relating to the hypotheses examined.
Mechanisms behind the variation in feeding station behavior
Bite number per feeding station was positively affected by sward height and DMD of the pasture (equation (2)). This is in line with the generally accepted rule that grazing herbivores tend to utilize feeding stations in such a way as to remove more digestible forage (i.e. green leaves and top horizons) before moving on (Searle et al., Reference Searle, Hobbs and Shipley2005). Taller feeding stations allow animals to take more bites before the bite mass and intake rate fall below the threshold level for feeding station departure, that is, tall feeding stations are depleted later than short feeding stations (Roguet et al., Reference Roguet, Dumont and Prache1998a; Hirata et al., Reference Hirata, Kunieda and Tobisa2010a). The negative effect of air temperature on bite number per feeding station (equation (2)) is taken to indicate that cows were not able to concentrate on feeding within feeding stations under hot weather because of diminished motivation to graze (Vallentine, Reference Vallentine1990). The results of the present study highlight the importance of sward and meteorological conditions as factors contributing to the seasonal and interannual variations in feeding station departure averaged over a pasture, although different factors (e.g. animal interactions as a social factor, neck angle as a biokinetic factor) may explain departure from individual feeding stations within a pasture on a shorter-term basis (Roguet et al., Reference Roguet, Dumont and Prache1998a; Searle et al., Reference Searle, Hobbs and Shipley2005).
Seasonal and interannual variations in feeding station behavior were observed not only in bite number per feeding station but also in feeding station number per minute and bite rate (Table 2). It is interpreted that cows modified bite number per feeding station in response to the sward and meteorological conditions (equation (2)), and this caused the variation in feeding station number per minute. Comparing the data of 2013 (Table 2), step number between feeding stations varied in a narrower range (1.2 to 1.9 steps) than bite number per feeding station (6.5 to 10.6 bites). Both bite rate within feeding stations and step rate between feeding stations were relatively constant across feeding stations with values of ~1.1 bites/sec and 1.6 steps/sec, respectively. Because of these, the number of feeding stations the cows visited per unit foraging time was determined largely by the number of bites they took from individual feeding stations. These two variables were negatively related (Figure 2a) and received opposite effects of the three predictors (equations (1) and (2)). The present results agree with previous observations in that step is generally a minor component of feeding station behavior compared with bite in terms of the number (Murray, Reference Murray1991; Lazo and Soriguer, Reference Lazo and Soriguer1993; Hirata et al., Reference Hirata, Sakou, Terayama, Furuya and Nanba2008), with the majority of feeding station-to-feeding station movements as single-step moves (Roguet et al., Reference Roguet, Prache and Petit1998b; Ogura et al., Reference Ogura, Sekino and Hirata2004; Shingu et al., Reference Shingu, Kondo and Hata2010). The bite/step ratio in animals is likely to decrease as vegetation becomes scarce and discretely distributed (Murray, Reference Murray1991). It is further interpreted that the variation in bite rate resulted from the variations in bite number per feeding station and feeding station number per minute, as bite rate is a product of the two variables.
Implications to management
From the cost–benefit view of the feeding station behavior, animals maximize the net profit when they achieve the highest bite/step ratio (Roguet et al., Reference Roguet, Dumont and Prache1998a). Considering the minor contribution of step number as discussed above, the bite/step ratio depends largely on the bite number per feeding station. The present study shows that the bite number per feeding station, that is, profitability of a feeding station, can be increased by increasing sward height or increasing herbage DMD or both (equation (2)). Tall swards favor daily intake of animals through a minimal availability constraint, whereas digestible swards favor daily intake through a minimal digestive constraint (Fryxell, Reference Fryxell1991; Hirata et al., Reference Hirata, Murakami, Ikeda, Oka and Tobisa2012). Bite number per feeding station may, thus, be used as an indicator of daily intake of grazing animals.
Decreasing frequency and/or intensity of stocking is a management option adopted commonly to increase sward height of a pasture. However, an increase in sward height by means of this management may result in a decrease in herbage digestibility (Hirata, Reference Hirata1993; Dumont et al., Reference Dumont, Garel, Ginane, Decuq, Farruggia, Pradel, Rigolot and Petit2007; Da Silva et al., Reference Da Silva, Gimenes, Sarmento, Sbrissia, Oliveira, Hernadez-Garay and Pires2013), because infrequent or lenient defoliation allows the sward to accumulate low-quality materials (e.g. aged leaves, stems and dead material; Hirata and Ueno, Reference Hirata and Ueno1993; Hirata et al., Reference Hirata, Kunieda and Tobisa2010a). This does not contradict the non-significant relationship between DMD and sward height in the present study (Figure 3d), where sward height was not varied by defoliation treatments (frequency and/or intensity of stocking).
Alternatively, N fertilizer has been reported to be effective for increasing sward height and DMD simultaneously in a grass pasture (Boval et al., Reference Boval, Cruz, Ledet, Coppry and Archimede2002; Hirata et al., Reference Hirata, Ogawa, Koyama, Shindo, Sugimoto, Higashiyama, Ogura and Fukuyama2006), through the positive effect on the mass and length of leaves (Boval et al., Reference Boval, Cruz, Ledet, Coppry and Archimede2002; Hirata, Reference Hirata2004). However, application of N cannot be justified only on the basis of the feeding station behavior and daily herbage intake of animals. Future research is needed to investigate how modification of the feeding station behavior influences not only feed intake but also energy expenditure and performance of animals.
The current study also shows an adverse effect of air temperature on bite number per feeding station (equation (2)). Stocking animals at night instead of during the day may, therefore, be another management option to increase bite number per feeding station, especially during the hot summer months (Table 3). This management is expected to increase feed intake of animals as well as the bite number per feeding station when the mean air temperature during the day exceeds 25°C (National Research Council, 1987).
Conclusion
Beef cows stocked on a tropical grass pasture modified their feeding station behavior seasonally and interannually. Bite number per feeding station was affected positively by the sward height and DMD of the pasture, and was affected negatively by the air temperature during stocking, as the major variable responsible for the seasonal and interannual variation. There is an opportunity for livestock and pasture managers to control feeding station behavior by animals through managements such as fertilizer application and manipulation of stocking intensity and stocking time within the day. The results support the two hypotheses tested.
Acknowledgments
The authors thank Ikuko Taketomi, Shotaro Kubo, Nozomi Takeno, Eri Imagawa, Koki Okamura, Minamo Hamada, Ai Matsubara, Karin Yamada, Keishi Tanaka, Moeko Uchimura, Takayoshi Saito, Yui Shiraishi, Chihiro Tomita, Shiho Nakano and Sakura Yuda for field assistance, Kiichi Fukuyama for pasture management and Koichiro Henmi for animal management.