Introduction
• What constitutes unequivocal proof that life on our planet is inextricably linked to the wider cosmos?
• What constitutes proof that ‘alien’ life similar to ours exists at our very doorstep in the Solar System and beyond?
• What constitutes proof that life on Earth was seeded by comets, and that the seeding process still continues?
None of these questions are particularly easy to answer, but the weight of scientific evidence accumulated in the past three decades has moved strongly in favour of life's external origins. Of particular relevance are the recent discoveries of extrasolar planets in the galaxy, the vast preponderance of complex organic molecules in the Universe and the nature of bacteria able to survive extreme space conditions (Marcy & Butler Reference Marcy and Butler1996; Franck et al. Reference Franck2000; Butler et al. Reference Butler2006; Cockell Reference Cockell and Benton2008).
The proposition that life is a cosmic phenomenon is often referred to as an ‘extraordinary hypothesis’, and it is contended that extraordinary hypotheses need extraordinary evidence to defend them. However, the cosmic nature of life is by no means ‘extraordinary’: it is extraordinary only in the context of Earth-centred cosmologies that should have become obsolete after Copernicus, Galileo and Kepler some 500 years ago. The extension of a Copernican-style revolution to embrace life and biology is surely overdue. The proposition that now seems extraordinary is one that seeks to confine life and its entire evolution to a single planetary body, such as Earth.
Over geological timescales our planet, and indeed the entire Solar System, cannot be regarded as a closed system disconnected from the external universe. Material from our Solar System, including life-carrying dust and debris from Earth, is inevitably distributed on a galaxy-wide scale. The transfers take place due to gravitational perturbations of the Oort cloud of comets as the Solar System periodically encounters molecular clouds during its 240 My orbit around the centre of the galaxy (Napier Reference Napier2004; Wallis & Wickramasinghe Reference Wallis and Wickramasinghe2004; Wickramasinghe et al. Reference Wickramasinghe, Wickramasinghe and Napier2009a,Reference Wickramasinghe, Wickramasinghe and Wallisb). In this class of model comets collide with life-laden planets and some fraction of ejected fertile dust can transfer life to nearby embryonic planetary systems. Over the lifetime of the Solar System a large fraction of the mass of comets containing bacteria was also lost to the Solar System to populate dust clouds of interstellar space (Hoyle & Wickramasinghe Reference Hoyle and Wickramasinghe2000).
Terrestrial origins of life versus panspermia
Although the concept of panspermia has ancient roots dating back to classical Greece (Aristarchus, ca. fifth century BC) its modern revival in the context of 20th century science was largely due to work of Arrhenius (Reference Arrhenius1908) and of Hoyle, the present author and many collaborators (Hoyle & Wickramasinghe Reference Hoyle, Wickramasinghe and Ponnamperuma1981, Reference Hoyle and Wickramasinghe2000; Wainwright et al. Reference Wainwright, Wickramasinghe, Narlikar and Rajaratnam2003; Wickramasinghe et al. 2009a). The conventional view is that life originated on Earth in a ‘warm little pond’. This so-called ‘standard’ model proposed by Haldane (Reference Haldane1929) and Oparin (Reference Oparin1953) involved as a first step the production of organic molecules from a mixture of inorganic gases in Earth's primitive atmosphere. For such a process to work the atmosphere had to be reducing in character. Inorganic gases in the atmosphere (water, methane, ammonia, carbon dioxide) were thought to have been dissociated into radicals by the action of lightening and solar ultraviolet (UV) light. In the cascade of recombinations that followed, a trickle of organics were produced and these rained down into the primitive oceans to form a dilute organic soup. It is from such a primordial soup that an undefined prebiotic chemistry is thought to have developed, leading eventually to an origin of the first self-replicating cell.
This Earth-centred scheme acquired a degree of credibility when Miller & Urey (Reference Miller and Urey1959) showed that a prebiotic chemistry leading to organics could actually be demonstrated in the laboratory. It was shown that a reducing atmosphere acted on by solar UV and electrical discharges does indeed produce the organic molecules required for the Haldene–Oparin theory. Although this was still a far cry from showing how life formed, it seemed at the time to be a step in the right direction. Once the monomers, such as the amino acids, were synthesized, the next crucial step was their assembly into biopolymers, such as enzymes. Whatever model one chooses the odds against the correct arrangements for the macromolecules of life evolving in any one setting have to be reckoned as being superastronomical, or at least astronomical in measure (Crick & Orgel Reference Crick and Orgel1973; Hoyle & Wickramasinghe Reference Hoyle and Wickramasinghe1982). It is this inherent difficulty of bridging a vast improbability gap that justifies turning to the wider cosmos for clues.
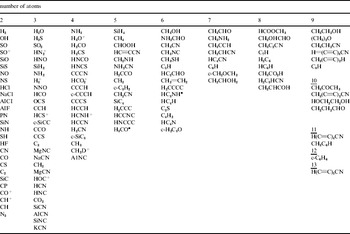
The most striking clue that became apparent from the 1970s onwards was the discovery of organic molecules in interstellar clouds. The most decisive identifications of interstellar molecules have come from observations in the radio, microwave and millimetre wavebands, shown in Table 1.
Table of interstellar molecules (adapted from Thaddeus Reference Thaddeus2006)

The present tally of molecules thus found exceeds 140 (Thaddeus Reference Thaddeus2006; Herbst & van Dishoeck Reference Herbst and van Dishoeck2009) and this number has been increasing at the rate of 3–5 per year over the past few years. The list is likely to represent the tip of an iceberg: actual detections are inevitably constrained by the availability of predicted transitions that have then to be searched for and discovered in interstellar clouds. Many biologically relevant molecules are seen in Table 1, including formaldehyde, hydrogen cyanide and glycolaldehyde.
Although the current trend is to interpret Table 1 as evidence of the widespread occurrence of prebiotic chemistry in the interstellar medium, fundamental uncertainties remain that permit an alternative explanation for at least some of these molecules. If biology is widespread throughout the galaxy the interstellar medium must surely include a component that represents the detritus of biology. The interstellar dust particles that we shall discuss in the following two sections could be largely derived from biology.
Unlikely beginnings
From the perspective of astronomy Hoyle and the present author first began to re-examine the nature of cosmic dust, which had remained a mystery for over four decades (Wickramasinghe Reference Wickramasinghe1967). These dust particles make up about 1% of the mass of the entire galaxy and exist in the form of gigantic clouds from which new stars are continuously formed. The effect of interstellar dust on starlight is to cause extinction (dimming), polarization and scattering over a wide range of wavelengths. When we began to investigate the nature of cosmic dust it was widely held that these dust particles were similar to the ice crystals that existed in the cumulous clouds of Earth's atmosphere – the ice grain theory advocated primarily by Dutch astronomers (van de Hulst Reference van de Hulst1949). We showed convincingly in 1962 that interstellar dust was comprised largely of the element carbon – leading to the carbon grain theory (Hoyle & Wickramasinghe Reference Hoyle and Wickramasinghe1962; Wickramasinghe Reference Wickramasinghe1967).
Organic polymers and bacterial dust
As evidence accumulated in support of the carbon-dust theory, the list of organic molecules found in space began to expand as well – the list now including some molecules that may have been precursors of amino acids and other biochemicals (Hoyle & Wickramasinghe Reference Hoyle and Wickramasinghe1977). A connection with life was beginning to appear reasonable and so also a link between the organic molecules in interstellar clouds interstellar dust.
The 1970s and 1980s witnessed a rapid march of astronomical spectroscopy with the deployment of telescopes and instruments above Earth's atmosphere. From an analysis of both UV and infrared spectra it was possible to conclude that an organic polymeric composition of interstellar dust was strongly favoured, with a similar composition also indicated for the dust present in the tails of comets (Wickramasinghe Reference Wickramasinghe1974; Vanysek & Wickramasinghe Reference Vanysek and Wickramasinghe1975; Hoyle & Wickramasinghe Reference Hoyle and Wickramasinghe1977). Unlike radio and millimetre wave identifications (Table 1), which refer to individual molecules, infrared spectra of dust arises from several different functional groups, and the challenge for astronomers is to identify a plausible ensemble of molecules consistent with such spectra.
We tested a range of possibilities for the organic composition of dust and eventually felt justified to conclude that the best fit to all the spectroscopic data is achieved if one is able to entertain a seemingly outrageous idea: most interstellar organic dust starts off as biological (bacterial) cells, just as nearly all organic molecules on Earth start off as biology. In a single stroke we then had a solution to the problem of the origin of life on planets on the one hand and the composition of interstellar dust on the other. However, this still left open the question of how, when and where the first life in the Galaxy (or in the Universe) arose.
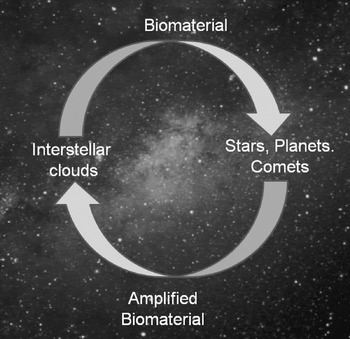
Based on this picture, the ‘life-cycle’ of organic matter in the galaxy is shown schematically in Fig. 1. Life has started sometime, somewhere, somehow, possibly before the galaxy itself was formed. Biological cells (a minute fraction remaining viable would suffice) are included in the dust clouds that form protoplanetary nebulae (PPNe) and planetary systems, such as our own Solar System. Comets, when they condense from interstellar material in the outer regions of a planetary system, incorporate a fraction of viable bacteria. These then multiply exponentially in radioactively heated liquid cometary interiors on timescales of less than a million years. As the comets subsequently re-freeze, the vastly amplified population of bacterial cells remain in a deep frozen state until they are shed in cometary dust tails back into interstellar space – the long-term reservoir of cosmic biology. The cycle of Fig. 1 implies a strong positive feedback with a continuous replacement and amplification of viable bacterial cells in the interstellar medium.
Amplification cycle of cosmic biology.

It should be noted that the lower half of the circuit of Fig. 1 could include other delivery modes besides comets contributing to a positive feedback. Life-carrying planetary debris that is expelled from one planetary system can become incorporated in new planetary systems elsewhere, thus providing a process of lateral gene transfers and Darwinian evolution on a cosmic scale (Wallis & Wickramasinghe Reference Wallis and Wickramasinghe2004; Joseph Reference Joseph2009).
Extinction by bacterial grains
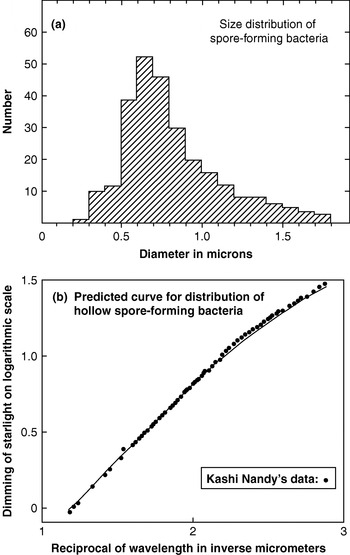
When a bacterial cell emerges from a sublimating or outgassing comet into the vacuum of interstellar space, free water in its interior (which makes up 60% by weight) is expelled. Cavities develop, leading to a hollow organic grain possessing an average optical refractive index n=1.167 (Hoyle & Wickramasinghe Reference Hoyle and Wickramasinghe1979). This property turns out to be of crucial importance in providing an exceedingly close match to the observed scattering behaviour of interstellar dust. Figure 2(b) shows the calculated extinction behaviour for a size distribution of dehydrated bacteria compared with the interstellar extinction observations in the visual spectral region – the region over which the extinction behaviour is remarkably uniform in the galaxy; Fig. 2(a) shows the size distribution of terrestrial spore-forming bacteria used in this calculation.
Points represent the visual extinction data normalized to Δm=0.409 at 1/λ=1.62 μm−1 and Δm=0.726 at 1/λ=1.94 μm−1 (Nandy, Reference Nandy1964); the curve is the calculated extinction curve for a size distribution of freeze-dried spore-forming bacteria with the size distribution given by the histogram in (a). The calculation uses the classical Mie theory and assumes hollow bacterial grains comprised of organic material with refractive index n=1.4 and with 60% vacuum cavity caused by the removal of free water under space conditions. (b) Size distribution of terrestrial spore-forming bacteria as given in standard compilations of bacteriological data.

A possible criticism that a scattering phenomenon, as the points in Fig. 2 represent, is not diagnostic of precise particle composition is easily refuted in the present context. The quality of the fit between astronomical data and the model appeared as remarkable in 1979 as it does today because, in a strict sense, it was parameter-free. Once we postulate that interstellar grains mostly start off as bacterial cells of the kind we have on Earth, there are no free parameters left to fit. Alternative fits to extinction with mixtures of inorganic dust (conventional models) require the fine tuning of several free parameters, which makes such solutions less attractive (see the review by Krishna Swamy Reference Krishna Swamy2005).
Infrared spectroscopy clinches the case
Spectroscopic studies of interstellar dust in the infrared carried out from the 1980s continue to establish a preference for biologically generated organics compared with competing inorganic models. In the present article we summarize only a small fraction of the data that supports this claim.
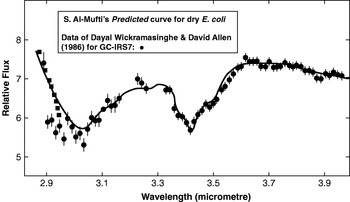
Over a 2–4 μm waveband a prediction of desiccated bacterial dust was verified by subsequent telescope observations in 1981 for the galactic centre infrared source GC-IRS7 (Allen & Wickramasinghe Reference Allen and Wickramasinghe1981). The remarkable fit displayed in Fig. 3 implies that some 30% of all the carbon in interstellar space is tied up in the form of carbonaceous dust whose spectra cannot be distinguished from desiccated bacteria.
The first detailed observations of the Galactic centre infrared source GC-IRS7 (Allen & Wickramasinghe Reference Allen and Wickramasinghe1981) compared with earlier laboratory spectral data for dehydrated bacteria.

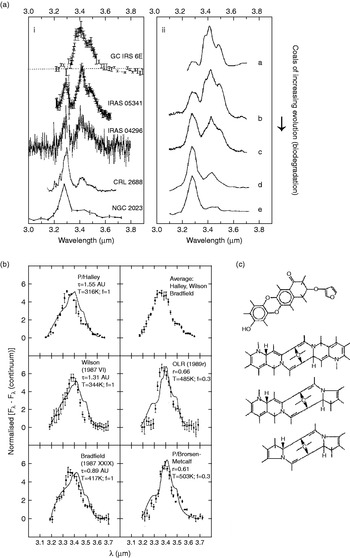
Figure 4(a) shows other infrared sources where over the 3–3.8 μm spectral region a range of degradation states of biology is clearly indicated. Figure 4(b) shows a generally similar sequence of spectra confirming the presence of organic dust in the tails of comets, the first discovery of which was made for dust from Halley's comet by Wickramasinghe & Allen (Reference Wickramasinghe and Allen1986).
Normalized absorption profiles of a number of galactic infrared sources compared with spectra of coals of varying degrees of degradation – (i) being the closest to desiccated bacteria. (b) The points represent the 3.1–3.8 μm emission profiles of several comets. The curves are for bacterial PAH where f is the ratio of opacities arising from aromatic molecules at 3.28 μm to that from E-coli at 3.4 μm. (c) Functional groups in the break-up fragments of impacting interstellar dust grains, inferred by Krueger & Kissel (Reference Krueger and Kissel2000) from mass spectroscopy.

Much higher resolution infrared spectra obtained in the last decade do not in any way detract from the strength of our earlier conclusions. Infrared properties of dust, although variable from source to source, are consistent with the widespread occurrence of the degradation products of biology (Smith et al. Reference Smith2007).
Direct mass spectroscopy of interstellar dust in the Stardust mission (Krueger & Kissel Reference Krueger and Kissel2000; Krueger et al. Reference Krueger, Werther, Kissel and Schmid2004) has also shown the presence of cross-linked heteroaromatic structures in the degradation products of impacting interstellar grains. Evidence of fragments with an atomic mass unit (AMU) greater than 2000, consistent with pyrrole, furan substructures and quinines, were found (Fig. 4(c)). The fractured components of cell walls are arguably the only types of molecular structures that would survive impacts at speeds of ~30 km s−1.
The astonishingly close fits to the data seen in Figs 2–4 are impressive in so far as they show consistency with a model that has a strong a priori plausibility. If we had no such model to start with, it would not be possible to infer the model uniquely from the data – any more than we can infer Newton's Laws of motion from planetary motions independent of a heliocentric hypothesis – so this is not in itself a handicap.
In the normal pursuit of science such a remarkable set of verified predictions (Figs 2–4) would lend enormous weight to the relevant model – the panspermia model, in this case. However, even this type of fit turning up repeatedly had little effect on Earth-centred astronomers who thought biological explanations of any astronomical phenomenon to be bizarre and untenable. However contrived they were, inorganic models were always given a higher weight in the scale of acceptability and recognition. In a similar way the Ptolemaic epicycle model was considered sacrosanct in times past.
Comet dust recovered from comet Wild2 in the Stardust Mission may have, with hindsight, given absolutely decisive results about the cosmic origins of life. However, this mission was planned at a time when the prospect of cometary life or even cometary organics was thought inconceivable. In the event the collection procedure involved the use of unsterilized blocks of aerogel, thus confounding the interpretation of any organics detected in the experiment. Notwithstanding these limitations, dust collected from comet Wild2 did show evidence of organic molecules consistent with degraded biomaterial (possibly wrongly interpreted as prebiotic molecules) along with refractory mineral dust (Sandford et al. Reference Sandford2006).
Unidentified interstellar features and polyaromatic hydrocarbons
Visual and infrared bands
Since the 1920s astronomical spectra have revealed a set of over 200 diffuse absorption features in the visual spectral region that still defies identification (Wickramasinghe Reference Wickramasinghe1967; Hoyle & Wickramasinghe Reference Hoyle and Wickramasinghe1991). The strongest of these features is at λ=4430 Å with a width at half maximum of 30 Å. This and other features are strongly suggestive of absorptions by biological pigments (Johnson Reference Johnson, Greenberg and Roark1967).
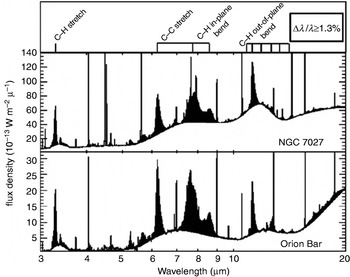
Unidentified spectral features also cover the infrared wavelength region. Unidentified infrared bands (UIBs) have been discovered in several types of astronomical object – planetary nebulae, PPNe and in the diffuse interstellar medium (Chan et al. Reference Chan2001). Figure 5 shows spectra for the planetary nebula NGC7027 and for the Orion Bar.
Infrared emission spectra of NGC7027 and the Orion Bar (from Thaddeus Reference Thaddeus2006).

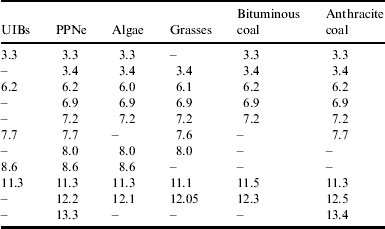
Distribution of central wavelengths (micrometers) of absorption bands in astronomical sources (UIB's and PPNe's) and in laboratory samples derived from biomaterial (Rauf and Wickramasinghe, Reference Rauf and Wickramasinghe2009)
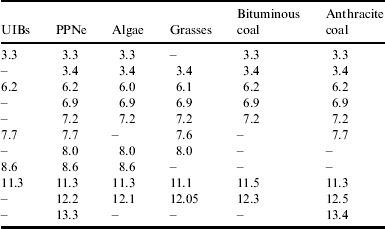
The precise set of molecular configurations responsible for both the visual and infrared absorption features remain unknown at the present time, although complex organic molecules appear most likely (Snow Reference Snow2001; Thaddeus Reference Thaddeus2006). In order to produce the observed opacities (strengths) in the astronomical bands, both in the visual and the infrared, a large fraction of interstellar carbon must be tied up in the form of organic molecules (Hoyle & Wickramasinghe Reference Hoyle and Wickramasinghe1991).
Polycyclic aromatic hydrocarbons (PAHs) in various ionization states have been proposed in order to account for data showing infrared emissions at the wavelengths listed in Table 1 for PPNe, and more generally for UIBs in the diffuse interstellar medium (Rauf & Wickramasinghe Reference Rauf and Wickramasinghe2009). The best agreements are seen to arise from models where degradation products of biology are involved, with biological pigments and chromophores playing a decisive role.
UV feature at λ=2175 Å
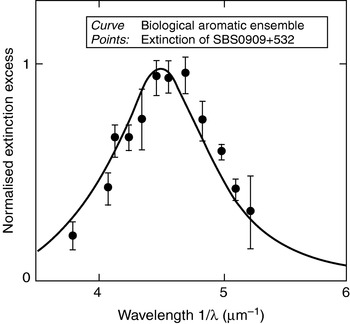
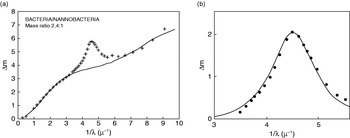
Similarly, the omnipresent UV absorption feature of interstellar dust at 2175 Å is more plausibly explained on the basis of aromatic molecules in biology compared with competing inorganic models (Hoyle & Wickramasinghe Reference Hoyle and Wickramasinghe1991; Wickramasinghe et al. Reference Wickramasinghe, Wickramasinghe and Napier2009a). Figure 6 shows the λ=2175 Å absorption feature associated with dust in a galaxy at a redshift of z=0.86 – some 7–9 billion light years away. Figure 7 shows the overall extinction curve of our own galaxy, including the contribution from hollow bacterial dust (Fig. 2), biological aromatics and nanobacteria that contribute to scattering in the furthest UV absorption band. Attempts to explain the unidentified emission/absorptions in the infrared, as well as the UV absorption band at 2175 Å on the basis of non-biologically generated PAHs are difficult to defend (Hoyle & Wickramasinghe Reference Hoyle and Wickramasinghe1991).
The curve is the normalized absorption coefficient of an ensemble of 115 biological aromatic molecules. The points are observations for the galaxy SBS0909+532 (Motta et al. Reference Motta2002), representing the total extinction from which an underlying bacterial scattering component has been subtracted.

The mean extinction curve of the galaxy (points) compared with the contribution of desiccated bacteria and nanobacteria. Data is from compilation by Sapar and Kuusik (Reference Sapar and Kuusik1978). (b) The residual extinction compared with the normalized absorption coefficient of an ensemble of 115 biological aromatic molecules.

The only successful positive detection of a specific interstellar PAH molecule is corannulene (C20H20), the detection being achieved in the microwave spectrum of the Taurus Molecular Complex TMC1 (Kaifa et al. Reference Kaifu2004; Lovas et al. Reference Lovas2005). However, it is estimated that only 1 in 10−5 of the carbon atoms in the cloud are of this form. Extrapolating this result to the general interstellar medium, we would find that neither the observed strength of the 2175 Å UV feature, nor the UIBs can be explained.
Extended red emission
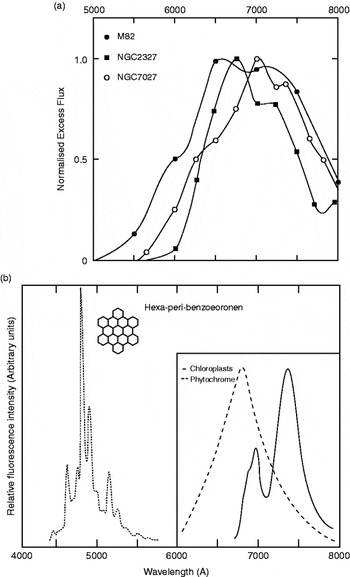
A fluorescence phenomenon in the form of an extended red emission has been observed in planetary nebulae (Furton & Witt Reference Furton and Witt1992), HII regions (Sivan & Perrin Reference Sivan and Perrin1993), dark nebulae and high latitude cirrus clouds in the Galaxy, as well as in extragalactic systems (Perrin et al. Reference Perrin, Darbon and Sivan1995). This phenomenon has a self-consistent explanation on the basis of the fluorescence of biological chromophores (pigments), e.g. chloroplasts and phytochrome. Competing models based on emission by compact PAH systems are not as satisfactory, as is evident in Fig. 8. Hexa-peri-benzocoronene is one of a class of compact polyaromatic hydrocarbons that have been discussed in the astronomical literature. However, the width and central wavelength of its fluorescent emission leave much to be desired.
The points in (a) show normalized excess flux over scattering continua from the data of Furton & Witt (Reference Furton and Witt1992) and Perrin et al. (Reference Perrin, Darbon and Sivan1995). (b) (inset panel) shows the relative fluorescence intensity of spinach chloroplasts at a temperature of 77 K. The dashed curve is the relative fluorescence spectrum of phytochrome. (b) (main panel) is the fluorescence spectrum of hexa-peri-benzocoronene.

Occam's razor
If Occam's razor is to be used to sift competing hypotheses it should be used to discard the increasingly convoluted set of arguments being used to prop up a geocentric model of life. It was once thought that we would never know what stars are made of, but the advent of spectroscopy changed this idea overnight. A mystical ‘celestial essence of stars’ was then replaced with common (and not-so-common) chemical elements that were known to be present on Earth. A similar transition from ‘mysterious PAHs’ and products of a hypothetical interstellar prebiology to biology and biological degradation products on a galaxy-wide scale would seem well overdue. The overwhelming bulk of organic material, including a vast kerogen reservoir and PAHs on our planet, has a biological origin. There is no compelling logic to confine the terrestrial biosphere to Earth. In the absence of evidence that a transformation of inorganic material to life is taking place everywhere, panspermia and a galaxy-wide biosphere would be the simplest hypothesis consistent with all the facts.
Origin of life in an expanded cosmic setting
How, when and where did life originate in the first instance?
If it could be demonstrated that life can arise readily from non-living matter over a plausible timescale in any terrestrial setting, there will be no raison d'être for considering theories of cosmic origin. Considerations of parsimony would direct our attention to purely terrestrial scenarios of life's origins.
The grotesquely huge odds against life originating in a diminutive terrestrial setting that we discussed in the second section would be greatly eased by going to ever-increasing numbers of similar cosmic settings. If the total mass and volume of a connected set of cosmic domains can be increased without limit then an infinitesimal probability of origin in one place could be overcome in the collective setting. Hoyle and the present author and Napier and Wickramasinghe have discussed precisely such scenarios for a cosmic origin of life (Hoyle & Wickramasinghe Reference Hoyle and Wickramasinghe1991; Napier et al. Reference Napier, Wickramasinghe and Wickramasinghe2007). Irrespective of how, where and when life first arose, panspermia models argue that amplification through exponential replication and its galaxy-wide spread is unstoppable and inevitable.
Survival attributes of bacteria
Claims that panspermia is ruled out a priori because bacteria and bacterial spores do not survive interstellar and interplanetary transit have repeatedly been shown to be false and are manifestly flawed. In the cometary panspermia models it would be reasonable to suppose that ~10% of the mass of a typical 10 km sized comet was initially derived from bacterial cells – giving a mass of ~1017 g equivalent to the total mass of some 1031 bacteria. A million viable (surviving) cells entering a suitable environment within a primordial comet would be exponentially amplified to swamp an entire liquefied cometary interior on a timescale well under a million years. This would demand only a fraction of one in 1025 iterant bacteria to have retained viability when comets condensed in the early Solar System.
Since the 1980s evidence for the space hardihood of bacteria/spores has continued to grow. Bacteria cannot only survive high temperatures (in hydrothermal vents) and extreme cold and dry conditions (in the Antarctic), but they can also survive exposure to surprisingly high doses of ionizing radiation. In addition they can survive shock pressures of several GPa, such as would be encountered in planetary exits and entrances (Burchell et al. Reference Burchell, Mann and Bunch2004).
All the indications are that bacteria can achieve more than the minimum survival fractions required during interstellar transit and re-entry into potential new habitats. Experiments claiming a contrary result are mostly based on the application of very high fluxes to cultures of bacteria for short timescales, and these are likely to be irrelevant to interstellar exposure conditions where exceedingly low fluxes of ionizing radiation are delivered over millions of years (Hornek et al. Reference Horneck, Horneck and Baumstark-Khan2002; Wickramasinghe & Wickramasinghe Reference Wickramasinghe and Wickramasinghe2003; Wickramasinghe et al. Reference Wickramasinghe, Wickramasinghe and Napier2009a). Close analogies to the interstellar situation are realized in the discovery of viable microbes in bees fossilized in amber for 40 million years (Cano & Borucki Reference Cano and Borucki1995), and in salt crystals for 250 million years (Vreeland et al. Reference Vreeland, Rosenzweig and Powers2000) – such microbes being subject to low background fluxes of ionizing radiation for astronomically relevant timescales.
Ongoing panspermia
From spectroscopic proofs we next turn to the possibility of demonstrating ongoing panspermia – the continuing input of cometary bacteria to Earth. We have attempted to do this by collecting cometary dust in the stratosphere using sterilized cryogenically cooled collecting devices (cryopumps) lofted on balloons to heights of 41 km above Earth's surface. Microbiological analysis of material collected in this way, conducted by Harris et al. (Reference Harris2002) and Wainwright et al. (Reference Wainwright, Wickramasinghe, Narlikar and Rajaratnam2003, Reference Wainwright, Wickramasinghe, Narlikar, Rajaratnam and Perkins2004), have indeed yielded positive results, but their interpretation as definite proof of externally introduced microorganisms requires further scrutiny. Mechanisms do in fact exist for lofting sub-micron-sized dust, including bacteria above 41 km on rare occasions (Wainwright et al. Reference Wainwright, Alharbi and Wickramasinghe2006; Dehel et al. Reference Dehel, Lorge and Dickinson2008). Thus it is conceivable that the stratosphere contains a mixed population of microorganisms, some from Earth and some from comets.
Already the evidence in our collected samples for the presence of viable but not culturable bacteria points to a component that is extraterrestrial (Harris et al. Reference Harris2002; Wainwright et al. Reference Wainwright, Wickramasinghe, Narlikar, Rajaratnam and Perkins2004). This work clearly needs to be repeated with more stringent controls, and hopefully reaching heights above 41 km. In view of the profound importance to science of an experiment of this kind, it is surprising that it is not yet on the agenda of major space agencies.
Early declaration of proof
Spectroscopic correspondences, such as those we discussed in earlier sections, together with a vast body of facts from biology, were considered by Hoyle and the author in 1982 (Hoyle & Wickramasinghe Reference Hoyle and Wickramasinghe1982) to be already sufficiently compelling to assert that the thesis of life being cosmic was all but proved. We published a document ‘Proofs the Life is Cosmic’ in which we assembled evidence that pointed inexorably in the same direction – that life is truly cosmic.
The document, now available at http://www.astrobiology.cf.ac.uk/proofs...pdf, is divided into nine sections.
A: The atmospheric entry of microbes, showing that microbes can survive entry to Earth.
B: Bacteria – their amazing properties of radiation resistance and survival under space conditions.
C: Comets – their role as amplifiers and distributors of life in the galaxy.
D: Diseases – the still contentious connection between comets and epidemics.
E: Evolution – showing that the evolution of life on Earth requires an open system, including periodic additions of pristine extraterrestrial genetic material. These are inserted like subroutines into a computer programme to be used whenever an opportunity arises.
I: Interstellar dust – the properties of which show a connection with bacteria and bacterial degradation products.
M: Meteorites – arguments about microfossils in meteorites.
O: Origin of Life – elusive concept.
P: Planets – evidence that life is widely present in the Solar System. We argued that the clouds of Venus show evidence of bacterial life, as determined by their light-scattering properties. In general, we asserted that the colours of planets and the associated dust properties inferred from scattering studies could be used to infer the presence of life.
An unequivocal declaration
The impressive list of evidence collated in the year 1982 has of course been vastly expanded by later work of numerous investigators. This is particularly so for the progress made recently in (B) the study of extremophiles, (C) the space exploration of comets, (E) molecular biology and genetics and (P) life on other planets and satellites. Many of our earlier arguments under category (E) have been developed and amplified by Joseph (Reference Joseph2000, Reference Joseph2009) to the point of becoming decisive.
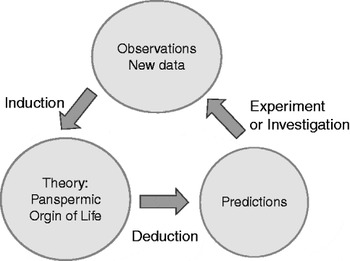
In accordance with the scientific methodology pioneered by philosophers in the 17th century we can use the feedback loop of Fig. 9 to generate cycles of prediction–verification–re-affirmation to put a theory or hypothesis to ever more stringent tests. Needless to say it has led to a veritable list of successes and confirmations over the past three decades, implying consistency, nay proof, of the hypothesis of panspermia.
The deductive/inductive method of science.

The loop of Fig. 9 confirming the panspermia hypothesis has been enormously strengthened in recent years. The spectroscopic identification of interstellar dust and molecules in space, which was our starting point in the 1970s, has come into much sharper focus. Their biochemical relevance is now widely conceded, although a fashion remains to assert without proof that we are witnessing the operation of prebiotic chemical evolution on a cosmic scale. If biological evolution and replication are regarded as the only reliable facts, life always generates new life, and this must surely be so even on a cosmic scale. Prebiology, whether galactic or planetary, remains an unproven hypothesis that fails the test implied in Fig. 9. It is in the author's view a mistaken remit of modern astrobiology to seek an origin of life everywhere where conditions appear to be congenial. The genetic components of life, no matter where it first arose, are mixed on a Galaxy-wide scale. Life was most likely to have been first introduced to Earth during the Hadean epoch by impacting comets billions of years ago, thereby establishing our cosmic ancestry. However, the precise manner by which non-living matter in the cosmos turned into life in the first instance may be a problem that eludes us for generations to come.