





Protein intake has been studied extensively as a means of improving muscle function and increasing or maintaining muscle mass in sports, during weight loss, disease or ageing. An important aspect of this anabolic property of dietary protein is the resulting postprandial aminoacidemia, which is often described by AUC and maximum concentration of – specific – blood amino acids (AA). Postprandial aminoacidemia is known in the short term (hours) to stimulate muscle protein synthesis, especially when combined with – resistance-type – exercise(Reference Gwin, Church and Wolfe1). Postprandial AA concentration of total essential or individual AA depends on both AA composition of a protein and the digestion and absorption processes, which are known to differ between protein sources. In general, animal-derived proteins are relatively easy to digest, while some plant proteins are less digestible. This is because of their tertiary structural integrity, modifications like glycosylation and phosphorylation as well as the presence of anti-nutritional factors, like protease inhibitors, tannins, phytic acid and saponins that limit digestion(Reference Boutrou, Coirre and Jardin2–Reference Yu, Fournier and Gilar5).
Individuals can vary in many physiological characteristics related to food digestion and uptake, for example, chewing, nutrient sensing, saliva and gastric fluid composition, stomach morphology, enzymatic amount and activity, bile acids, intestinal barrier and absorption function, variation in active transporters and downstream metabolism(Reference Walther, Lett and Bordoni6). The knowledge in this domain is very fragmented with little understanding of nutritional relevance. Due to these individual differences, considerable variation in postprandial AA kinetics can be expected between individuals ingesting the same protein source. We recently performed a human cross-over intervention study and observed that postprandial plasma AA profiles from an easily digestible animal protein were quite comparable among individuals(Reference Mes, Esser and Oosterink7). However, the same profiles from a moderately digestible plant protein source (water lentil) showed a larger CV among individuals (24·7 v. 35·6 % for whey v. water lentil AUC total AA (TAA))(Reference Mes, Esser and Oosterink7), suggesting that less digestible plant-based proteins might result in larger bioavailability variation between persons. This could be of relevance for those individuals that consistently show a low bioavailability, even when adhering to protein intake recommendations. More attention should be given to inter-individual – between-person – variation of nutrient uptake and how people respond to food interventions(Reference Walther, Lett and Bordoni6), which was nicely illustrated by the study of Zeevi et al. (Reference Zeevi, Korem and Zmora8) on glucose responses, as this can lead to precision nutrition advice in the future.
Another aspect, which is frequently overlooked, is the within-person – or intra-individual – variation. This refers to how large the day-to-day variability within an individual is when receiving the same intervention. To establish differences in AA kinetics between individuals, variation within an individual should be taken into account. Clearly, more information about both between- and within-person variation in postprandial AA kinetics of different protein sources is needed to assess the nutritional value of a protein, next to methods that directly measure protein digestibility scores (i.e. digestible indispensable amino acid score (DIAAS)) using animal models or stable isotope technology.
Therefore, the aim was to quantify the variability in postprandial AA kinetics within and between individuals after consumption of a moderately digestible plant protein source (lucerne (alfalfa)) and an easily digestible animal protein source (whey). This research should answer the question of whether between-person (‘inter-individual’) variability is larger than within-person (‘intra-individual’) variability and if this differs between these sources. In addition, the consistency in individual response between the two different protein sources was investigated.
Material and methods
Study design
The study was a randomised, cross-over, double-blind, controlled trial in which subjects visited the Human Nutrition Research Unit of Wageningen University & Research (Wageningen, the Netherlands) on five occasions with a washout period of 1 week between test days. The study was conducted according to the principles of the Declaration of Helsinki (64th WMA Assembly, October 2013) and in accordance with the Medical Research Involving Human Subjects Act (WMO 1998). The study was approved by a local ethical committee (METC Utrecht 21-153, NL77937.041.21) and registered at ClinicalTrials.gov: NCT05118412.
The objective of this study was to assess variation between and within individuals. In previous studies from our own lab(Reference Mes, Esser and Oosterink7,Reference Zeinstra, Somhorst and Oosterink9,Reference Ummels, JanssenDuijghuijsen and Mes10) using twelve subjects, already clear differences in AA response between participants could be observed after consumption of a poorly digestible protein source. Whereas all individuals showed comparable postprandial AA profiles of the reference protein whey, for the other – non-whey – proteins in some cases appreciable differences were observed. As there is no way to predict a priori how people will respond, by choosing a sample size that is 50 % larger than that in the previous studies, it will be reasonably certain to again find subjects who show differences in postprandial responses. Hence, we aimed to include eighteen participants.
During each visit, research subjects received a product in the form of a protein drink representing a 20 g protein load in randomised order. Three times an identical moderately digestible lucerne protein concentrate (LPC) and two times an identical well-digestible whey protein concentrate (WPC) were consumed after an overnight fast. LPC was provided three times, as larger variation was anticipated for this source, in line with our previous study on water lentils(Reference Mes, Esser and Oosterink7). The ten different ways to divide the two proteins over the 5 weeks were divided randomly over the subjects, with eight sequences occurring twice and two occurring once. Randomisation was done by someone outside the research team, using a computer-generated list, based on block design and stratification by age and BMI.
Research subjects received the same standardised evening meal prior to each test day (481 kcal; 19·8 g fat, 58·5 g CHO, 14 g protein and 7·7 g fibre), to be consumed between 6 and 8 pm after which no more food/drinks consumption was allowed except for some plain water; in addition, subjects were asked not to drink alcohol or perform heavy exercise the day before each test day. The next morning venous blood was collected via an antecubital catheter before (t = 0) and up to 4 h after protein consumption at regular time intervals (t = 15, 30, 45, 60, 90, 120, 150, 180 and 240 min). The primary study outcome was plasma AA kinetics of free AA calculated using the ‘aaresponse’ package for R(Reference Wehrens, Engel and Mes11), with the points of interest: ‘AUC’, maximum peak height (‘Height’), both corrected for baseline plasma AA concentration, and time to peak (‘Time2Peak’).
Study population
Subjects were recruited in October 2021 and had to be between 18 and 40 years of age, a BMI between 18·5 and 30 kg/m2, and no (history of) metabolic, gastrointestinal, inflammatory or chronic disease or use of medication that might suppress the immune system or influence the study results, such as gastric acid inhibitors, laxatives, stomach protectors and drugs that can affect intestinal motility. Smoking, abuse of drugs, excessive alcohol intake, pregnancy (wish), a medically prescribed or extreme diet and low blood Hb level (< 7·5 for females and < 8·5 for males) were exclusion criteria. Study execution took place in November and December 2021. All participants signed the informed consent.
Intervention
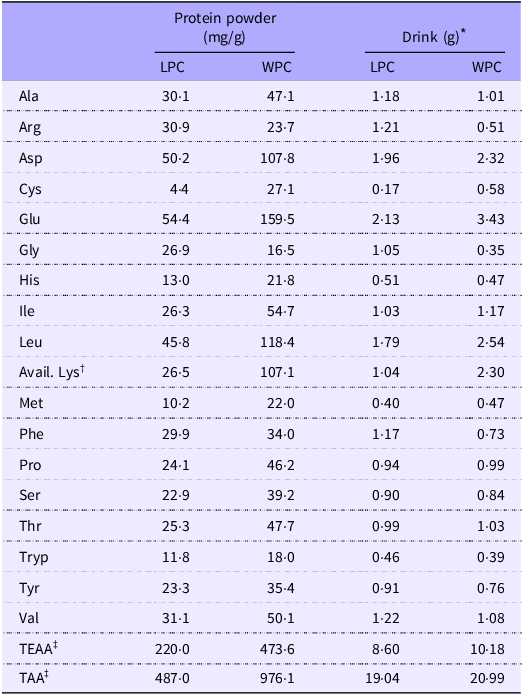
A single dose of 20 g of intervention protein was provided of either LPC (Luzixine™) or WPC (kindly donated by Nutricia). Nutritional details of the products, as provided by the suppliers, can be found in online Supplementary Table S1.
Dry mass and N (determined using Dumas) of both products were measured and were 923·1 v. 951·8 g/kg product and 82·6 v. 145 g/kg product for LPC and WPC, respectively. Protein content was based on N and a protein conversion factor of 6·19 and 6·38 for LPC and WPC, respectively. Therefore, for LPC 39·1 g of product was given to provide 20 g of protein, whereas for WPC 21·5 g was given. AA composition of the WPC and LPC, as measured in our own lab (see below for details of the analysis), can be found in Table 1. LPC was provided on three occasions and WPC on two occasions, in random order, with at least 1 week in between test days. All protein powders were vigorously dissolved/resuspended in 300 ml of water, and subjects were asked to consume it within 10 min with an additional 100 ml of plain water to rinse the drinking cup to ensure that all of the intervention product was consumed. Drinks were covered with foil so that the participants could not see the colour and texture of the product, although its taste could identify the product. The study coordinator checked whether intake of the provided shake was completed according to protocol. In the large majority of the cases (96 %), the product was consumed between 8 and 12 min. All other members of the study team were blinded for the condition until after data analysis.
Measured AA composition of the protein powders and intervention drink

Table 1. Long description
A table comparing amino acid composition in protein powders and drinks. The table has 19 rows and 4 columns. The columns are labeled Protein powder (mg/g) and Drink (g) with sub-columns LPC and WPC. The rows are labeled with different amino acids and totals. Row 1: Ala, 30.1, 47.1, 1.18, 1.01. Row 2: Arg, 30.9, 23.7, 1.21, 0.51. Row 3: Asp, 50.2, 107.8, 1.96, 2.32. Row 4: Cys, 4.4, 27.1, 0.17, 0.58. Row 5: Glu, 54.4, 159.5, 2.13, 3.43. Row 6: Gly, 26.9, 16.5, 1.05, 0.35. Row 7: His, 13.0, 21.8, 0.51, 0.47. Row 8: Ile, 26.3, 54.7, 1.03, 1.17. Row 9: Leu, 45.8, 118.4, 1.79, 2.54. Row 10: Avail. Lys, 26.5, 107.1, 1.04, 2.30. Row 11: Met, 10.2, 22.0, 0.40, 0.47. Row 12: Phe, 29.9, 34.0, 1.17, 0.73. Row 13: Pro, 24.1, 46.2, 0.94, 0.99. Row 14: Ser, 22.9, 39.2, 0.90, 0.84. Row 15: Thr, 25.3, 47.7, 0.99, 1.03. Row 16: Trp, 11.8, 18.0, 0.46, 0.39. Row 17: Tyr, 23.3, 35.4, 0.91, 0.76. Row 18: Val, 31.1, 50.1, 1.22, 1.08. Row 19: TEAA, 220.0, 473.6, 8.60, 10.18. Row 20: TAA, 487.0, 976.1, 19.04, 20.99.
AA, amino acid; LPC, lucerne protein concentrate; WPC, whey protein concentrate; TEAA, total essential amino acids; TAA, total amino acids.
Free AA composition according to ISO13904 and ISO13903 protocols.
* For LPC, 39·1 g of the product was consumed, and for WPC, 21·5 g of the product was consumed.
† Reactive lysine (LYS) was determined as described in reference no. 41; 16·6 % of the LYS was damaged for lucerne, whereas none was damaged for whey.
‡ With available LYS.
Amino acid composition of products
Procedures according to ISO13904 and ISO13903 were followed to determine AA composition. In brief, for cysteine and methionine determination, the samples were oxidised before hydrolysis. For all other AA, no oxidation step was required before hydrolysis. The AA were separated by ion-exchange chromatography and determined by reaction with ninhydrin, using photometric detection at 570 nm and 440 nm for proline. Tryptophan was determined by reversed-phase C18 HPLC with fluorescence detection.
Amino acid analysis in blood
In total, twenty free AA were determined in all collected blood samples. The blood plasma samples were analysed as described by Mes et al. (Reference Mes, Esser and Oosterink7) and based on the Waters AccQ-Tag ultra-derivation kit and HPLC method (Waters™ Chromatography B.V.) for AA analyses. TAA was calculated as the sum of all individual AA, while total essential AA (TEAA) was the sum of all essential AA, that is, histidine, isoleucine, leucine, available lysine, methionine, phenylalanine, threonine, tryptophan and valine.
Data analysis
Analysis of the data to obtain parameters of interest (PoI) from each individual time curve (i.e. AUC, Height and Time2Max) was performed(Reference Mes, Esser and Oosterink7,Reference Wehrens, Engel and Mes11) , using the ‘aaresponse’ package for R (www.R-project.org), which is made available as open-source software from https://github.com/Biometris/aaresponse. ‘AUC’ is area under the curve corrected for baseline (also known as iAUC) expressed as µM × 15 min; ‘Height’ is peak height of plasma AA response corrected for baseline (µM) and ‘Time2Max’ is time to peak height (minutes). Curation steps were included at the level of the PoI as well as at the level of the curve parameters. In a few cases where no values could be estimated, either because of curation or because no curve could be fitted, a simple imputation mechanism was used to obtain estimates for Height and AUC(Reference Wehrens, Engel and Mes11). This imputation is based on the raw data and is especially effective if no clear structure is present in the data points.
Next, a mixed model was fitted to each PoI to describe the effects of the interventions on the PoI. The model is given by the following:
 ${\rm{PoI}} = {\rm{Intervention}} + \left( {{\rm{Intervention}}|{\rm{Participant}}} \right)$
where the first term on the right side of the equation is a fixed effect for the intervention (the protein condition) and the second is a term describing the random effects for the participants. These are normally distributed and allowed to have different values as well as variances for each intervention. The within-person variance is assumed to be constant across interventions. The random term is more sophisticated than in earlier publications and can be fitted because of the presence of repeated interventions for the same participants.
From this model, the variance components describing within- (σ2 within) and between-individual (σ2 between) variability were extracted. From these, the intra-class correlation coefficient (ICC) given by σ2 between/(σ2 between + σ2 within) was calculated. This number (always between 0 and 1) describes the fraction of the total variation related to between-individual variance. Only the PoI AUC and peak Height were considered in this analysis. For Time2Max, imputation is not feasible – if no clear peak is visible (i.e. mainly for the LPC condition), one cannot estimate its location. This leads to a relatively large number of cases where no value can be estimated, and hence comparisons for Time2Max are less precise than for the other PoI; therefore, Time2Max is not considered further.
To assess the consistency of participant responses for the two protein sources, the random-effect estimates for each participant in the two interventions were plotted and a Pearson’s correlation coefficient was calculated.
As circulating blood volume (BV) can be a factor introducing differences between individuals when consuming a similar absolute amount of protein, this was taken into consideration using a BV prediction formula based on Nadler(Reference Nadler, Hidalgo and Bloch12). This takes differences in weight and height between individuals into account and also considers sex. The mixed models were refitted, now focusing on the product of BV and AUC or Height.
The assumptions of the model were checked and turned to be valid. A check was done for a time (period) effect which was not present. Sex, age and BMI were not included separately in the models as the study was not designed and not powerful enough to do so. However, the consideration of estimated BV includes sex and differences in weight and height between individuals.
Results
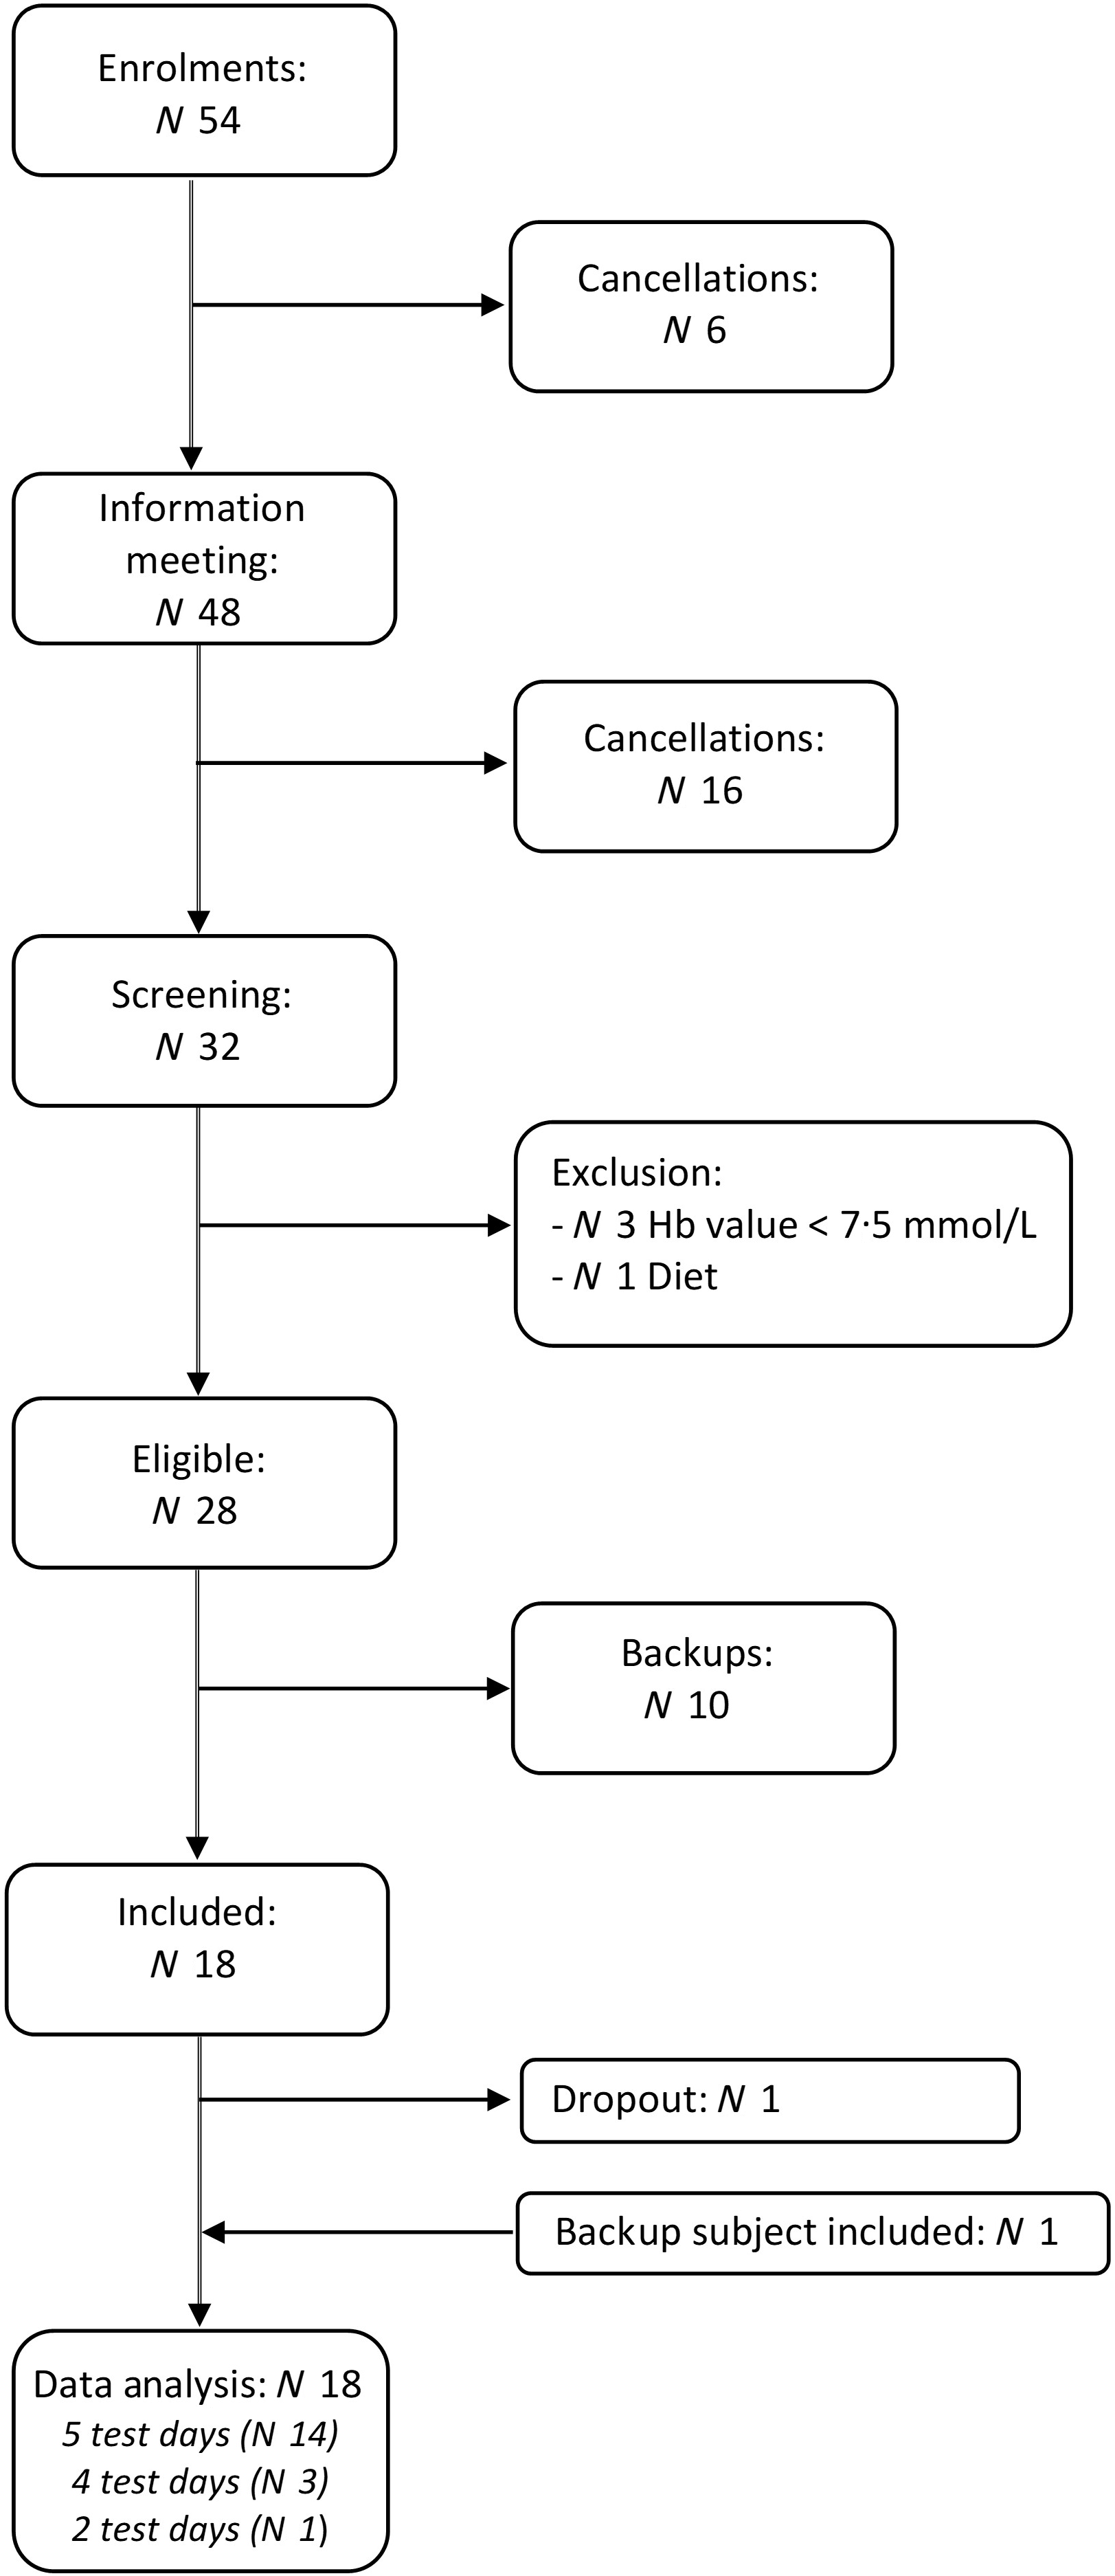
Figure 1 shows the flow chart of participants. A total of twenty-eight subjects were eligible, of whom ten were placed on a waiting list. One subject dropped out in an early stage and was replaced by someone from the waiting list. Final data analysis was performed on data from eighteen apparently healthy male and female adults (11 female/7 male; age 22·8 (sd 3·8) years, BMI 22·9 (sd 2·4) kg/m2). Fourteen subjects completed all five trials; one subject completed only one whey and one LPC condition, one subject completed one whey and all three LPC conditions, and two subjects completed both whey and two (out of three) LPC conditions. Personal circumstances as well as minor illnesses caused these incomplete executions: no serious adverse events were reported. However, due to our approach, all completed test days could be used in our analysis, including those of subjects who had less than 5 test days.
Flow chart of participants.

Protein sources
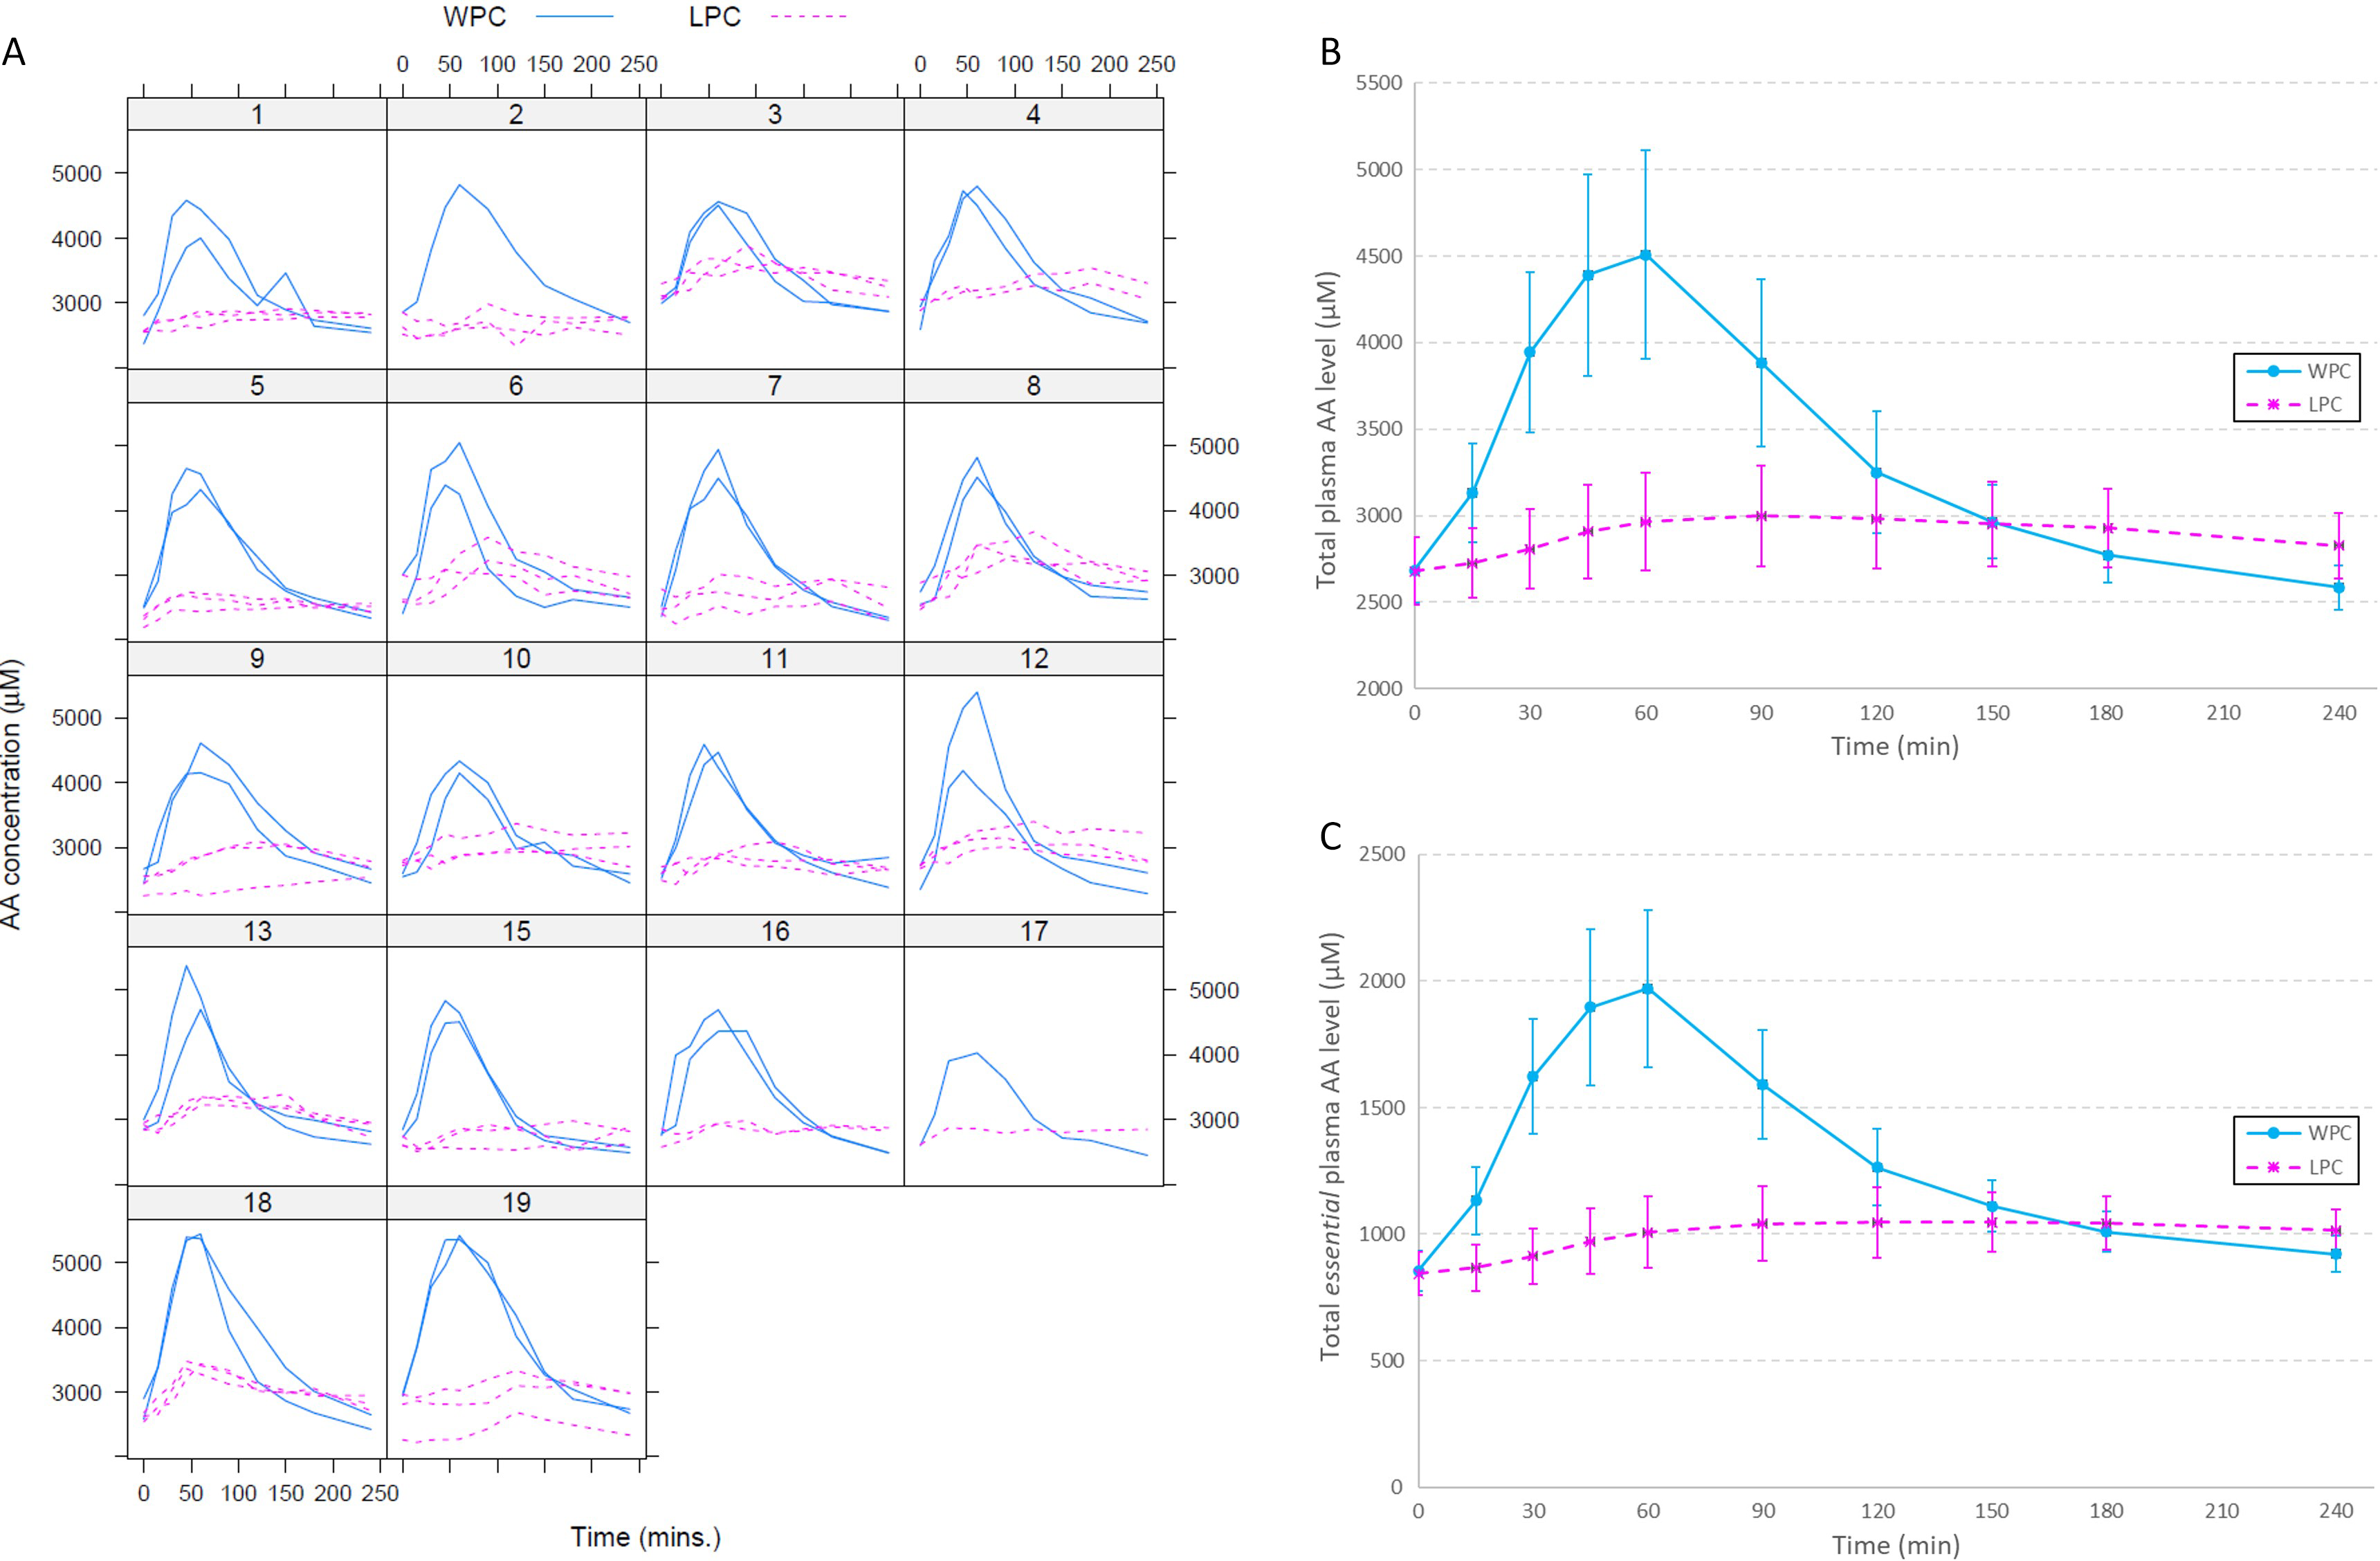
A 20 g protein was provided for both sources based on N content and commonly used N-conversion factors. However, considering the sum of the AA content of the provided products, TAA intake was 9·1 % lower and TEAA intake was 15·4 % lower for LPC than for WPC. Individual postprandial plasma kinetics for TAA is depicted in Figure 2(a). As an illustration, the average postprandial AA kinetics for TAA and TEAA after WPC and LPC consumption are shown in Figure 2(b) and (c). As anticipated, WPC resulted in much higher plasma concentrations of TAA and TEAA in all individuals compared with LPC; however, plasma TAA and TEAA concentrations seemed to stay higher for LPC than for WPC during the final hour (180–240 min, Figure 2(b) and (c)). Postprandial AUC for each individual AA, TAA and TEAA, as well as the other PoI Height and Time2Max, can be found in online Supplementary Table S2 and Figure S1. On average, the LPC:WPC ratio of the AUC for TAA and TEAA was 0·38 and 0·53, respectively (online Supplementary Table S2). This confirms that LPC is a moderately digestible plant protein source with a low postprandial AA profile.
Postprandial AA kinetics. Blue solid lines are WPC; purple dotted lines are LPC. Left panel (a): Postprandial total plasma AA concentration (TAA) for each subject and each trial. The upper right panel (b) average TAA and the lower right panel (c) average TEAA level for WPC and LPC for the total study population. Panel B and C give the mean and standard deviation of the total study population considering the average concentration of each individual. AA, amino acid; WPC, whey protein concentrate; LPC, lucerne protein concentrate; TAA, total amino acids; TEAA, total essential amino acids.

Between- and within-person variability
Clear differences both between and within individuals are already visually perceptible from Figure 2(a). Fasting plasma TAA concentrations vary between individuals (e.g. subject 3 v. 5) and within individuals (e.g. for 6 and 19). Some individuals show high peaks for WPC (subjects 12, 13, 18 and 19), while others have relative high values for LPC (subjects 3, 16 and 17). Finally, a quite reproducible response for a single protein source can be seen in some subjects (e.g. subjects 13 and 16) but not in others (e.g. subjects 6 and 9 for LPC and subject 12 for WPC).
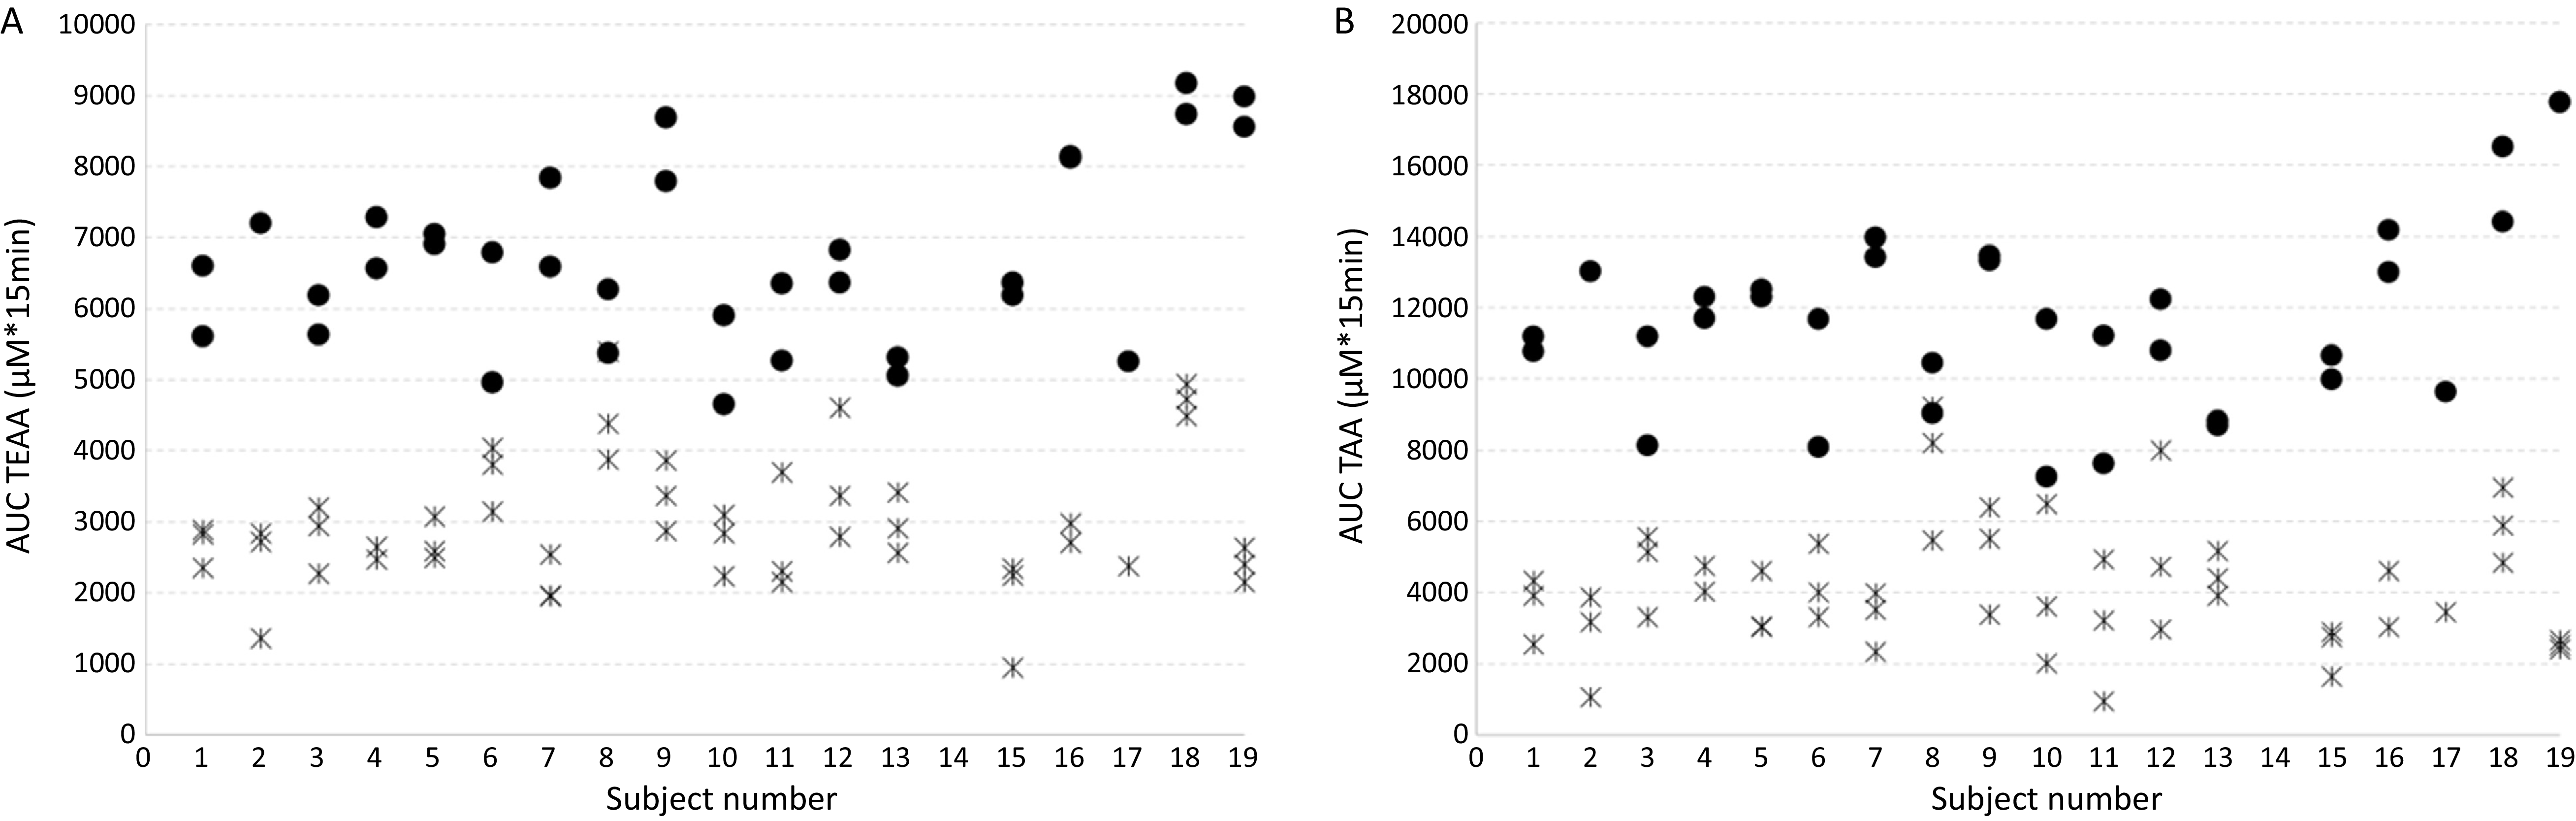
Translation of the plasma curves to a fitted AUC of TAA and TEAA per participant per trial is given in Figure 3. This figure illustrates again the between- and within-participant variation. By visual inspection, most individuals show a rather consistent response per protein source (e.g. subject 1, 4, 7, 13, 15 and 19), as the responses of the repeated tests are close to each other. While some others show a large day-to-day variability (e.g. subject 10, 11, 12). Between individuals, the level of the responses (AUC) differs quite substantially (e.g. subject 13 v. subject 18). Comparing individual test days, the highest and the lowest TAA AUC differed largely: close to 18·000 µM × 15 min (sub 19) v. just below 8·000 µM × 15 min (subject 10) for WPC; and from about 9·000 µM × 15 min (subject 8) to about 1·000 µM × 15 min (subject 11) for LPC (Figure 3).
Baseline AA concentration-corrected AUC for (a) TAA and (b) TEAA per subject per trial, for WPC (filled dots) and LPC (open crosses). The figure illustrates the within- and between-participant variation. Most individuals show a rather consistent response per protein source (e.g. subject 1, 4, 7, 13, 15 and 19), as the responses of the repeated tests for each source, either the dots or the crosses, are close to each other. While other subjects show a large day-to-day variability, for example, subject 10, 11 and 12. Between individuals, the level of the responses (AUC) differs quite substantially, for example, subject 13 v. subject 18. AA, amino acid; TAA, total amino acids; TEAA, total essential amino acids; WPC, whey protein concentrate; LPC, lucerne protein concentrate.

The average TAA AUC for each participant, without and with correction for estimated BV, is depicted in online Supplementary Figure S2. Between-subject variation is substantial as can be seen from the difference between the highest and the lowest average value, and this variation turned out to be significant (P < 0·05). The difference between the highest and the lowest average AUC was 2·03 and 1·74 times for WPC, without and with correction for BV, and 3·14 and 3·47 for LPC (2·42 and 2·43 when subject 8 was not considered).
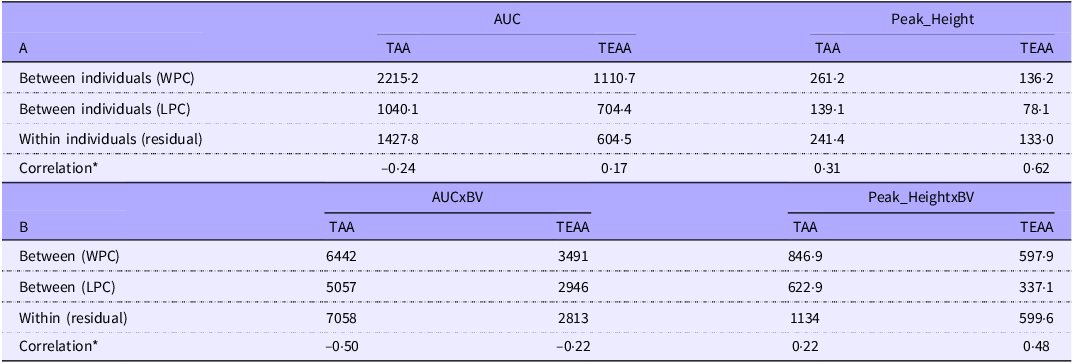
To further quantify the between- and within-person variation, the mixed-model variance components were assessed (i.e. σ2 between and σ2 within). These are the estimates for the within-person variability, given by the residual variance, and the between-person variability. To keep the numbers on the same scale as the original PoI estimates, standard deviations rather than variances were reported. Note that the within-person variability is taken to be the same for both protein sources. In the WPC condition, for both TAA and TEAA, the between-person variability in AUC (sd) was higher than the within-person variability (Table 2A). For LPC, the between-person variability was smaller than the within-person variability for TAA, while for TEAA between-person variability was larger. For Height, a slightly different picture emerged, where WPC showed variance components that were of roughly the same magnitude and LPC resulted in a smaller between-person variation than within-person variation (Table 2A). In addition, the between-person CV (%) was also calculated (online Supplementary Table S2), which was 23 % v. 19 % for AUC TAA and 53 % and 34 % for TEAA, for LPC and WPC, respectively. Thus, absolute between-person variation (i.e. sd from the mixed-model variance components) was highest for WPC due to its higher absolute values, while relative variation (CV%) was higher for LPC due to the low AUC values.
Between- and within-individual variation: variance components of the models presented as standard deviations for AUC and height (Table A), considering estimated blood volume (BV) expressed as the product of AUC or height and blood volume (Table B). The within-individual variation is identical for both interventions

Table 2. Long description
Panel A: A table with four rows and four columns comparing variance components of models for AUC and height. The columns are labeled TAA AUC, TEAA AUC, TAA Peak_Height, and TEAA Peak_Height. The rows are labeled Between individuals (WPC), Between individuals (LPC), Within individuals (residual), and Correlation. Values are provided for each intersection. Panel B: A table with four rows and four columns comparing variance components of models for AUC and height considering blood volume. The columns are labeled TAA AUCxBV, TEAA AUCxBV, TAA Peak_HeightxBV, and TEAA Peak_HeightxBV. The rows are labeled Between (WPC), Between (LPC), Within (residual), and Correlation. Values are provided for each intersection.
TAA, total amino acids; TEAA, total essential amino acids; WPC, whey protein concentrate; LPC, lucerne protein concentrate.
* Correlation between the responses of the two interventions.
When refitting the mixed models taking BV into account, a lower value of the between-person variation (the random effect) was seen in comparison to the within-person variation (residual sd) for TAA for both WPC and LPC (Table 2B); for TEAA, the between-person variation was somewhat higher than the within-person variation for WPC and LPC. For Height, between-person variation was also smaller than the within-person variation for TAA, while for TEAA between-person variation equalled within-person variation for WPC and was lower for LPC.
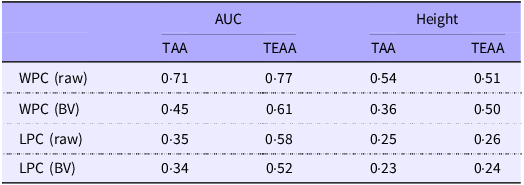
In a final step, the ICC was calculated (i.e. σ2 between/(σ2 between + σ2 within)), with and without taking estimated BV into account (Table 3). The ICC gives the fraction of the total variance related to the between-person variance. The ICC is fairly high for AUC for WPC (0·71 and 0·77 for TAA and TEAA, respectively), indicating that a large fraction of the variance is explained by differences between people. The ICC for AUC LPC were lower, in particular for TAA (0·35); for TEAA, it was moderate to high (0·58), indicating that over half of the variance is explained by the difference between participants. ICC values for the PoI Height were lower for both WPC and LPC. Correcting for BV leads to lower ICC values, in particular for AUC WPC.
Intra-class correlation coefficients (ICC) for the PoI AUC and Height for TAA and TEAA, without (raw) and with correction for blood volume (BV)

Table 3. Long description
The table presents intra-class correlation coefficients (ICC) for the Area Under Curve (AUC) and Height for Total Absorbed Activity (TAA) and Total Effective Activity (TEAA), both without (raw) and with correction for blood volume (BV). The table has four rows and four columns. The columns are labeled AUC TAA, AUC TEAA, Height TAA, and Height TEAA. The rows are labeled WPC (raw), WPC (BV), LPC (raw), and LPC (BV). Row 1: WPC (raw), AUC TAA 0.71, AUC TEAA 0.77, Height TAA 0.54, Height TEAA 0.51. Row 2: WPC (BV), AUC TAA 0.45, AUC TEAA 0.61, Height TAA 0.36, Height TEAA 0.50. Row 3: LPC (raw), AUC TAA 0.35, AUC TEAA 0.58, Height TAA 0.25, Height TEAA 0.26. Row 4: LPC (BV), AUC TAA 0.34, AUC TEAA 0.52, Height TAA 0.23, Height TEAA 0.24.
PoI, parameters of interest; TAA, total amino acids; TEAA, total essential amino acids; WPC, whey protein concentrate; LPC, lucerne protein concentrate.
Overall, taking differences in estimated BV into consideration reduced variation between individuals as compared with within-participant variation, making in general the within-person variation the larger fraction (i.e. ICC < 0·5) of the total variation for TAA, not for TEAA.
Consistent postprandial response
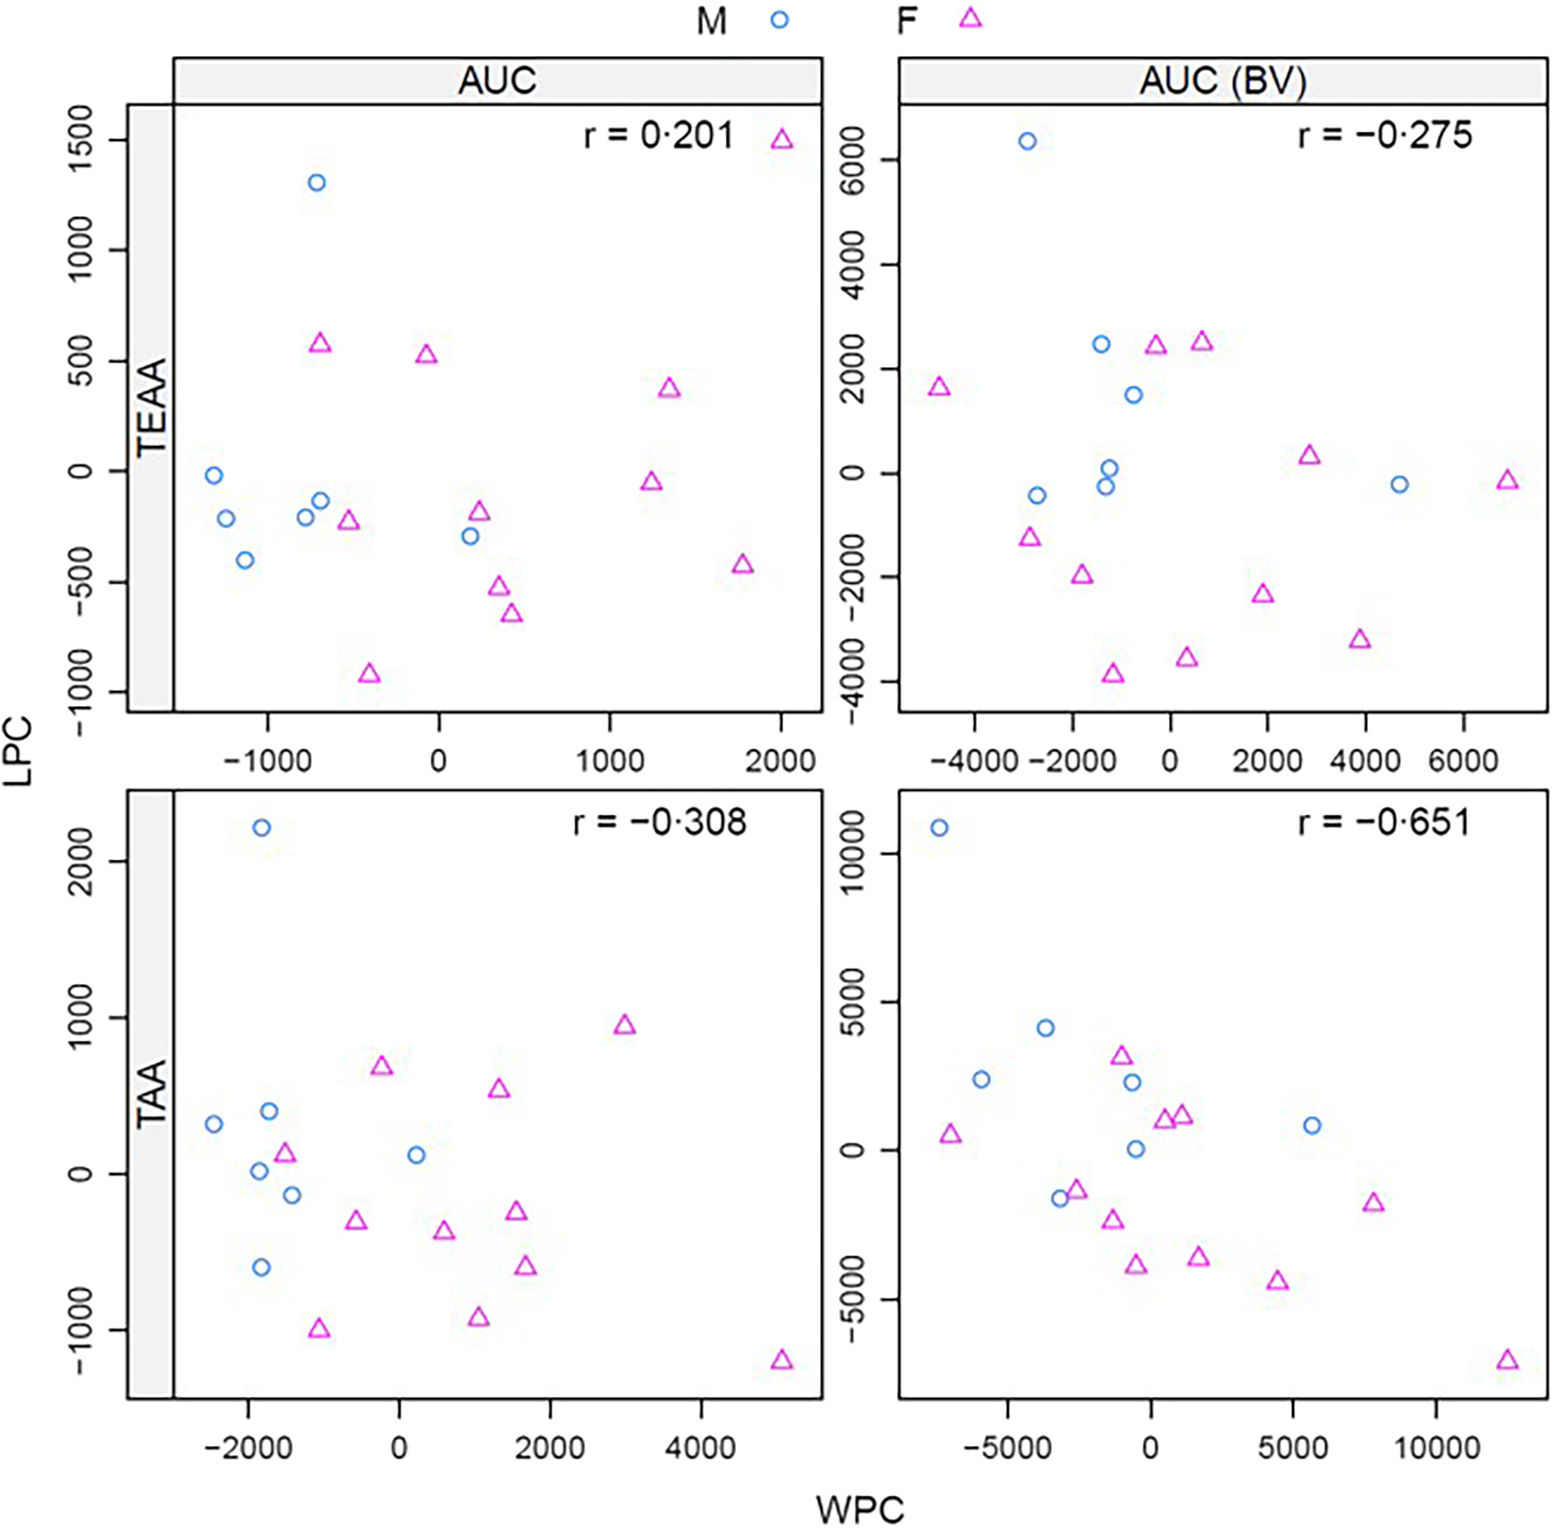
Next, we questioned whether the postprandial response was consistent across protein sources, that is, are those individuals with a high AUC on WPC also those with a high AUC for LPC? In online Supplementary Figure 2, AUC and AUC after considering BV are depicted for TAA for WPC and LPC, ordered from the lowest to the highest average individual response (panes A and B). In addition, both conditions were plotted against each other (panels C). Consistency, as can be roughly inferred from this figure, was generally low. For instance, subject 19 exhibited the highest AUC for WPC but one of the lowest AUC values for LPC. In contrast, subject 8 displayed the highest AUC for the LPC condition, with moderately low values for WPC. Taking BV into consideration did change the order of the individuals. In particular, females (with lower BV) and males were much more mixed for TAA after BV correction, but the overall magnitude of the difference between the subject with the highest and the lowest response was not much affected. In addition, Figure 4 displays the predicted random effects for each participant in the two interventions, plotted for LPC (intervention B) against WPC (intervention A), for AUC and the BV-corrected AUC. Very similar plots would be obtained by plotting the average AUC or Height values per condition for each participant. Correlation coefficients were low (0·2–0·3) except for TAA AUC (BV), but note that the correlation for TAA AUC (BV) is heavily influenced by the two extreme points. The main conclusion is that there is virtually no relation between the responses on the two different protein sources. Moreover, the between-person variability seems to be protein source-specific.
Correlation of random-effect estimates per participant for AUC (left panels) and AUC corrected for blood volume (right panels) for TEAA (top) and TAA (bottom). Intervention A = WPC, B = LPC. Males are in blue circles, while females are in pink triangles. Pearson’s correlation coefficients are shown at the top of each panel. TEAA, total essential amino acids; TAA, total amino acids; WPC, whey protein concentrate; LPC, lucerne protein concentrate.

Discussion
In this study, the aim was to quantify the variation in postprandial AA kinetics between and within individuals after consumption of a moderately digestible plant protein source (LPC) and an easily digestible animal protein source (WPC). WPC and LPC showed a clear difference in postprandial plasma AA kinetics. This aligns with the assumption that LPC is a moderately digestible protein source, whereas WPC is a good digestible and available protein source. WPC gave a quick and high response, whereas LPC gave a low and modest increase over a prolonged time. Substantial both between- and within-individuals variation was observed, with the between-person variation of the postprandial response (i.e. AUC) being larger than the within-person variation for WPC TAA and TEAA and for LPC TEAA. However, when taking estimated BV into account, the between-person variation was reduced. The within-person variability became larger than the between-person variability for TAA, not TEAA, as also reflected in ICC’s below 0·5. Finally, those with high AUC on one protein source were not necessarily those with a high AUC on the other source.
After ingestion of an isonitrogenous amount of protein, WPC resulted in a much larger and higher postprandial EAA response compared with LPC. Postprandial aminoacidemia, described by the AUC and maximum concentration (Height) of blood AA, is an important aspect of the anabolic property of dietary protein(Reference Gwin, Church and Wolfe1). Hence, the postprandial AA response after ingestion of a protein supplement or a protein meal is frequently used to characterise a protein source and/or to compare different proteins(Reference Detzel, Petschow and Johnson13–Reference Vangsoe, Thogersen and Bertram18). This response is a result of many factors, including digestion and absorption kinetics, splanchnic area AA extraction and de- and transamination, and body protein synthesis and breakdown rates(Reference Fouillet, Juillet and Gaudichon19,Reference Trommelen, Tomé and van Loon20) . However, it can be assumed that in healthy individuals, changes in dietary uptake will be reflected in increased plasma (E)AA concentration, although these may still vary depending on variation in body protein breakdown, enteral uptake and splanchnic metabolism(Reference Liebau, Király and Olsson21).
When expressing the AUC of TAA or TEAA of LPC relative to the one of WPC, a ratio of 0·38 and 0·53 was obtained in the present study. This makes LPC scoring moderate to poor as compared with similar scores obtained from previously published studies using a similar approach (as published in the paper of Mes et al. (Reference Mes, Esser and Oosterink7) and unpublished own observations). Such a ‘plasma score’ incorporates both the AA content of a protein source and its digestibility, absorption and bioavailability and allows comparison of results from independent studies mutually when setting whey for each study on 1. Such a score can be calculated for total (E)AA, as we did, but also for crucial individual AA, like leucine or lysine. It allows the comparison of protein sources across literature. Comparing to such a reference protein like whey could serve as a measure for the quality of a protein source, next to the traditional digestibility-corrected AA scores, that is, DIAAS and PDCAAS(22).
The aim, however, was to measure variability of postprandial AA kinetics, not the difference in AA kinetics between LPC and WPC. The postprandial AA response did differ quite a bit between individuals after ingesting the same amount of protein. A substantial variation between individuals for both WPC and LPC was observed. The absolute variation was higher for WPC due to the much higher postprandial response of whey compared with a low response for LPC. When expressed as relative variation (CV), it was larger for LPC compared with whey: 53 v. 23 % for TAA LPC and WPC, respectively. Although we intended to provide a similar amount of protein based on N content, AA analyses revealed that TAA intake was about 10 % lower for the LPC. The lower postprandial hyperaminoacidemia as a consequence of atoo low intake for the LPC condition can have implications for the variability. A lower level of AA could lead to an underestimation of absolute variability and overestimation of relative variability for LPC. However, our results reflect what we observed previously when measuring postprandial plasma AA profiles from an easily digestible protein (also whey) and a less digestible protein source (water lentil)(Reference Mes, Esser and Oosterink7). In that study, the CV of the AUC of TAA was 24·7 % for the whey condition, while it was 35·6 % for water lentils(Reference Mes, Esser and Oosterink7). Thus, in both of our studies, the between-person variation in postprandial AA response was relatively larger for a less digestible protein with a lower level of postprandial aminoacidemia.
A poorer digestion of plant proteins could be a cause of the larger variation between (and within) individuals with LPC. Animal-derived proteins are relatively easy to digest compared with plant proteins. Whey is known for its high digestibility(Reference Dupont, Tome, Boland, Singh and Thompson23,Reference van der Wielen, de Vries and Gerrits24) . Lucerne (alfalfa), on the other hand, has lower digestibility, with an N digestibility of about 40 % reported in growing pig(25) and about 75 % in a rat assay(Reference Stodkilde, Damborg and Jorgensen26). Differences in tertiary structural integrity, modifications like glycosylation and phosphorylation as well as the presence of anti-nutritional factors like protease inhibitors, tannins, phytic acid and saponins can limit plant protein digestion(Reference Boutrou, Coirre and Jardin2–Reference Dupont, Mandalari and Mollé4).
When taking estimated BV into consideration, between-person variability was reduced relative to within-person variation. This indicates that part of the variation between individuals can likely be explained by differences in circulating volume due to differences in body size, in particular as an absolute amount of protein was provided and not relative to body weight. But the between-person variation was still substantial as reflected by the about 1·9 times difference between the subject with the highest and the lowest postprandial response of TAA after ingesting a similar amount of whey protein. For LPC, this difference was even higher (about 3·3 times). It would, however, be interesting to measure between-person variability when given a protein dose relative to body weight.
The postprandial response is a result of many factors, including dietary uptake and splanchnic metabolism and portal vein dynamics. The liver can catabolise AA and could partly use AA for gluconeogenesis to produce glucose. Therefore, the postprandial change in blood AA profile does not reflect 100 % of the AA composition and absorption in the test product. We previously compared the increase in blood AA and test product AA composition which showed to have a high correlation (r 0·8 for WPC(Reference Mes, Esser and Oosterink7)). Especially, the BCAA valine was found to be relatively higher in blood compared with its presence in the source and therefore could be a result of liver synthesis as part of the postprandial increase of AA in the portal vein and liver. Also, tryptophan was slightly higher and phenylalanine relatively under-represented in blood compared with the applied protein source.
However, in general, changes in dietary uptake will be reflected in the postprandial AA response. The bioavailability of AA from dietary protein depends on chewing, saliva and gastric fluid composition, the concentration and activity of luminal proteases, brush border peptidases, luminal pH, transit time and intestinal function as well as the activity of the peptide and AA transporters due to, for example, polymorphisms, modulating AA absorption(Reference Walther, Lett and Bordoni6,Reference Dallas, Sanctuary and Qu27) . These aspects can vary between individuals due to genetics and physiological differences and across conditions like a disease, resulting in variations in proteolytic capacity and hence underlying differences in postprandial (E)AA responses. Compared with healthy controls, the postprandial rise of EAA after bolus tube feeding was blunted in critically ill patients(Reference van Gassel, van de Poll and Schaap28). Along the same line, older adults demonstrated about 10 % lower uptake of AA after protein ingestion compared with younger individuals(Reference Gorissen, Trommelen and Kouw29). Another study did however not observe a difference in postprandial EAA bioavailability in young v. older adults consuming an equal amount of protein food(Reference Connolly, Hudson and Bergia30). Kashyap et al. (Reference Kashyap, Shivakumar and Varkey31) observed, using an in vivo digestibility assay, that leucine digestibility was inversely correlated with a marker of intestinal function (plasma kynurenine:tryptophan ratio). Although, a more recent study from the same group did not find a difference in systemic IAA availability between children with and without a compromised intestinal function(Reference Shivakumar, Kashyap and Jahoor32). Thus, an individual’s (gut) health, but also ageing(Reference Lee, Jo and Jeong33,Reference Menard, Lesmes and Shani-Levi34) , could be a factor that can affect dietary protein bioavailability and likely its subsequent anabolic response. Our study population consisted of young, healthy male and female individuals, so variability is expected to be even larger in a more diverse or diseased population. Moreover, the degree of variability could be different for different protein sources.
Another interesting observation was that the between-person variation could not be explained by the fact whether someone has a generally high or low response, as no correlation between the postprandial AA response of the two protein sources was observed. Those with a high AUC for one protein source were not necessarily those with the high AUC for the other protein source. Adaptation to or familiarity with a protein source or specific diet could be a factor. For example, the pancreatic juice from pigs adapted to a casein diet (14 d) was more effective in in vitro digestion of both casein and rapeseed than pancreatic juice from pigs adapted to a rapeseed diet(Reference Valette, Malouin and Corring35). Along the same line, a shift in dietary macronutrient composition resulted in changes in interdigestive and postprandial pancreatic secretion(Reference Boivin, Lanspa and Zinsmeister36), suggesting gastrointestinal adaptation as a consequence of dietary intake. It would be interesting to know, for example, whether vegans are better able to digest plant protein compared with those on an omnivorous diet and vice versa. Our study was not designed and too small to address these types of questions. But in future trials, it will be interesting to include a source adaptation strategy before performing these postprandial response trials.
Next to between-person variability, within-person variability was also measured by providing the same intervention on multiple occasions: three times for LPC and two times for WPC. The within-person variability was of comparable magnitude or even larger than the between-person variability after taking estimated BV into account. So, a postprandial AA response after exactly the same drink can substantially differ from day to day. This is also observed for even a simple ‘meal’ like an OGTT (oral glucose tolerance test), which is known to give different responses when repeated on multiple occasions(Reference Mensink, Feskens and Kruijshoop37), and hence, an OGTT should be performed on two separate occasions to establish the diagnosis of diabetes(Reference Eyth, Basit and Swift38). Controlling external factors that could affect a postprandial response like duration of the fasting period, time of the day, meal and diet composition and the level of physical activity in the final day(s) preceding the experimental day is important. Although a standardised approach was followed, a more extended standardised adaptation period could have been considered. For example, digestibility of a protein source is only determined after a week of adaptation to the protein source in the classical pig assay(Reference Hodgkinson, Stein and de Vries39). And also for an OGTT, consuming an unrestricted diet containing at least 150 g of carbohydrates for the final 3 d before the test is advised to improve reproducibility(Reference Eyth, Basit and Swift38). As lucerne is not a regular protein source in the human diet, unfamiliarity with this protein source could have been one of the multiple factors underlying the observed variability in the postprandial response.
Both our previous study(Reference Mes, Esser and Oosterink7) and the present study suggest that a moderately digestible protein source might result in relatively larger bioavailability variation between persons, that is, larger CV%. As some proteins are harder to digest due to differences in food matrix, as a consequence of processing or due to the presence of anti-nutritional factors, one can imagine that differences in an individual’s capacity to digest and absorb proteins are more variable for those sources. Indeed, as reviewed in Walther et al. (Reference Walther, Lett and Bordoni6), inter-individual (‘between person’) variability in protein digestibility was low for easily digestible protein but much higher for those with the lowest digestibility. Such a larger individual difference in digestive capacity of low-digestible proteins could be relevant in the light of the protein transition, with the introduction of more processed alternative protein sources in our diet. Next to other factors, this has to be taken into account when contemplating a shift to less animal foods (and proteins), as this could not be the best option for every individual to reach requirements.
Our study has a few limitations. When comparing the average AUC of TAA or TEAA of WPC with LPC, the provided TAA of both products are considered. While total protein was matched based on N (with a conversion factor of 6·19 and 6·38 for LPC and WPC), this could have been performed based on matching TAA, or applying a more appropriate nitrogen conversion factor for LPC of 5·61 as recently proposed(Reference Alhotan, Pesti and Billard40). LPC intake should then have been increased by about 9·4 % to better match the amount of WPC as provided in our study. This would have partly gapped the differences in AUC between sources but still would indicate LPC as a moderate digestible source compared with WPC.
In addition, our study had a small sample size, with a very homogenous population. This limited doing separate analysis for sex or including factors such as age or BMI in our model. The primary goal of our study was to establish whether there was sizeable between-person variation compared with within-person variation. For the purpose of finding possible explanatory variables for this variation, a larger sample and other sampling method (design) would be needed, for example, separate representative samples per sex and enough spread in BMI. However, our analysis with estimated BV did take the impact of some of these factors, that is, sex, weight and height, on the variation in postprandial response into account. Finally, we acknowledge that our blinding procedure for the test product will not have been fully successful as participants will have sensed differences between WPC and LPC with regard to taste and mouth feel.
In conclusion, AA kinetics (i.e. AUC) after ingestion of 20 g protein showed significant variation between individuals, as well as within individuals, both for a good (i.e. whey) and a moderately digestible protein (i.e. lucerne). Moreover, those individuals with a high TAA AUC for one protein source were not necessarily those with a high AUC for the other protein source. It would be of interest to gain more insights on the specificity of between-person variation in relation to protein source, and we encourage other researchers to report this information when performing similar postprandial protein cross-over trials when comparing different protein sources. Future research should shed more light on the underlying factors for this variability, as insights in this variation are warranted to support future optimised protein intake advice to prevent deficiency, especially if a great variety of protein sources, including those that are harder to digest, are going to be consumed. In addition, our study shows that a single postprandial AA response at the individual level should be interpreted with caution.
Supplementary material
For supplementary material/s referred to in this article, please visit https://doi.org/10.1017/S0007114526108010
Acknowledgements
The authors like to acknowledge Els Oosterink, Dianne Somhorst and the rest of the study team for their contribution to running the trial and doing the sample analysis.
The project was financially supported by Wageningen University & Research Protein Transition Investment Theme (directed call 2021).
M. M.: Conceptualisation-Equal, Data curation-Equal, Formal analysis-Equal, Methodology-Equal, Writing – original draft-Lead; M. U.: Investigation-Equal, Writing – review and editing-Supporting; R. W.: Data curation-Lead, Formal analysis-Lead, Methodology-Equal, Writing – review and editing-Equal; J. E.: Data curation-Equal, Formal analysis-Equal, Writing – review and editing-Equal; N. v. d. W.: Conceptualisation-Equal, Methodology-Equal, Supervision-Equal, Writing – review and editing-Equal; D. E.: Conceptualisation-Equal, Funding acquisition-Lead, Investigation-Lead, Supervision-Equal, Writing – review and editing-Equal; J. J. M.: Conceptualisation-Lead, Funding acquisition-Lead, Investigation-Equal, Methodology-Equal, Supervision-Equal, Writing – review and editing-Equal; all authors approved the final version of the manuscript.
There are no conflicts of interest.
Data are available upon request.
Open access funding provided by Wageningen University & Research.


 Open access

