1 Introduction
In inductively coupled helicon discharges (Yun, Kim & Chang Reference Yun, Kim and Chang1998), an ion beam can, in certain parameter regimes, form spontaneously at the intersection between the plasma source and the expansion chamber (Charles Reference Charles2004; Charles & Boswell Reference Charles and Boswell2004; Corr et al. Reference Corr, Zanger, Boswell and Charles2007; Virko et al. Reference Virko, Virko, Shamrai and Yakimenko2007; Byhring et al. Reference Byhring, Charles, Fredriksen and Boswell2008). For this reason, these sources have for some time been studied for the purpose of developing ion thrusters for spacecraft (Charles Reference Charles2009). The geometry in which the plasma expands from the source into the diffusion chamber plays an important role in shaping the sharp potential drop, a so-called current-free double layer (CFDL), which is commonly observed to form an ion beam in helicon device (Charles Reference Charles2004; Virko et al. Reference Virko, Virko, Shamrai and Yakimenko2007). A main part of this geometry is the magnetic field. Typically, helicon sources are operated with an axial magnetic field produced with DC current coils around a cylindrical source chamber, with field lines expanding from the source into the diffusion chamber (Charles Reference Charles2007). The expanding field lines are effectively guiding the electrons radially outwards, while ions with a much larger Larmor radius have been found to detach at approximately 51 cm (Gulbrandsen et al. Reference Gulbrandsen, Fredriksen, Carr and Scime2015). This radial charge separation sets up electric fields which tend to diverge the ion beam and hence deteriorate the thrust.
For thruster applications, a substantial amount of work has been carried out in order to understand the physical mechanisms of plasma expansion from a so-called magnetic nozzle towards a lower magnetic field and detachment (Schoenberg et al. Reference Schoenberg, Gerwin, Henins, Mayo, Scheuer and Wurden1993; Cohen et al. Reference Cohen, Sun, Ferraro, Scime, Miah, Stange, Siefert and Boivin2006; Olsen et al. Reference Olsen, Ballenger, Carter, Diaz, Giambusso, Glover, Ilin, Squire, Longmier and Bering2015; Takahashi & Ando Reference Takahashi and Ando2017). Magnetic nozzles are sometimes referred to as the plasma propulsion analogue to Laval nozzles for combustion-type propulsion (Ebersohn et al. Reference Ebersohn, Sheehan, Longmier and Shebalin2014). Instead of the walls in the Laval nozzle guiding the expelled matter, the magnetic nozzle guides the charged plasma particles along the magnetic field lines.
As coils along with their power supplies are heavy and bulky and thus not desirable for lightweight spacecraft payloads, permanent magnets (PMs) have been investigated as an option to provide the necessary field geometry (Chen Reference Chen2008; Takahashi et al. Reference Takahashi, Oguni, Yamada and Fujiwara2008, Reference Takahashi, Shida, Fujiwara and Oguni2009). The use of magnetic dipoles in the form of PMs along the wall of a plasma chamber has in many cases been applied as a method of confinement. Earlier experiments involving PMs in a multipole configuration have investigated their feasibility for plasma confinement and effects on low-pressure plasmas (Ohkawa & Kerst Reference Ohkawa and Kerst1961). Leung et al. (Reference Leung, Collier, Marshall, Gallaher, Ingham, Kribel and Taylor1978) discovered that the plasma confinement depends strongly on the geometry of a multipole, affecting electrons the most. Electrons with energies higher than the potential drop in the sheath are more efficiently confined, and can be used as an ionisation source for a discharge if the mean free path of these electrons is large compared to the discharge size. Also, the plasma confinement has been improved, both in radial plasma uniformity and in low-temperature bulk plasma in a discharge. Takahashi et al. (Reference Takahashi, Oguni, Yamada and Fujiwara2008), Takahashi, Shida & Fujiwara (Reference Takahashi, Shida and Fujiwara2010), Takahashi, Itoh & Fujiwara (Reference Takahashi, Itoh and Fujiwara2011) applied PMs to produce an axial magnetic field configuration in an expanding plasma and detected accelerated ions at supersonic speeds with increasing magnetic field strength. Chen (Reference Chen2012) used PMs from an axial magnetic field source for a small helicon source inside a large chamber in order to find a better antenna coupling, and it was found to produce a higher density than expected (Chen & Torreblanca Reference Chen and Torreblanca2009).
In this work we study how PMs placed around the rim of the port between the source chamber to the diffusion chamber affect the downstream plasma and ion beam. Calculations of the expanding magnetic field show that the field lines leaving the edge of the source are crossing the port wall (Fredriksen, Mishra & Byhring Reference Fredriksen, Mishra and Byhring2010). These field lines, in particular those emerging from the outer radial edge of the source, will guide the electron population at these lines towards the port wall of the chamber, causing a loss of plasma before it reaches the diffusion chamber. As most of the radio wave power is deposited in electrons close to the wall, this means that a large portion of the hottest electrons, playing an important role in the ionisation, are lost on the port wall.
By adding PMs around the outer circumference of the port, electrons are partially blocked from hitting the port walls, and are instead deflected back into the plasma stream within the diverging field. At the same time the interior of the magnetic nozzle is not significantly altered. We have investigated the ion density and ion beam properties with and without PMs around the port wall, and from these parameters the effect on the ion beam flux was calculated.
In § 2, a description of the Njord device and the applied magnetic cusp field is given. Section 3 provides a description of the data acquisition and analysis. In § 4, the results and a brief discussion are given, and the conclusions are presented in § 5.
2 Plasma device and magnetic multipole
2.1 The Njord device
The Njord device is used to study plasma flows and beam formation (Byhring et al.
Reference Byhring, Charles, Fredriksen and Boswell2008). The source chamber, made of a 30 cm long Pyrex glass cylinder with an outer radius of
 $r=6.9$
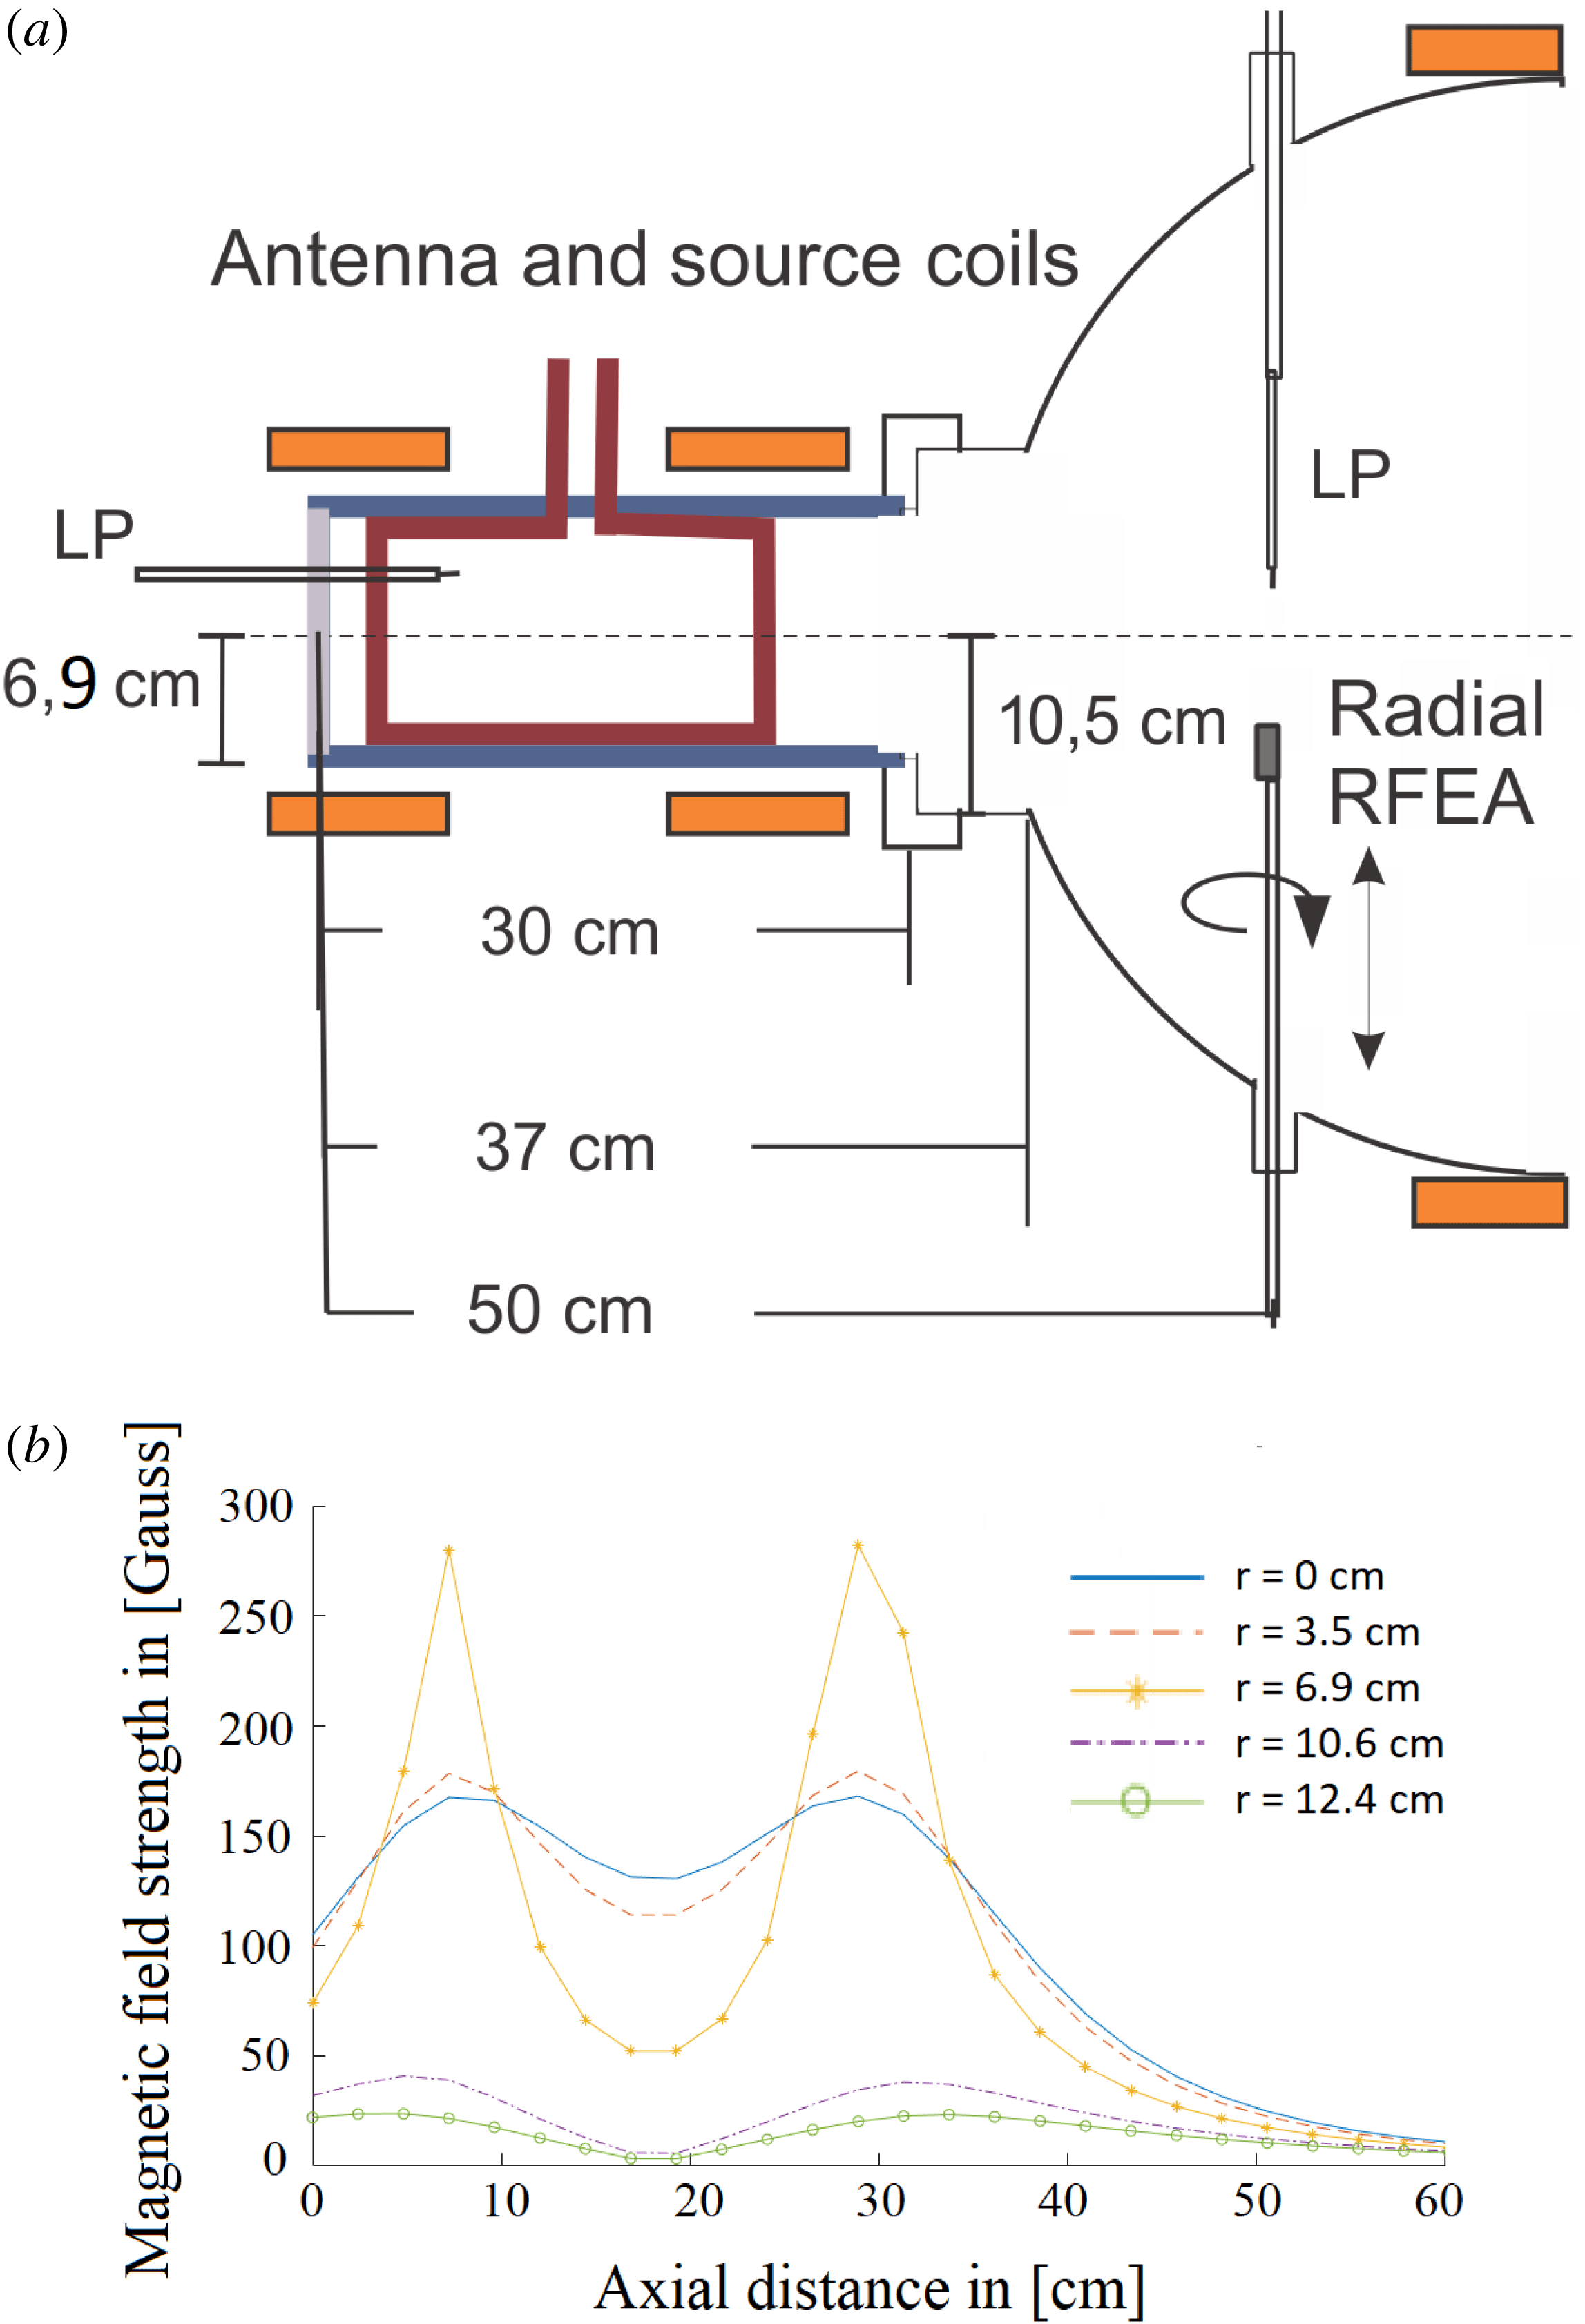
cm and encased in an equally long aluminium casing is coupled to a diffusion chamber through an extended port with a radius of 10 cm and a dome, shown in figure 1(a).
(a) An overview of the Njord device and its dimensions and (b) a simulation of the axial magnetic field strength induced by the coils at different radial values at coil current
 $I_{\text{Coils}}=5$
A, which includes the centre, the outer radius of the Pyrex tube (
 $r=6.9$
cm), the inlet chamber (
 $r=10.5$
cm) and at the position of the coils (
 $r=12.4$
cm).
The dome starts with a radius of 10 cm and ends at a 30 cm radius, coupled to the diffusion chamber. Four 40CF ConFlat ports are placed on the side of the dome where a probe through feed is inserted into the chamber in order to acquire data. The diffusion chamber has an outer radius of 30 cm and is 1.2 m long.
Argon gas is applied at the end of the source tube, which is closed by a grounded aluminium plate. The chamber can be pumped to a base pressure of
 ${\sim}10^{-3}~\unicode[STIX]{x03BC}$
Bar by a two-pump system consisting of a Boc Edwards E2M28 rotary pump and a Leybold 361C turbomolecular pump. The pressure
 $P$
was monitored by a gauge from a MKS Baratron Capacitance Manometer as it is intended for the intermediate pressure range used for plasma operation. The pressures measured by this gauge was monitored at
 $P=0.65~\unicode[STIX]{x03BC}$
Bar at flow
 $Q=2.0$
SCCM,
 $P=[0.82{-}0.85]~\unicode[STIX]{x03BC}$
Bar at
 $Q=3.0$
SCCM and
 $P=[1.0{-}1.05]~\unicode[STIX]{x03BC}$
Bar at
 $Q=4.0$
SCCM, where SCCM is the standard cubic centimeter per minute unit (
 $\text{cm}^{3}~\text{m}^{-1}$
), assuming 1 atm gas pressure and at
 $T=273$
K. At these pressures, an ion beam could be registered by a retarding field energy analyser (RFEA) probe (details of the probe will be discussed in § 3). The argon gas is ionised by applying high amplitude 13.56 MHz radio frequency (RF) waves powered by a TRUMPF Hüttinger RF generator through a helicon saddle antenna wrapped around the Pyrex glass tube. A software program made for the RF generator was used to set the forward RF-power
 $P_{In}$
in the range [100–800] W in steps of 100 W, and both
 $P_{In}$
, the reflected power
 $R_{Ref}$
and the voltage standing wave ratio (VSWR) were monitored. During operation and changes of the RF-power, pressure and coil current values, the antenna was tuned by a
 $\unicode[STIX]{x1D6F1}$
-tuning network to keep the reflected power
 $P_{Ref}$
as close as possible to a minimum (below 5 %). The axial magnetic field is applied by a set of two coils with a radius of 12 cm, length of 9.5 cm, depth layer of 2 cm and their centres placed 21 cm apart. The reference point (
 $z=0$
cm) was chosen at the back plate of the source (see figure 1
a). The two coils were placed around the source chamber and antenna. The magnetic field of the coils was calculated with a program developed in house, which has been calibrated with Hall probe measurements. The field is calculated, based on the input parameters describing the geometry, number of windings and current in the windings. At a coil current of
 $I_{\text{Coils}}=6$
A, the magnetic field strength reaches a maximum of 200 Gauss on the axis (
 $r=0$
cm) and a strength of
 ${\sim}156$
Gauss at the centre of the antenna (axial distance at 19 cm). The magnetic field strength was set in the range of
 $I_{\text{Coils}}=[0{-}6]$
A, where an increase of 1 A on both coils increases the total axial field strength of
 ${\sim}[33{-}35]$
Gauss. Calculations of the induced magnetic field strength at different radii is shown in figure 1(b). The magnetic field is calculated on a
 $30\times 30$
grid in cylindrical coordinates with a radial and axial range set at
 $[0-20]$
cm and
 $[-5-60]$
cm, respectively, which results in a radial resolution of 1.2 cm and axial resolution of 2.2 cm. Although the resolution is not very high, it illustrates the structure and the field strength of the axial magnetic field.
When the plasma expands into the diffusion chamber, the inductively coupled RF powered discharge can spontaneously set up a region within the plasma with a stationary localised potential drop, known as a current free double layer (CFDL) (Byhring et al.
Reference Byhring, Charles, Fredriksen and Boswell2008). A double layer (DL) can be described as an intersection between two local, equally oppositely charged, space charge regions within a plasma, positioned close to each other (Chen Reference Chen2014). The potential drop between the regions gives rise to an electric field
 $E$
that depends on the distance between the regions.
 $E$
is much stronger on the inside of the DL than outside, meaning that integration of all positive and negative charges nearly cancel each other. DLs can be found in a plasma where a strong flux of charge carriers is present, which is necessary for DLs to exist. There are different types of DLs with different characteristics. They can be stationary or moving, collisional or collisionless, with a current or current free. The DL of interest here is the one formed in Njord, where the dense plasma produced in the source is expanding into the diffusion chamber along with the expanding magnetic field lines. The potential drop resulting from the decrease in plasma density can accelerate the ions and form a beam of ions on the low-potential side of the DL. As this DL does not rely on external current sources, it is commonly named a CFDL.
2.2 Magnetic multipole confinement
A magnetic multipole, or a multidipole, can be described as a system which consists of a series of dipoles placed side by side and alternating in the direction of the magnetic field by changing the direction of their magnetic poles. The row of magnetic fields forms a cusp configuration where the magnetic field strength is at its maximum right on the dipole and decays exponentially away from it. This creates a cross-section which is mostly free of any magnetic fields except at the boundaries of the cross-section. This field can reduce or remove the loss of plasma, increasing the plasma confinement (Lieberman & Lichtenberg Reference Lieberman and Lichtenberg2005).
A multipole system can be described by using a Cartesian system for a row of magnets with a width
 $\unicode[STIX]{x1D6E5}$
in a straight line with distance
 $d$
between them, where
 $d>\unicode[STIX]{x1D6E5}$
(Lieberman & Lichtenberg Reference Lieberman and Lichtenberg2005). If the
 $x$
-direction represents the line where the magnets lie and the
 $y$
-direction is the direction normal to the magnets, then the magnetic field can be described in the form of
 $$\begin{eqnarray}\displaystyle \boldsymbol{B}(x,y)=A_{0}\,\boldsymbol{f}(x)~\text{e}^{-ky}, & & \displaystyle\end{eqnarray}$$
where
 $A_{0}$
is a constant,
 $\boldsymbol{f}(x)$
describes the variation of the magnetic field in the
 $x$
-direction and the last term describes an exponential decay in the
 $y$
-direction with the decay constant
 $k$
. The two terms are linearly independent of each other, and thus Maxwell’s laws for a constant magnetic field need only be applied to
 $\boldsymbol{f}$
as long as
 $y\geqslant 0$
. This means that
 $\boldsymbol{B}$
satisfies Laplace’s equation for
 $y\geqslant 0$
, which gives
 $$\begin{eqnarray}\displaystyle \boldsymbol{B}(x,y)={\displaystyle \frac{2\unicode[STIX]{x0394}B_{0}}{d}}[\sin (\unicode[STIX]{x1D6FC}x)\hat{\boldsymbol{x}}-\cos (\unicode[STIX]{x1D6FC}x)\hat{\boldsymbol{y}}]\text{e}^{-ky}, & & \displaystyle\end{eqnarray}$$
where
 $B_{0}$
is the magnetic field strength at the magnet. The coefficients
 $\unicode[STIX]{x1D6FC}$
and
 $k$
are usually determined by the boundary value conditions of the model.
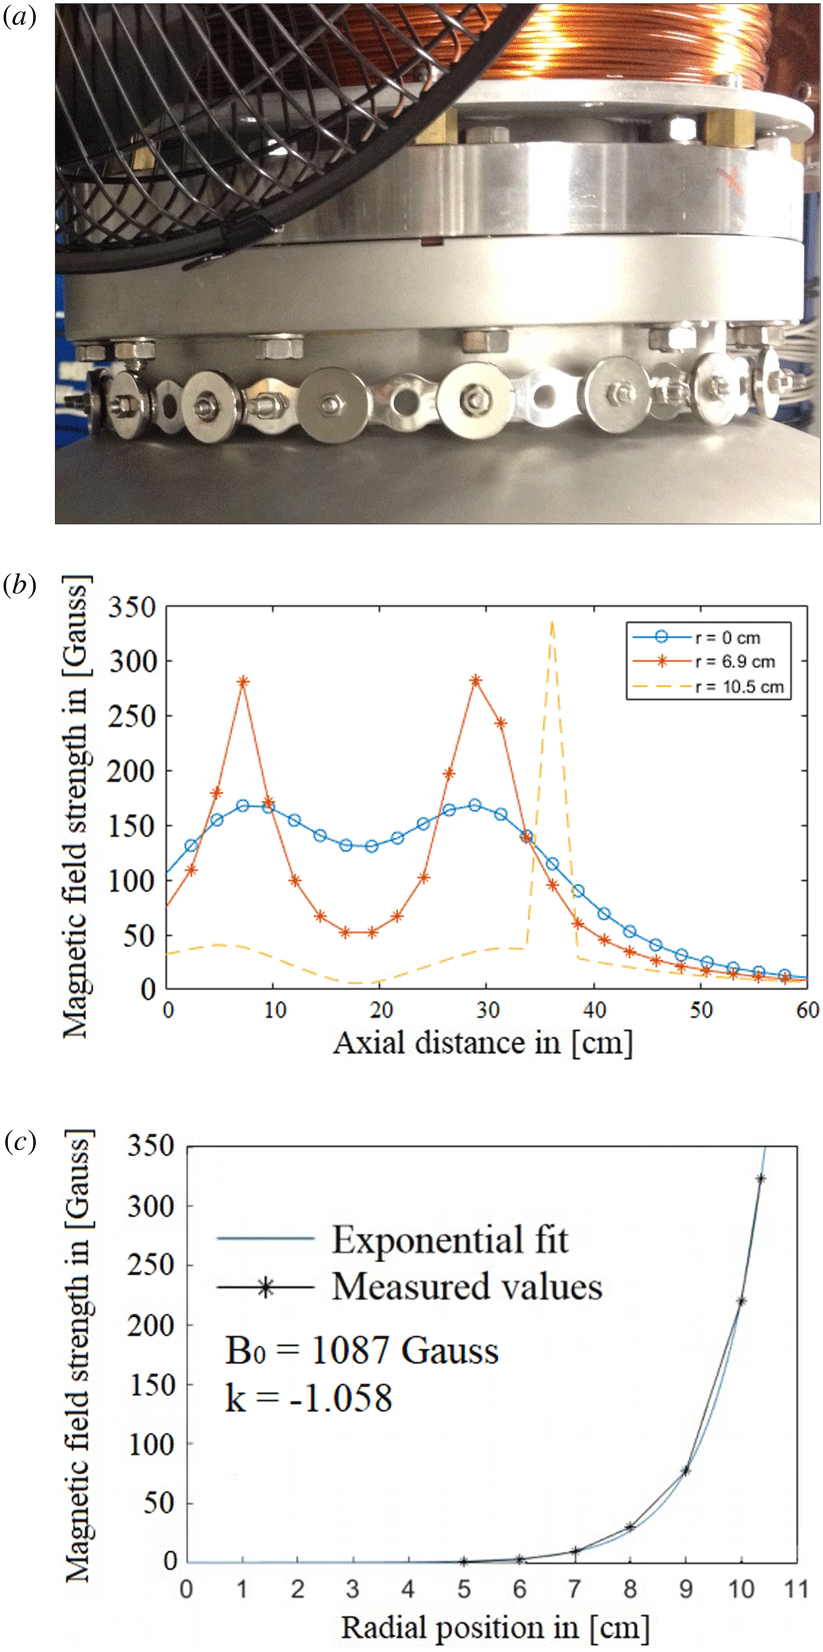
The multidipole array used on Njord consists of a 72 cm long stainless steel assembly band with 18 evenly spaced neodymium magnets (Grade N42, Ring,
 $OD=7/8$
inch,
 $ID=1/4$
inch, thickness
 $=1/8$
inch), with #8 Countersink holes, through which each magnet is fastened by stainless steel bolts to the band. It is placed around the source port of the dome at the axial position
 $z=37$
cm, 7 cm away from the exit of the source chamber (the end of the Pyrex glass tube), and with a radius
 $r=11.5$
cm. In order to retain an even distance of the cusps to the port wall, six ceramic extension pads placed every 12 cm along the inside of the band are supporting the assembly. Figure 2(a) shows the band installed on the port wall, and figure 2(b) shows a simulation of the magnetic field with the added field of the magnet band, at
 $r=10.5$
cm inside the port wall, done with the same simulation method as shown in figure 1(b). Figure 2(c) shows a simulation of the decaying magnetic field strength away from the magnet.
(a) The magnetic cusp band installed on Njord, (b) the magnetic field configuration in axial direction at
 $I_{\text{Coils}}=5$
A on each coil with the PMs on at (i) the centre of Njord (
 $r=0$
cm), (ii) the outer radius of the Pyrex tube (
 $r=6.9$
cm) and (iii) at the inner wall of the inlet port (
 $r=10.5$
cm) and (c) graph of the fitted exponential decaying magnetic field directly on the PMs at
 $z=37$
cm, where
 $r=0$
cm is on the cylindrical axis. Reference point of
 $B_{0}$
is at
 $r=11.5$
cm.

The coefficients
 $B_{0}$
and
 $k$
were found experimentally by using a gauss meter to measure the magnetic field strength both directly on the magnets and half-way between them. Six measurements at six radial positions were performed in the azimuthal direction and an average value was estimated and used in order to calculate the coefficients. They were evaluated using a first degree exponential fit in MATLAB. The results showed that directly on the PMs and perpendicular between them, the average value of the coefficients were estimated to
 $B_{0}=1087$
Gauss and
 $k=-1.058$
,
 $B_{0}=585$
Gauss and
 $k=-0.8968$
, respectively.
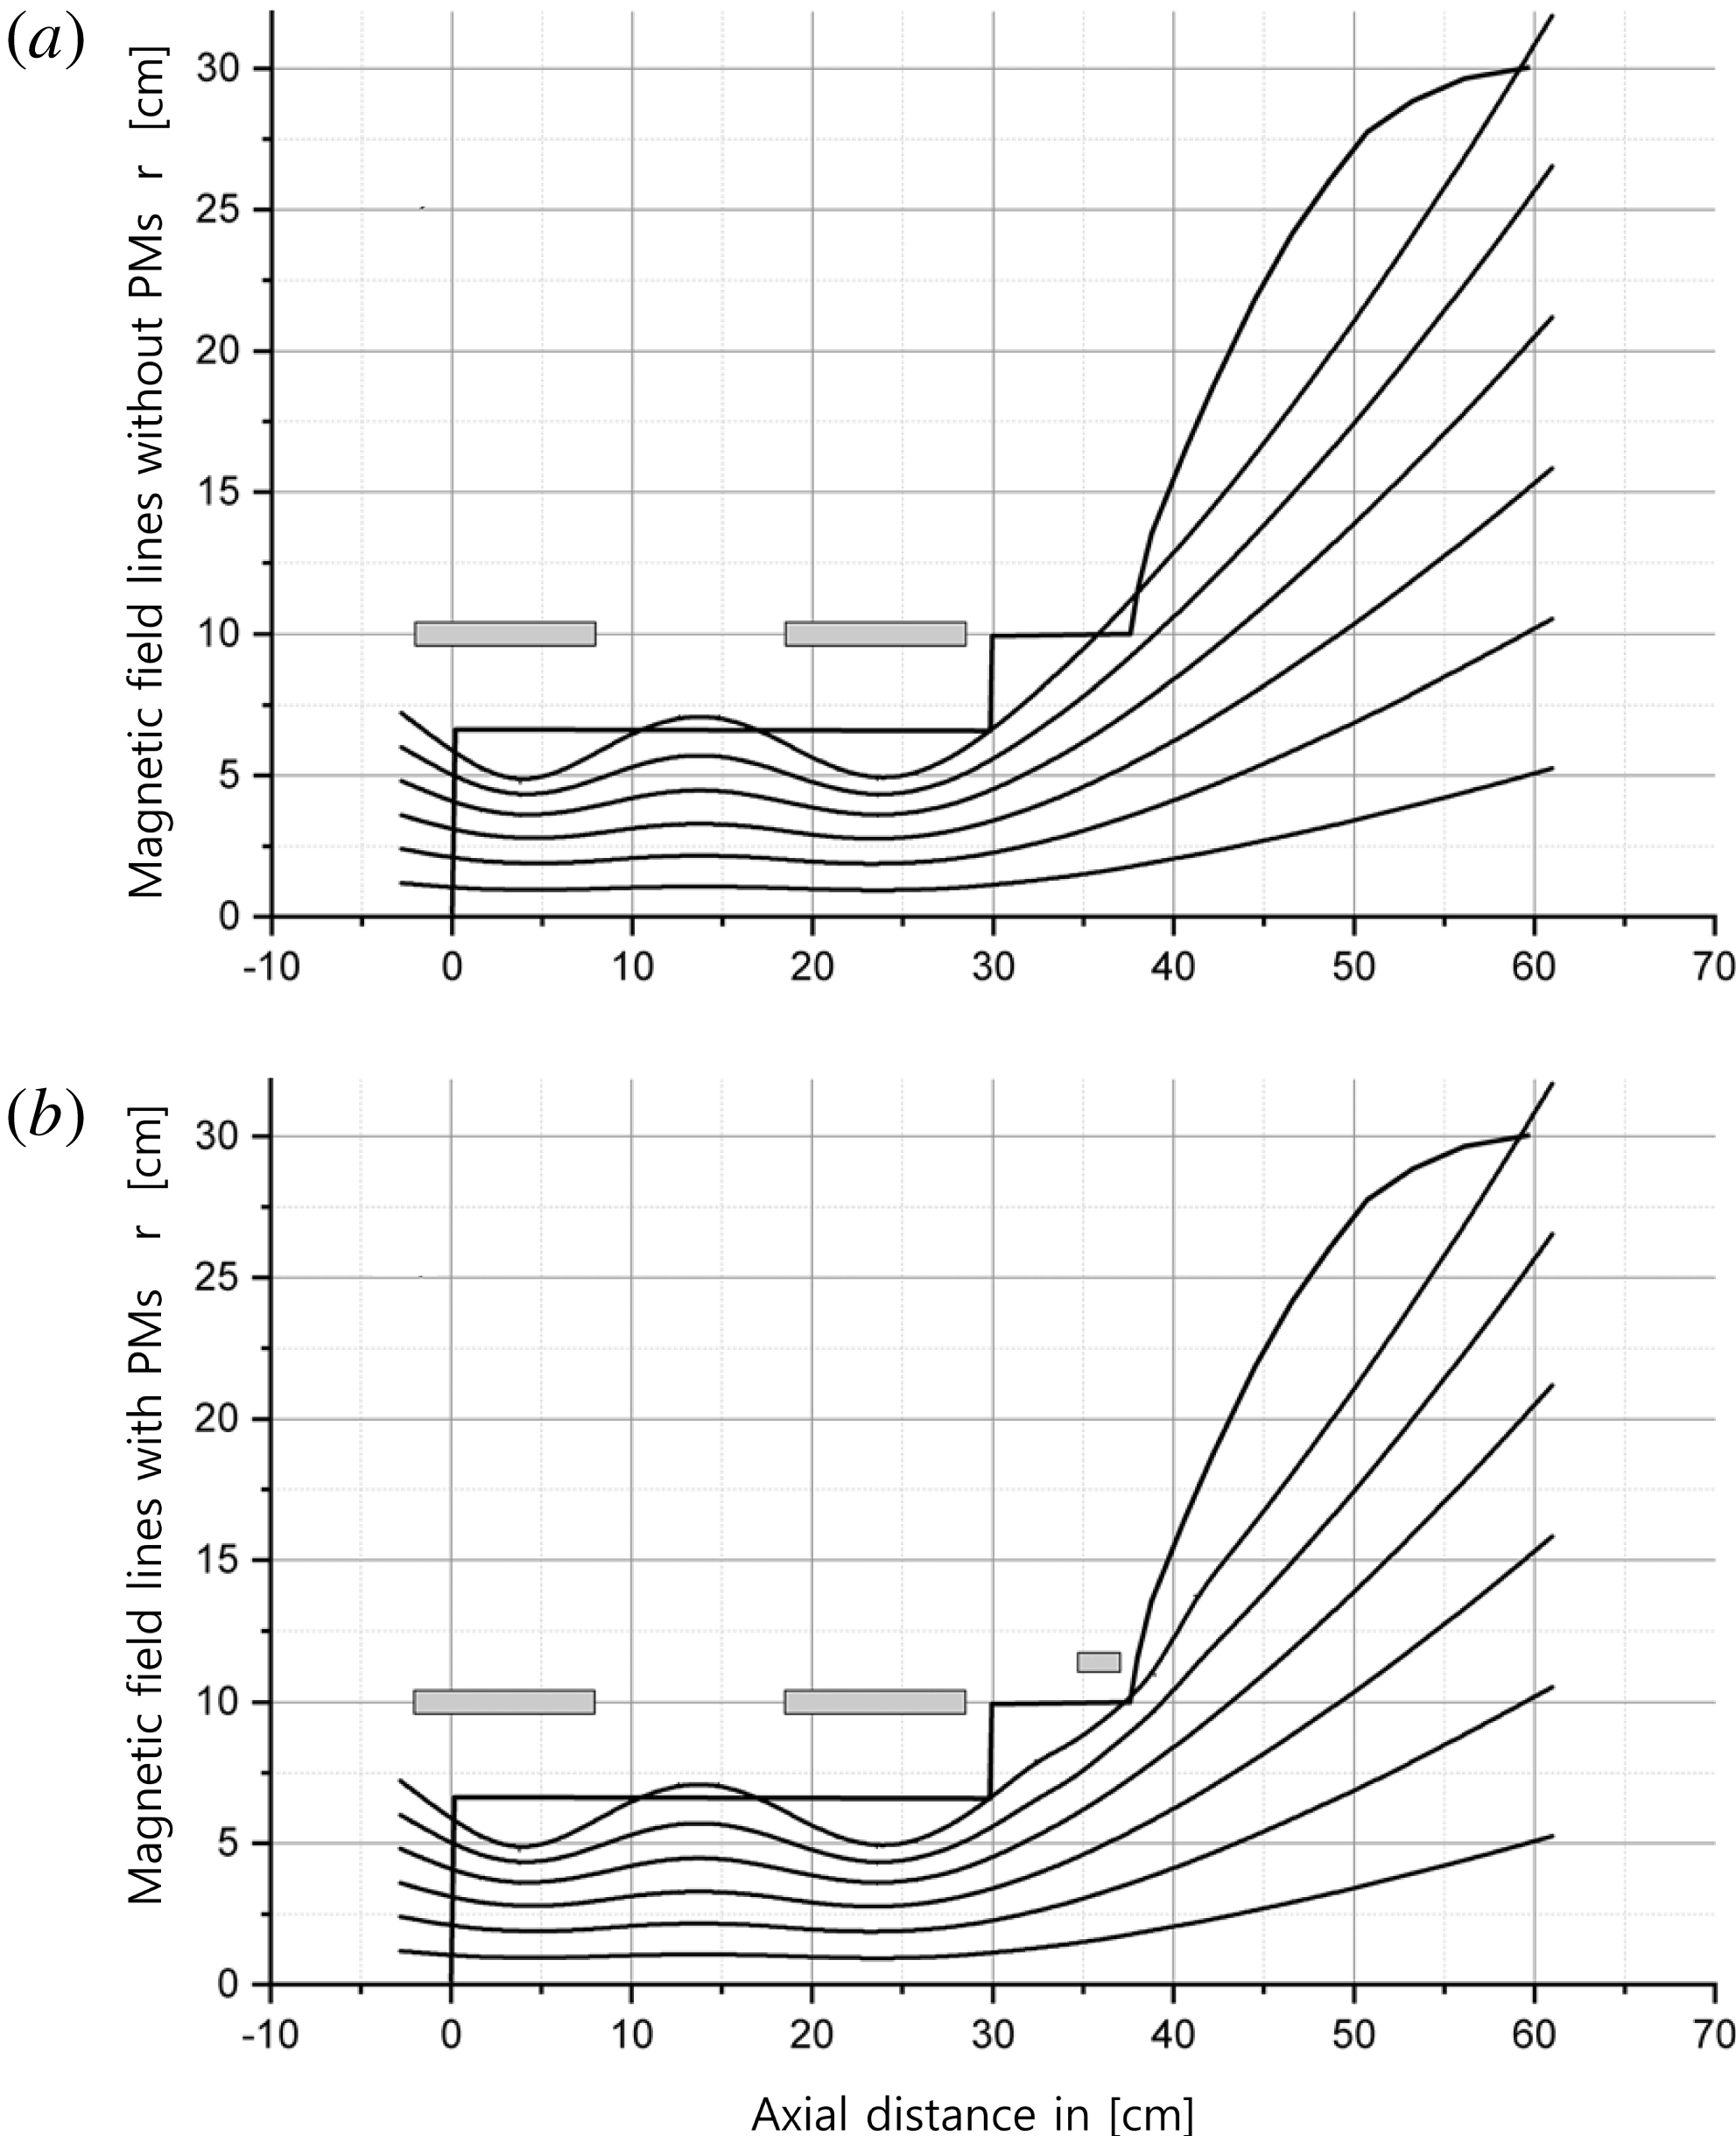
Using the total field strength and assuming the field is nearly homogeneous in the radial direction, the axial magnetic field lines without and with the PMs were calculated, and are shown in figures 3(a) and 3(b), respectively.
(a) Field lines calculated from the total field strength without the PMs and (b) with the PMs.
The area
 $A_{0}=\unicode[STIX]{x03C0}r_{i}^{2}$
of the cylindrical cross-section is calculated at the radius
 $r=r_{i}$
, with
 $r_{i}$
obtained from the grid points in the range
 $[1.2{-}7.2]$
cm of the B-field calculations and at the axial point
 $z_{0}=-5$
cm. With the B-field taken as
 $B_{0i}$
in these grid points, flux conservation
 $B_{0i}(r_{i},z_{0})A_{i0}=B(ri,z)A_{i}(z)$
is used to obtain
 $A_{i}(z)$
. Knowing
 $A_{i}(z)$
in a cylindrical geometry, we obtain
 $r_{i}(z)=\sqrt{A_{i}(z)/\unicode[STIX]{x03C0}}$
, and
 $r_{i}(z)$
is then plotted as a representation of the field line starting at
 $r_{i}$
. This method has also been applied in previous works (Gulbrandsen & Fredriksen Reference Gulbrandsen and Fredriksen2017). The field lines without permanent magnets shown in figure 3(a) were calculated by this method. An outline of the chamber walls and placement of the solenoids are also shown. In this configuration, the magnetic field lines from near the radius of the source will hit (or graze) the port wall. We do not currently have available software to calculate magnetic fields directly from a combination of solenoids and permanent magnets. On the other hand, the field from the PMs was well known from Hall probe measurements, and this total magnetic field was added into the result matrix from the calculations of the solenoids. This procedure enables us to plot approximated field lines, but cannot render the details of the dipole fields near the surface of the port. In figure 3(b) the PM field is shown to bend the outermost field lines slightly, enough to reduce the direct loss of plasma particles to the port wall. A word of caution here is that as one approaches the radial position of the PMs, the magnetic field is no longer homogeneous in the radial direction, and thus the effect from, the PMs is underestimated.
3 RFEA diagnostic
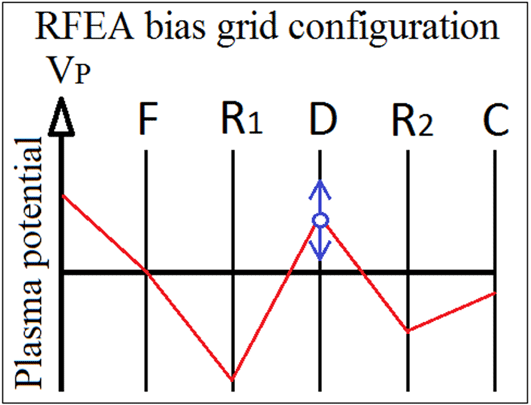
The plasma parameters in Njord were obtained by an electrostatic retarding field energy analyser (RFEA) probe (Stenzel et al. Reference Stenzel, Williams, Agüero, Kitazaki, Ling, McDonald and Spitzer1982; Hutchinson Reference Hutchinson1987). The RFEA probe consists of a ceramic housing, 35 mm long and 23 mm wide, with a floating aperture grid in the front with a diameter of 6 mm. The four grids are made from stainless steel mesh with a transmission factor of 44 % and the meshes are spot welded to 0.3 mm thick brass spacers with 0.3 mm ceramic spacers between them, resulting in a distance of 0.6 mm between the grids. Figure 4 shows the grid configuration which was used in the experiments.
Overview of the biased grid configuration used in Njord.

The two repeller grids
 $R_{1}$
and
 $R_{2}$
are biased at
 $-80$
V and
 $-30$
V, respectively. The sweep of the discriminator grid
 $D$
was set by a computer control and data acquisition program, with a range of typically
 $\pm 50$
V. A battery pack consisting of a series of 9 V batteries was inserted in the discriminator circuit to offset the range as needed to cover the region around the plasma potential. During the experiments, five batteries provided a sweep range of
 $V_{B}=[-5{-}95]$
V. The number of ramp steps for the voltage sweep was set at 300, and the number of samples per bias step for averaging was set at 200 in order to reduce noise. The collector was biased at
 $-27$
V with respect to ground. The current signal from the collector was transmitted to an isolated amplifier which amplified it 100 times, then it was digitised and stored to a computer.
The probe was inserted radially through the 40CF ConFlat port on the dome at an axial distance of
 $z=50$
cm from the front of the source chamber. The radial movements of the probe was controlled by an electric step motor, starting at 0 cm near the inner wall of the dome and moving up to 24 cm inwards (centre of Njord at 18 cm) with step lengths at 1 cm. The position is controlled by the same program as for the discriminator sweep. The RFEA grid configuration and the probe settings were kept at the same values throughout all the experiments, and all experiments involving centre parameter scans were performed with the RFEA placed at 18 cm, equivalent for
 $r=0$
.
In order to estimate the ion density
 $n_{i}$
, the ion velocity distribution function
 $f_{i}$
must be obtained,
 $$\begin{eqnarray}\displaystyle n_{i}=\int f_{i}(v)\,\text{d}v. & & \displaystyle\end{eqnarray}$$
The distribution function can be obtained by using the collected current
 $I_{C}$
in front of the aperture (Stenzel et al.
Reference Stenzel, Williams, Agüero, Kitazaki, Ling, McDonald and Spitzer1982; Chabert & Braithwaite Reference Chabert and Braithwaite2011).
 $I_{C}$
can be expressed as
 $$\begin{eqnarray}\displaystyle I_{C}(v)=Aevn_{i}=Ae\int _{v_{Min}}^{\infty }vf_{i}(v)\,\text{d}v, & & \displaystyle\end{eqnarray}$$
where
 $e$
is the elemental charge,
 $v$
the velocity and
 $A$
is a constant which depends on the front-plate aperture and grid transparency. By considering the direction of the velocity towards the aperture, the minimum velocity
 $v_{Min}$
which is required in order to pass
 $V_{B}$
can be estimated by setting the kinetic energy
 $E_{K}$
equal to the probe bias potential
 $$\begin{eqnarray}\displaystyle E_{K} & = & \displaystyle \frac{1}{2}m_{i}v_{Min}^{2}=eV_{B}\nonumber\\ \displaystyle & \rightarrow & \displaystyle v_{Min}=\left({\displaystyle \frac{2eV_{B}}{m_{i}}}\right)^{1/2}.\end{eqnarray}$$
By substituting
 $v_{Min}$
in (3.2) and solving for the potential, one obtains
 $I_{C}$
as a function of
 $V_{B}$
. Using this, the distribution function for the ions can be obtained from the first derivative of the current as a function of the discriminator potential
 $I_{C}(V_{B})$
, given as
 $$\begin{eqnarray}\displaystyle f(V_{B})={\displaystyle \frac{m_{i}}{Ae^{2}}}{\displaystyle \frac{\text{d}I_{C}(V_{B})}{\text{d}V_{B}}}. & & \displaystyle\end{eqnarray}$$
By using the derivative of
 $I_{C}$
, the distribution function was found in order to extract plasma and ion beam parameters. If no ion beam is formed, or if the RFEA is facing perpendicular to it or is moved radially out of the beam’s position,
 $f(V_{B})$
takes the form of a single peak distribution function, where the area underneath the curve represents
 $n_{i}$
and the peak of
 $f$
indicates the position of
 $V_{p}$
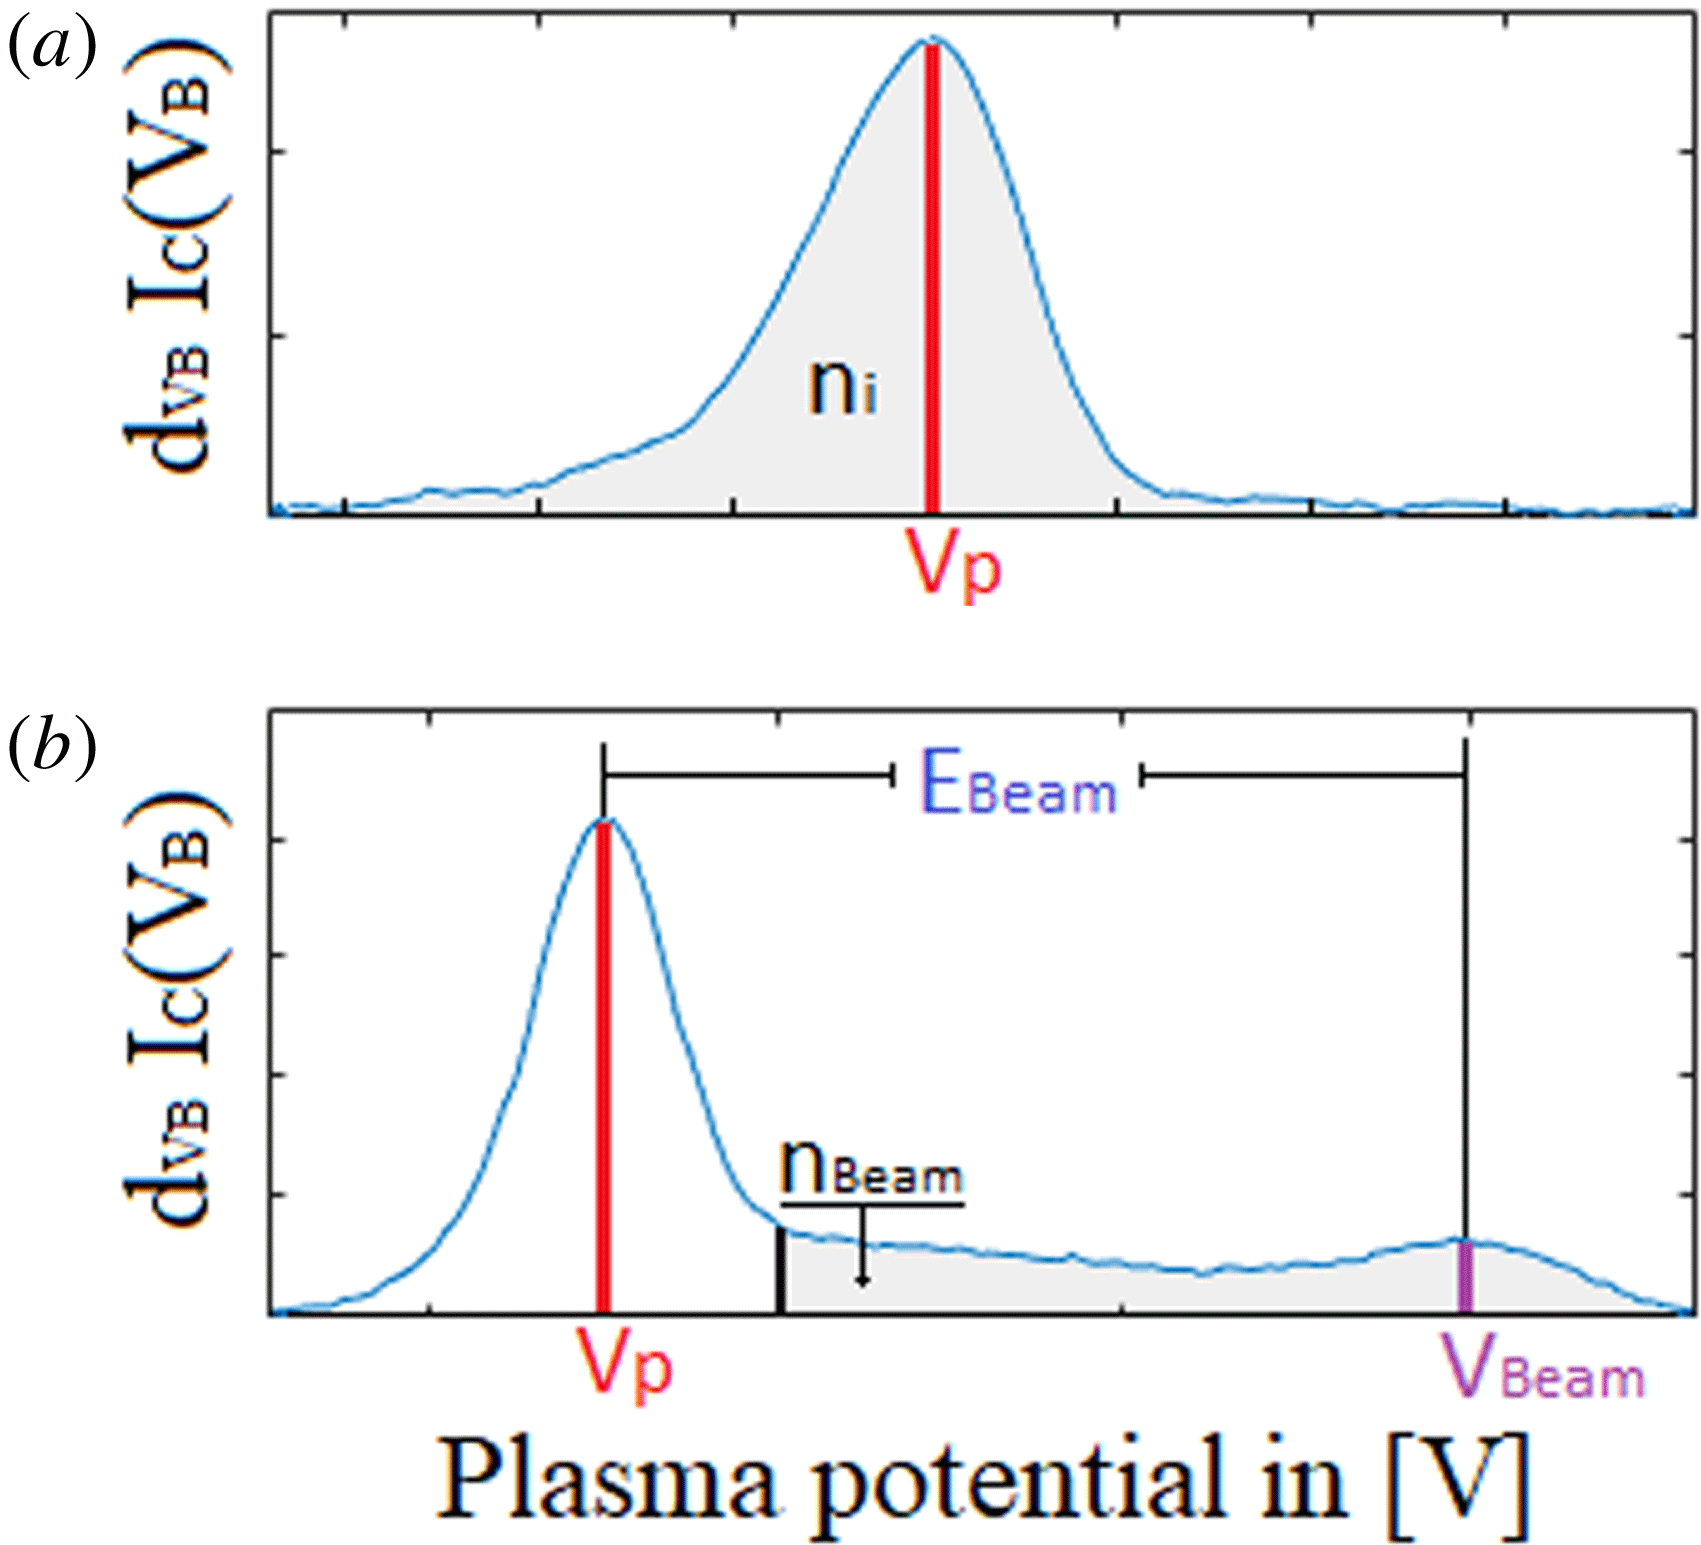
. This background plasma makes up the tallest peak downstream also when the probe is facing the source, and it is formed mostly by charge-exchange collisions of the source ions with neutrals. In the case when an ion beam is formed and the RFEA is facing directly towards the source,
 $f(V_{B})$
will take the form of a double-peaked distribution function displaying both the background plasma and the ion beam, where the peak on the left side will mark the background plasma and the peak on the right the ion beam. The start of this secondary peak is identified as the point where the derivative of the collector current starts to deviate from the Gaussian slope at
 $V_{B}>\text{peak}$
maximum. This value is chosen because there is not always a distinct minimum between the beam and the background distribution, which one otherwise could have chosen as the starting point. A more precise estimation has been given by Gulbrandsen et al. (Reference Gulbrandsen, Fredriksen, Carr and Scime2015), where the starting point were chosen as the point where the negative of the double derivative of the collector current was reduced to less than 10 % of its maximum.
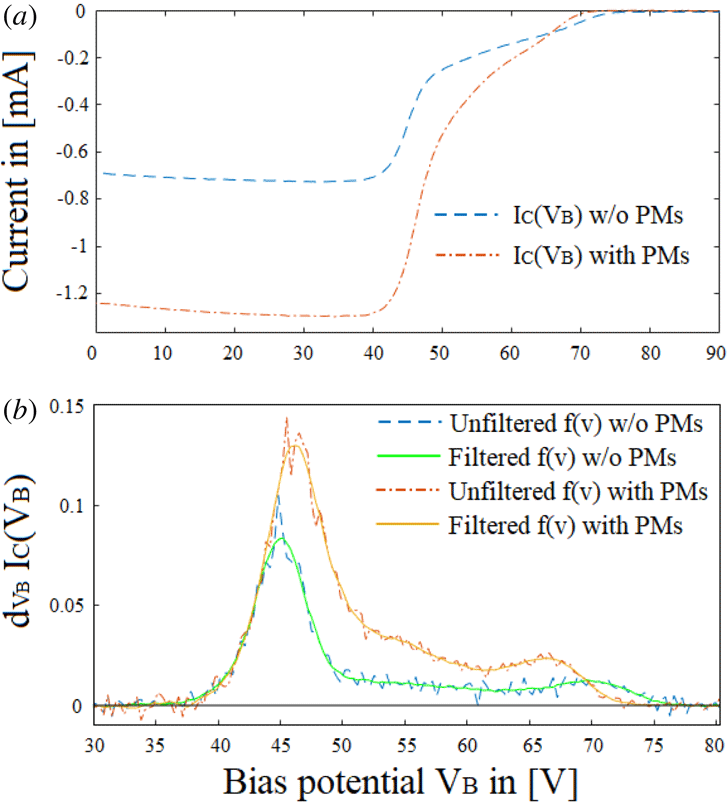
In figure 5(a), the raw data obtained from the RFEA show two typical
 $I_{C}(V_{B})$
current profiles, one from a background plasma and the other for an ion beam. The sweep was performed at 400 W,
 $P=0.65~\unicode[STIX]{x03BC}$
Bar and
 $I_{\text{Coils}}=5$
A, with the probe faced towards the source. The IV-curve with ion beam was registered at
 $r=0$
cm, and the curve with the background plasma only at
 $r=18$
cm, close to the wall of the plasma chamber. Note that while RFEA current profiles are usually represented as a positive current, the acquisition program in this case displays them as a negative valued current.
(a) Raw data from the collected current
 $I_{C}$
and (b) raw versus filtered distribution function for an ion beam and background plasma at 400 W,
 $P=0.65~\unicode[STIX]{x03BC}$
Bar and
 $I_{\text{Coils}}=5$
A, without PMs.

Figure 5(b) shows the distribution functions obtained by differentiating the
 $I_{C}(V_{B})$
curves in figure 5(a) with respect to
 $V_{B}$
. The profile for the background plasma shows a distribution function with a form similar to a Maxwellian distribution function. Often this is not the case for experimental plasmas as they are not always in thermal equilibrium. For the profile with ion beam, the secondary peak on the right-hand side indicates that an ion beam is present. To reduce the noise generated from differentiating, a Savitsky Golay filter with a width of 9 data points (sometimes up to 15) was applied in order to smooth the distribution function. In figure 5(b), the unfiltered and filtered distribution functions are shown. Using the MATLAB function trapz, the area underneath the filtered curve was found and used to obtain the ion density, which was then calibrated against ion densities obtained simultaneously with a Langmuir probe (LP) placed close to the RFEA at
 $r=0$
cm and
 $z=50$
cm, as shown in figure 1(a). To calibrate the density obtained by the RFEA, 30 measurements at various set parameters were obtained simultaneously with the RFEA and a shielded LP.
RFEA probe scans with the PMs on were performed in the same manner, as were the data extractions. Figure 6(a,b) shows the raw data and the unfiltered and filtered distribution function with and without PMs respectively, and with the same control parameters as those in figure 5. The comparison of these scans is discussed in further detail in § 4.
(a) Collected current
 $I_{C}$
and (b) unfiltered and filtered distribution functions for an ion beam at RF-power 400 W, pressure
 $P=0.65~\unicode[STIX]{x03BC}$
Bar and coil current
 $I_{\text{Coils}}=5$
A, with and without PMs.

Using the characteristics of the distribution function, the plasma potential
 $V_{p}$
, ion density
 $n_{i}$
, beam potential
 $V_{\text{Beam}}$
and beam energy
 $E_{\text{Beam}}$
were estimated from the data records. Figure 7(a) illustrates how
 $n_{i}$
and
 $V_{p}$
was found from the distribution function for a background plasma only, and figure 7(b) illustrates how
 $V_{p}$
,
 $V_{\text{Beam}}$
,
 $E_{\text{Beam}}$
and
 $n_{\text{Beam}}$
was extracted from the distribution function when an ion beam is present.
(a) Distribution function for a background plasma and (b) with an ion beam.
4 Results
Using the method described in the last section,
 $V_{p}$
,
 $V_{\text{Beam}}$
,
 $n_{i}$
and
 $E_{\text{Beam}}$
at different RF-powers, pressures and magnetic field strengths were obtained and the data with and without PMs were compared. The results from scans with equal parameter settings were compared in order to test the reproducibility of the scans. The parameters differed by as little as 1 % over most of their range, and in some cases up to
 ${\sim}5$
%.
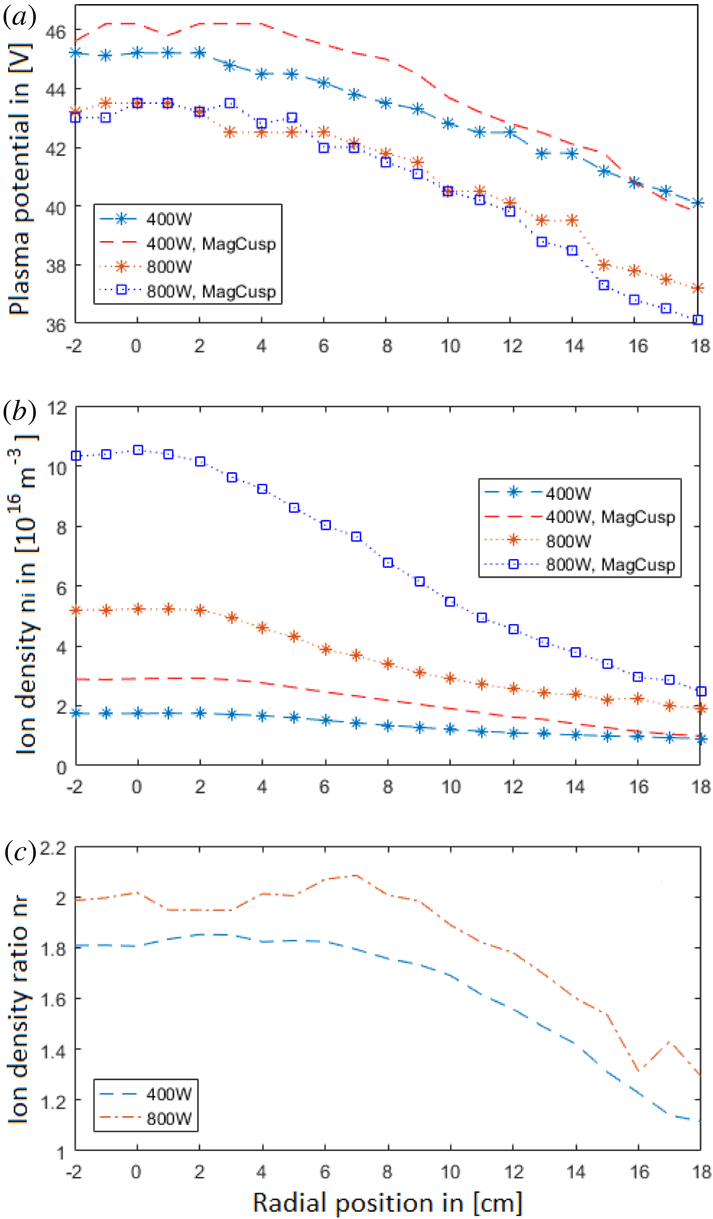
In the first comparison, two radial profiles of
 $V_{p}$
and
 $n_{i}$
at two different RF-powers are given in figures 8(a) and 8(b) respectively, at a pressure of
 $0.65~\unicode[STIX]{x03BC}$
Bar and an axial magnetic field of
 ${\sim}[165{-}170]$
Gauss at a coil current of
 $I_{\text{Coils}}=5$
A.
Radial profiles of (a) the plasma potential
 $V_{p}$
, (b) the ion density
 $n_{i}$
and (c) ion density ratio
 $n_{r}$
versus RF-power at pressure
 $P=0.65~\unicode[STIX]{x03BC}$
Bar and magnetic coil current
 $I_{\text{Coils}}=5$
A at RF-power 400 and 800 W, with and without the magnet band.

Figure 8(a) shows that the effect on the plasma potential
 $V_{p}$
is moderate. At 400 W,
 $V_{p}$
is slightly higher (
 ${\sim}1$
V) in the centre of the column with the cusp field added. At 800 W, it is lower by a similar amount near the edge of the plasma column.
In figure 8(b), the radial ion density
 $n_{i}$
profiles with and without an additional cusp field are shown for RF powers of 400 and 800 W. At 400 W a moderate increase in density is seen, and a substantial increase can be observed at 800 W, in particular near the centre of the plasma column, where the density increases from approximately
 ${\sim}5.22\times 10^{16}~\text{m}^{-3}$
to
 ${\sim}1.05\times 10^{17}~\text{m}^{-3}$
.
To better illustrate the effect of the magnetic cusp field on the plasma, the ion density ratio
 $n_{r}$
is introduced as the ratio between the ion density with the added magnet cusp field (
 $n_{i\text{Mag}}$
) and that without it (
 $n_{i}$
)
 $$\begin{eqnarray}\displaystyle n_{r}={\displaystyle \frac{n_{i\text{Mag}}}{n_{i}}}. & & \displaystyle\end{eqnarray}$$
For the remaining data sets, results for the density will be given as
 $n_{r}$
. In figure 8(c),
 $n_{r}$
for the two radial profiles from figure 8(b) is shown;
 $n_{r}$
increases from the outer edge of the plasma column towards the centre until a plateau is reached at approximately
 $r=8$
cm. The same radial behaviour is seen for both low (400 W) and high (800 W) RF-powers, with a ratio of about 2 near the centre at 800 W and approximately 1.8 at 400 W.
In figure 9,
 $n_{r}$
at
 $r=0$
cm in the RF-power range
 $[100{-}800]$
W is shown. The ratio
 $n_{r}$
in the centre of the column increases from a moderate factor of 1.2 at low RF-power to a maximum of
 ${\sim}2$
at the RF-power range
 $[600{-}800]$
W.
Centre density ratio
 $n_{r}$
versus RF-power at pressure
 $P=0.65~\unicode[STIX]{x03BC}$
Bar and magnetic coil current
 $I_{\text{Coils}}=5$
A at RF-power range
 $[100{-}800]$
W.

From figure 9 it is clear that, along with an increasing inserted RF-power, the added magnetic cusp field from the PMs causes the plasma density to increase over the entire radial range. The increase in plasma density near the wall is possibly due to the electrons which would have been lost to the wall instead being guided away from it, causing an increase in the plasma density at the edge of the chamber. The largest effect from the PMs is evident in the centre of the chamber where
 $n_{r}$
at RF powers above 600 W reached a plateau value of approximately 2 with the added PMs. One possible explanation is that the PMs reflect the plasma charges, consisting of both ions and electrons, radially inwards, causing a build up of the plasma density towards the centre.
How the PMs affect the antenna and the matching network, possibly changing the effective power transfer (EPT), that is, how much power is actually deposited in the plasma, should also be considered. The EPT is not directly obtained with the present experimental set-up. However, a change in EPT should affect the plasma density in the source. Hence, as a test of this possibility, a Langmuir probe was inserted directly in the source and the ion saturation current was measured at some of the control parameters in order to obtain
 $n_{i}$
with and without the PMs. The results showed that the difference between the two cases was negligible, i.e. the increase, and sometimes decrease, was less than 4 % of the densities without the PMs. Furthermore, the distance between the placement of the PMs and the antenna is 10 cm in the axial distance, and the magnetic field from the PMs has a strength of 0.027 Gauss according to the model, a negligible value. The PMs were thus found not to affect the EPT significantly. It was noticed however that reflected power
 $P_{Ref}$
without retuning would increase by
 $[3{-}5]$
W with the PMs attached, showing that the they have a small, but observable, impact on the network. However, during measurements, the antenna was constantly tuned for all parameter changes and prior to each radial sweep in order to keep
 $P_{Ref}$
as small as possible. On average, the reflected power was of the order of
 $P_{Ref}=1$
W and
 $VSWR=1$
, showing that the transmission network was in match. Based on the available data, the reason for the increase in
 $n_{r}$
towards the centre of the plasma column, and also the increase with increasing RF power towards a plateau above
 $P_{In}\sim 600$
W, is still elusive. Further work is needed, including also radial measurements at different axial positions, to investigate whether the increase in downstream density is consistent along the
 $z$
-axis as well.
The pressure tests were performed in a pressure range of
 $P=[0.65{-}1.05]~\unicode[STIX]{x03BC}$
Bar where an ion beam can be detected, at RF-power 400 W, and magnetic coil current
 $I_{\text{Coils}}=5$
A. The radial profiles of
 $n_{r}$
at three different pressures are shown in figure 10.
Radial ion density ratio versus pressure values
 $P=0.65~\unicode[STIX]{x03BC}$
Bar at flow
 $Q=2.0$
SCCM,
 $P=0.85~\unicode[STIX]{x03BC}$
Bar at flow
 $Q=3.0$
SCCM and
 $P=1.05~\unicode[STIX]{x03BC}$
Bar at flow
 $Q=4.0$
SCCM at RF-power 400 W and magnetic coil current
 $I_{\text{Coils}}=5$
A.

Also in this case, the results show that the cusp field significantly increases the density in the plasma interior. At both
 $0.85~\unicode[STIX]{x03BC}$
Bar and
 $1.05~\unicode[STIX]{x03BC}$
Bar the centre density was increased by a factor of approximately 1.9. At the edge of the plasma the density increased from a factor of
 ${\sim}1.1$
at
 $0.65~\unicode[STIX]{x03BC}$
Bar to a factor slightly over 1.3 at
 $1.05~\unicode[STIX]{x03BC}$
Bar. While
 $n_{r}$
in the centre did not increase further from
 $0.85~\unicode[STIX]{x03BC}$
Bar to
 $1.05~\unicode[STIX]{x03BC}$
Bar, the ratio at the edge steadily increased at the highest pressures as well. No more data from higher pressures are presented, as the RFEA did not detect an ion beam.
The density ratio at different axial magnetic field strengths was obtained at a RF-power of 400 W and a pressure
 $P=0.85~\unicode[STIX]{x03BC}$
Bar with a magnetic coil current range
 $I_{\text{Coils}}=[0{-}6]$
A in steps of 1 A, which corresponds to an axial magnetic field strength range of
 $[0{-}200]$
Gauss. Two radial profiles at two different axial magnetic field strengths are shown in figure 11.
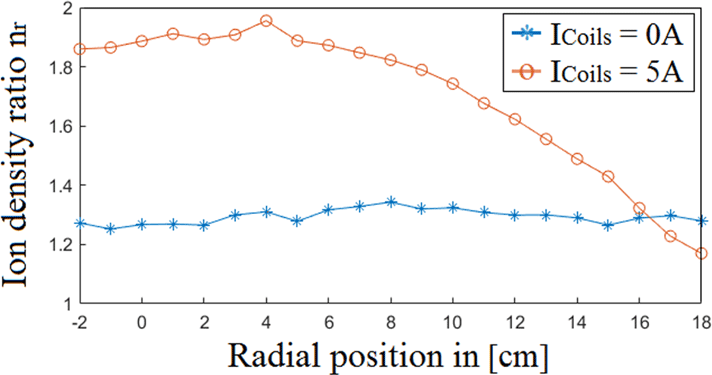
Radial ion density ratio
 $n_{r}$
versus magnetic coil current
 $I_{\text{Coils}}$
values at 0 and 5 A at RF-power
 $=400$
W and pressure
 $P=0.85~\unicode[STIX]{x03BC}$
Bar with and without PMs.
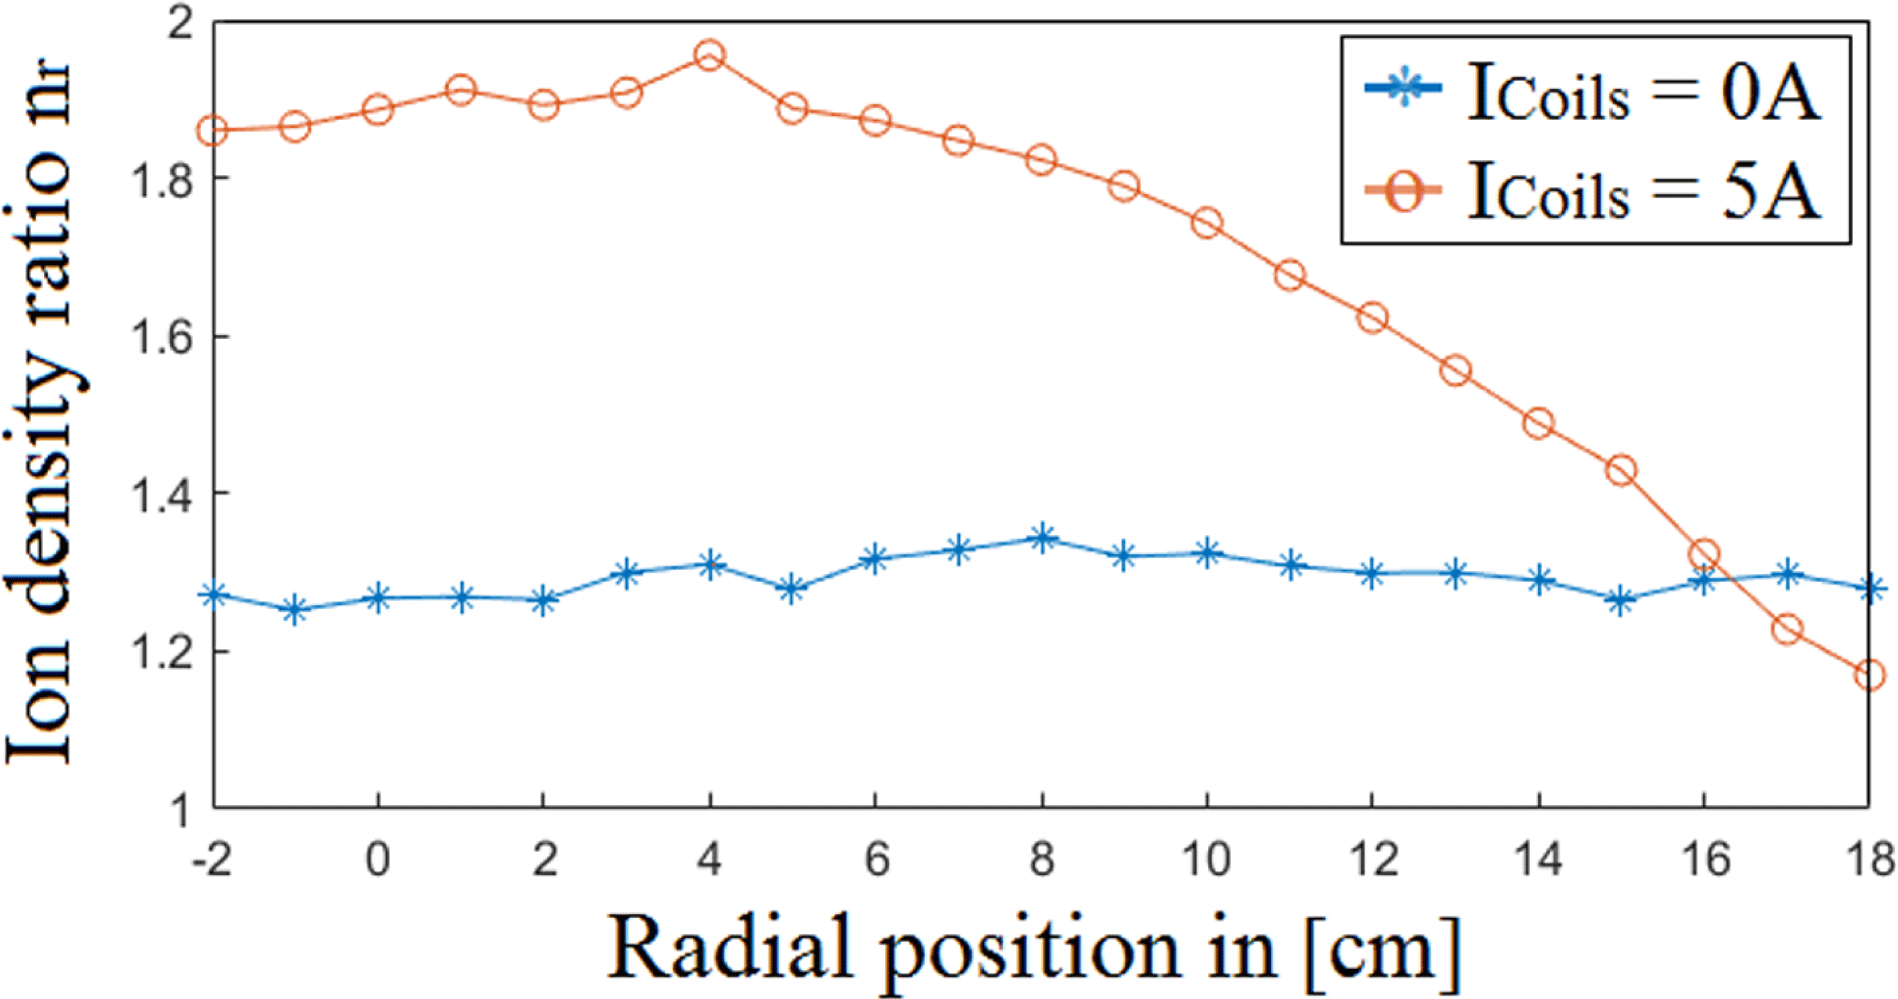
The scan with no axial magnetic field was conducted in order to study how the cusp field from the PMs alone affects the plasma density, as well as to find a radial profile for
 $n_{r}$
. When no axial magnetic field is present the cusp field increases the overall density by a factor of
 ${\sim}1.3$
over the entire radial range. This suggest that the PMs cause the plasma density to increase nearly evenly over the radial range. In order to see how much the PMs affect the radial plasma density without any axial magnetic field, a new test with more powerful PMs should be conducted. At
 $I_{\text{Coils}}=5$
A,
 $n_{r}$
increases to a factor of approximately 1.9 at the centre. At the edge,
 $n_{r}$
was lower, at
 ${\sim}1.2$
, compared to
 ${\sim}1.3$
at
 $I_{\text{Coils}}=0$
A, indicating that the combination of an axial magnetic field and PMs provides a better increase of
 $n_{r}$
.
The ion density in the centre at
 $r=0$
cm and
 $z=50$
cm as a function of
 $I_{\text{Coils}}$
is depicted in figure 12(a) and
 $n_{r}$
is shown in figure 12(b).
Centre ion density
 $n_{i}$
and ion density ratio
 $n_{r}$
versus magnetic coil current
 $I_{\text{Coils}}$
at RF-power
 $=400$
W and pressure
 $P=0.85~\unicode[STIX]{x03BC}$
Bar.

As depicted,
 $n_{r}$
reduces to a factor just above
 $0.8$
in the
 $I_{\text{Coils}}$
range
 $[1{-}2]$
A, or
 $[35{-}70]$
Gauss, and from figure 12(a), one can see that there is a density peak present at a low axial magnetic field. From the other experiments one would assume that the PMs would improve the magnetic confinement and hence increase the density. However, at a magnetic field strength below
 ${\sim}100$
Gauss with the PMs on,
 $n_{r}$
at this range reduces with the PMs attached. However, no radial probe sweeps were performed at these low
 $I_{\text{Coils}}$
values in order to obtain radial
 $n_{r}$
profiles.
Density peaks at low magnetic fields have been noticed earlier in different experiments (Shamrai & Taranov Reference Shamrai and Taranov1996; Chen Reference Chen2003; Cho Reference Cho2006; Lafleur, Charles & Boswell Reference Lafleur, Charles and Boswell2010a ,Reference Lafleur, Charles and Boswell b ; Barada et al. Reference Barada, Chattopadhyay, Ghosh, Kumar and Saxena2013; Wang et al. Reference Wang, Zhao, Liu, Ouyang and Chen2015). Studies of this phenomenon have not yet provided an exact physical explanation, but several suggestions point to a helicon mode or a Trivelpiece–Gould (TG) mode which causes the plasma production to increase at a low axial magnetic field. If this is the case, then it appears that the PMs affect this mode in the opposite direction, causing a reduction of the ion density at a low axial magnetic field.
The beam energy
 $E_{\text{Beam}}$
was found from the difference between the beam potential and the plasma potential as described in figure 7(b), and by using energy conservation the beam velocity
 $v_{\text{Beam}}$
can be estimated,
 $$\begin{eqnarray}\displaystyle \left.\begin{array}{@{}c@{}}\displaystyle E_{\text{Beam}}=e(V_{\text{Beam}}-V_{p})\\[6.0pt] \displaystyle E_{k}={\textstyle \frac{1}{2}}m_{i}v_{\text{Beam}}^{2}=e(V_{\text{Beam}}-V_{p})\\[6.0pt] \displaystyle v_{\text{Beam}}=\sqrt{\frac{2e}{m_{i}}(V_{\text{Beam}}-V_{p})}.\end{array}\right\} & & \displaystyle\end{eqnarray}$$
The change in the beam velocity
 $v_{\text{Beam}}$
was estimated similar to
 $n_{r}$
by defining the ion beam velocity ratio
 $v_{Br}$
as the square root of the ratio between the beam energy
 $E_{BeamMag}$
with the PMs and the beam energy
 $E_{\text{Beam}}$
without them
 $$\begin{eqnarray}\displaystyle v_{Br}=\sqrt{{\displaystyle \frac{E_{BeamMag}}{E_{\text{Beam}}}}}. & & \displaystyle\end{eqnarray}$$
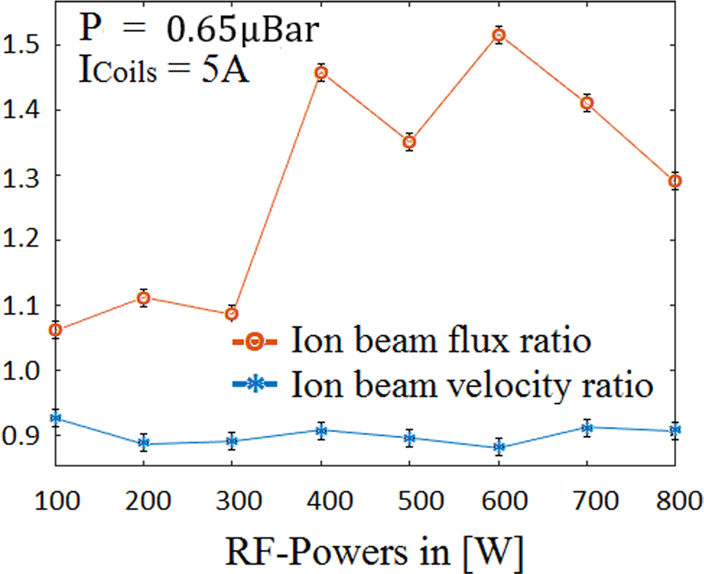
Using this ratio, the change in beam velocity was estimated for the different RF-powers, pressures and magnetic field strength values in the cases where an ion beam could be registered. The variations with RF-power are depicted in figure 13, and the ratios as a result of pressure and
 $I_{\text{Coils}}$
-variations are listed in table 1.
As shown,
 $v_{Br}$
reduces by a factor of
 ${\sim}0.9$
for all parameter changes, with some small variations. One possible explanation could be that, while we observe that the downstream plasma potential
 $V_{p}$
increases only slightly, with
 ${\sim}1$
V less, the beam potential
 $V_{\text{Beam}}$
decreases more significantly (see figure 8
a), a sign that the plasma potential in the source decreases with the PMs attached. The reduced plasma potential can also indicate an increased density (Hopwood et al.
Reference Hopwood, Guarnieri, Whitehair and Cuomo1993). Thus, the beam velocity decreases due to a lower plasma potential in the source. This might be due to a better electron confinement, as the cusp field of the PMs would prevent the electrons from hitting the port wall, which they otherwise do with the purely expanding field (Fredriksen et al.
Reference Fredriksen, Mishra and Byhring2010). Upon being reflected from the cusp field, the electrons will move freely upstream back into the source and thus possibly contribute towards a lower plasma potential there.
Centre ion beam velocity ratio
 $v_{Br}$
and ion beam flux ratio
 $\unicode[STIX]{x1D719}_{Br}$
versus RF-power at pressure
 $P=0.65~\unicode[STIX]{x03BC}$
Bar and magnetic coil current
 $I_{\text{Coils}}=5$
A.

In order to find how the PMs affects the ion beam density, the ion beam density ratio
 $n_{Br}$
is introduced as the ratio between the ion beam density with the PMs on,
 $n_{\text{BeamMag}}$
, and without them,
 $n_{\text{Beam}}$
, similar to
 $n_{r}$
and
 $v_{Br}$
. The beam density was found by measuring the area beneath the secondary peak as showed in figure 7(b). By multiplying
 $n_{Br}$
with
 $v_{Br}$
from (4.3), the ion beam flux ratio can be defined as
 $$\begin{eqnarray}\displaystyle \unicode[STIX]{x1D719}_{Br}=n_{Br}v_{Br}. & & \displaystyle\end{eqnarray}$$
The results of the flux ratio of the beam as a function of RF-power is shown in figure 13, while the results for the pressure and
 $I_{\text{Coils}}$
variations are listed in table 1.
Estimated values for the ion beam velocity ratio
 $v_{Br}$
, ion beam density ratio
 $n_{Br}$
and flux ratio
 $\unicode[STIX]{x1D719}_{r}$
at different flows
 $Q$
and magnetic coil currents
 $I_{\text{Coils}}$
at RF-power 400 W, for which a beam is present.
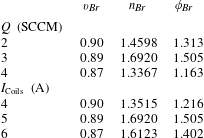
As shown, the ion beam flux at
 $r=0$
cm increased by a factor of 1.5 at each individual parameter setting. Throughout all the estimated
 $\unicode[STIX]{x1D719}_{r}$
values, it is clear that the flux ratio depends more on the behaviour of the beam density ratio
 $n_{Br}$
, as
 $v_{Br}$
stays at
 ${\sim}0.9$
. The jump in
 $\unicode[STIX]{x1D719}_{r}$
between 300 and 400 W can possibly be contributed to a mode change in the plasma when the RF-power increases, causing an increase in the beam density as
 $n_{r}$
increases.
Given that inductively coupled helicon plasmas have been applied to the development of ion engines, and that particle flux can be used to estimate the thrust (Sutton & Biblarz Reference Sutton and Biblarz2010), it is possible that permanent magnets, as investigated here, could affect also the thrust of such engines. However, the design of the present experiment is not optimal in order to discuss this possibility further. A more dedicated experiment would be needed in order to decide the possible effects on thrust of RF ion engines.
5 Conclusions
The results from the experiments have shown that the application of a magnetic multipole cusp field around the port of a helicon plasma source causes a significant increase in the downstream plasma density. The plasma density increased by a ratio up to 1.8–2 in the centre of the plasma column and up to 1.3 at the plasma edges at different parameter values for the RF-power, pressure and magnetic field strength, separately. Without any axial magnetic field, the applied magnet band provided an increased density just below a factor of 1.3 across the entire radius. A combination of the three variables may increase the density even further, contributing to an increased plasma confinement in the system.
The ion beam velocity was reduced overall by approximately 10 %, and due to the increased density, the ion beam flux increased by up to a factor of 1.5, at each separate parameter change. A combination of these three parameters might increase the flux ratio even further. This effect could possibly be utilised in order to improve the thrust from plasma thrusters.
Acknowledgements
Author E. Varberg carried out the experiments and analysis, under supervision and assistance by author Å. Fredriksen. The authors want to thank I. Stømmesen and the staff at the mechanical workshop for their excellent technical assistance. The authors wish to thank the referees who kindly reviewed the article and gave insightful and constructive comments and questions during the publication process. This research was supported and entirely funded by the department of Physics and Technology at UiT The Arcitic Universy of Norway.