





Introduction
Current rabbit and apple production systems
Rabbit farming heavily relies on production inputs such as energy, feed, and antibiotics, leading to a significant environmental footprint (Cesari et al., Reference Cesari, Zucali, Bava, Gislon, Tamburini and Toschi2018) and biohazard risks (Moreno-Grúa et al., Reference Moreno-Grúa, Pérez-Fuentes, Muñoz-Silvestre, Viana, Fernández-Ros, Sanz-Tejero, Corpa and Selva2018). Welfare concerns are also prominent, with 97% of farmed rabbits in Europe housed in small cages measuring less than 4 000 cm2 (EFSA, 2020). Together, these factors contribute to a production system that does not align with the preferences of European consumers, who prefer small-scale farms with low environmental impact and outdoor access for animals (Caracciolo et al., Reference Caracciolo, Cicia, Del Giudice, Cembalo, Krystallis, Grunert and Lombardi2016).
Similarly, the apple production sector, the most cultivated fruit tree in Europe (Eurostat, 2019), is under scrutiny due to its heavy reliance on chemical fertilizers and pesticides. In Austria alone, 228 different pesticide products were used in apple orchards between 2010 and 2016 (Zaller et al., Reference Zaller, Oswald, Wildenberg, Burtscher-Schaden, Nadeem, Formayer and Paredes2023), with similar figures reported in France (Desprat, Cretin, and Espinosa, Reference Desprat, Cretin and Espinosa2021).
In this context, the development of alternative systems for rabbits and apple production, inspired by organic farming (Sundrum, Reference Sundrum2001), agroforestry (Broom, Galindo, and Murgueitio, Reference Broom, Galindo and Murgueitio2013), and other forms of crop-livestock integration (Bonaudo et al., Reference Bonaudo, Bendahan, Sabatier, Ryschawy, Bellon, Leger, Magda and Tichit2014), is necessary to address the environmental and societal concerns.
Expected benefits of associating rabbits with apple trees
In apple production, integrating animals for weed control and manure supply may reduce greenhouse gas emissions associated with mechanical weeding and fertilizing (Alaphilippe et al., Reference Alaphilippe, Simon, Brun, Hayer and Gaillard2013). In this sense, introducing rabbits appears to be a promising approach, as their small size allows them to access and graze on the grass around the tree trunks without damaging leaves, edible fruits, or branches, unlike other livestock species (López-Sánchez et al., Reference López-Sánchez, Perea, Roig, Isselstein and Schmitz2020; Bosshardt et al., Reference Bosshardt, Sabatier, Dufils and Navarrete2022). Rabbits also forage on fallen apples and dead leaves (Savietto et al., Reference Savietto, Fillon, Temple-Boyer--Dury, Derbez, Aymard, Pujol, Rodriguez, Borne, Simon, Grillot, Lhoste, Dufils and Drusch2023), potentially providing a cleaning service to the orchard, and their droppings may improve soil fertility. In return, the orchard should provide rabbits with a varied diet, including grass, fallen apples, and dead leaves, as well as shade and protection against extreme weather.
Unlike other livestock species, for which no specific protection exists to prevent the animals from feeding on trees, tree guards are commonly used to protect apple trees against wild rabbits and hares, thereby reducing the risk of debarking. In addition, rabbits can tolerate high levels of copper in their diet (up to 250 mg/kg; Omole, Reference Omole1980) compared to other species, such as sheep (15 mg/kg of diet; Lamand, Reference Lamand, L’Hermite and Dehandtschutter1981), horses (50 mg/kg of diet; Belli et al., Reference Belli, Fernandes, Torres, Sucupira, de Sá, Maiorka, Neuenschwander, de Barros and Baccarin2021), or dairy cattle (136 mg/kg of diet; Johnston, Beasley, and MacPherson, Reference Johnston, Beasley and MacPherson2014). This copper tolerance is a key advantage of rabbits, as the use of copper to prevent scab infection remains a common practice in apple production, even in organic systems.
However, although the literature suggests that associating rabbits and is promising (Savietto et al., Reference Savietto, Fillon, Temple-Boyer--Dury, Derbez, Aymard, Pujol, Rodriguez, Borne, Simon, Grillot, Lhoste, Dufils and Drusch2023), the benefits expected from this system have yet to be measured in a larger-scale study.
A promising attempt to fill this gap
This study was designed to evaluate the interspecific benefits of associating rabbits and apple trees, including effects on animal growth, health, welfare, soil fertility, and orchard sanitation. Potential limitations, such as tree debarking and the need for new orchard designs, were also considered.
We formulated the hypothesis that this association would be mutually beneficial for both plants and animals, with only limited constraints. To test this, a group of 72 growing rabbits was reared for 36 days in an organic apple orchard and compared to a control group of 72 rabbits raised in a grassland system without trees.
The benefits to the trees were assessed by measuring the soil mineral content and cleaning services provided by the rabbits, as well as any damage to the trees, by comparing areas of the apple orchard with and without rabbits.
To the best of the author’s knowledge, this study represents the first proof-of-concept, based on large-scale experimental data, investigating the feasibility and relevance of a system that combines rabbit and apple production in the same area.
Materials and methods
Study design
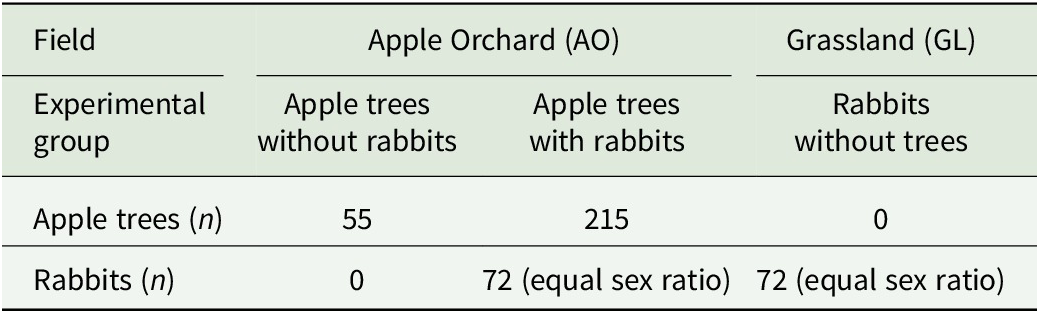
We designed an analytical experiment to assess the benefits and limitations that rabbits may provide to apple trees, and vice versa. The study was conducted in two fields: an organic apple orchard (AO) with two treatment conditions, apple trees with rabbits and apple trees without rabbits, and a grassland (GL) with rabbits but no trees. See Table 1.
Fields, experimental groups, and the number of apple trees and rabbits in each experimental group

Table 1. Long description
The table is organized into four columns.
Column 1 lists the subjects: Apple trees (n) and Rabbits (n).
Columns 2 and 3 fall under the Field category Apple Orchard (A O).
- The first experimental group is Apple trees without rabbits, containing 55 apple trees and 0 rabbits.
- The second experimental group is Apple trees with rabbits, containing 215 apple trees and 72 rabbits with an equal sex ratio.
Column 4 falls under the Field category Grassland (G L).
- The experimental group is Rabbits without trees, containing 0 apple trees and 72 rabbits with an equal sex ratio.
This experimental study followed a partly randomized design. A total of 144 rabbits were randomly assigned to 24 mobile pens, with six animals per pen and equal sex ratio. The pens were evenly distributed across the two fields (see Supplementary Figure S1). To evaluate the benefits of apple trees for rabbits, we compared rabbits living in the AO with those in the GL. To assess the benefits of rabbits for apple trees, we compared apple trees with rabbits to apple trees without rabbits.
Animals and field characteristics
Animals
This study involved 144 crossbred rabbits (½ PS119 × ⅛ Belier × ¼ INRA1777 × ⅛ Fauve-de-Bourgogne) of both sexes, distributed equally. The rabbits were born at INRAE Sheep and Rabbit Experimental Unity (https://doi.org/10.17180/ftvh-x393) from 32 multiparous females (¼ Belier × ½ INRA1777 × ¼ Fauve-de-Bourgogne) housed in experimental cages (H: 60 × W: 92 × L: 90 cm) in a controlled building, where the temperature ranged from 18 to 25 °C. By 28 days of age, the rabbits were individually identified with ear tattoos and vaccinated against the myxoma virus and rabbit hemorrhagic disease virus, variants 1 and 2. At 39 and 40 days of age, they received an anti-coccidian treatment consisting of 7 mg/kg live weight of toltrazuril in the drinking water for two consecutive days. At 45 days of age, the rabbits were weaned and transported to INRAE Domaine de Gotheron (Saint-Marcel-Lès-Valence, Drôme, France) in 24 plastic boxes (H: 42 × W: 57 × L: 92 cm; 6 rabbits each). The trip took approximately 5 hours.
The experiment began upon their arrival in the fields and ended when the rabbits were 81 days old, running from 17 October 2022 to 22 November 2022.
Field characteristics
The study was conducted in two distinct fields, located 350 m apart: an organic AO and a grassland.
The organic AO, oriented north–south, was planted in 2005. The planting distance was 5 m between rows and two meters between trees. The cultivar was CG 10 Yellow Delicious Smoothee® (INFEL® 2832) grafted on Supporter® PI80 (INFEL® 6275), growing using a centrifugal training method (Lauri et al., Reference Lauri, Willaume, Larrive and Lespinasse2004). The trees were supported by a 3.5-m-high trellising system. The orchard was irrigated with micro sprinklers (60 cm above the ground) when needed. Fertilization was performed with compost in winter, and organic fertilizers were applied fractionally in spring each year. Weeds were mowed close to the tree row, and the herbaceous cover was a heterogeneous mixture of spontaneous species from different families (Apiaceae, Asteraceae, Poaceae, and Fabaceae). For a more detailed description of the orchard management, see Simon et al. (Reference Simon, Brun, Guinaudeau and Sauphanor2011).
In 2022, the ground cover was not homogeneous, with the presence of some unwanted families (Araliaceae, Polygonaceae, Scrophulariaceae, and Solanaceae) as well as small patches of bare ground. Additionally, there were apple woods (pruning) on the ground and spontaneous young forest tree species within the tree rows.
The rabbits arrived 5 weeks after the end of the apple harvesting, with discarded and fallen apples left in place. During the experimental period, no treatments or other cultural practices (such as fertilization or within-row mechanical weeding) were applied.
The grassland was established in 2019. It was composed of grasses, including Lolium and Dactylis species. This area has not been fertilized since sowing. Mowing to keep the grass low has been the only agricultural practice applied in this field since 2019. Irrigation was applied once, 3 weeks before the animals arrived.
Experimental procedures
Animal management
Upon their arrival, 12 groups of six rabbits (equal sex ratio each) were randomly assigned to the AO (average live weight ± SD of 1 532 ± 147 g), and 12 groups of six rabbits (equal sex ratio each) were randomly assigned to the GL (average live weight ± SD of 1 563 ± 151 g). In both fields, the animals were housed in mobile pens (H: 83 × W: 250 × L: 750 cm) equipped with a wooden shelter (H: 92 × W: 52 × L: 100 cm), an automatic drinker (10 L), and a feeder (5 kg) placed inside the shelter.
The mobile pens were placed in each field following the same layout (see Supplementary Figure S1). In the AO, the mobile pens were placed within six apple tree rows. Each apple row was 90 m long. To protect animals from terrestrial predation, an area of 3 500 m2 around each field was protected with an electric fence (H: 112 cm for variable mesh size) connected to a solar electrifier (LACME SECUR SUN 33 W, La Flèche, France). However, no protection was placed over the mobile pens. This was intended to quantify the potential protection of apple trees against aerial predation.
On the first night, the rabbits were confined to the shelter space and had free access to water, barley straw, and 0.52 m2 of grass (shelter ground level; see Fig. 1).
Photographs of the shelter and mobile pens. (a) Shelter for six rabbits, with the resting area on the left and the feeding area and access to ground level on the right. (b) Rabbits inside a mobile pen placed in the apple orchard. (c) Rabbits inside a mobile pen placed in the grassland.

Figure 1. Long description
The figure consists of three vertically stacked panels labeled A, B, and C.
Panel A: A top-down photo of a rectangular wooden shelter divided into two sections. The left section is filled with a thick layer of barley straw for resting. The right section contains a brown rabbit, a square feeding tray filled with dark pellets, and a small wooden ramp leading to a lower level.
Panel B: A wide-angle photo showing the interior of a mobile pen in an apple orchard. A light brown rabbit is in the foreground near the base of a tree and some bushes. The pen is enclosed by a green wire mesh fence. Other rabbits are visible in the background among the trees and fallen leaves.
Panel C: A high-angle wide shot of a large mobile pen on a grassy field. The pen is defined by a green wire perimeter. Inside, several brown rabbits are scattered across the grass. A wooden shelther, similar to the one in panel A, is positioned in the center of the enclosure to provide shade and shelter.
The next morning, the rabbits received a commercial pelleted feed (Stabi-Green, Rignac, France) containing 15.4 MJ/kg dry matter (DM) of gross energy, 15.6% of crude protein (CP), 37.3% of neutral detergent fiber, 20.1% of acid detergent fiber, and 6.4% acid detergent lignin on a DM basis. Free access to the pelleted feed was granted from 46 to 81 days of age. During this period, rabbits also had free access to the entire pen area (approximately 19.0 m2), except when they were kept inside the shelter for weighing and for the transfer of the mobile pen to a new location.
Movement of the mobile pens
The relocation of the mobile pens depended on biomass availability and the rabbits’ herbage intake. Once the grass inside the pen had been consumed (visual assessment), the pens were moved to a new location. Because the biomass availability differed between AO and GL, the duration for which the mobile pens remained in the same area also varied between fields. To provide a comparable amount of fresh grass to the rabbits in both fields, the mobile pens in the AO were moved once a week. In the GL, the intervals varied from 7 days in the first period to 10 days in the last period. In each field, all pens were moved on the same day. During the movements, rabbits were kept inside the shelters while the entire structure was moved. This operation took less than 20 minutes per mobile pen.
Assessing the benefits of apple trees for rabbits
A summary of all measurements taken during the experiment is provided in the Supplementary Figure S2.
Zootechnical traits: intake of feed resources, feed quality, and rabbit growth
Pelleted feed intake was measured using a stabilized balance with a 5 g accuracy. Starting when the rabbits were 46 days old, the weight of pelleted feed offered and refused by each group of six rabbits was measured once a week. This process was repeated five times, ending when the rabbits reached 81 days of age.
Apple intake was estimated by collecting and weighing all fruit found within the mobile pen area before and after the pens were moved to a new location, using a stabilized balance with a 10 g accuracy. After the initial weighing, the apples were evenly redistributed within the mobile pen area. Any fruit remaining after the pens were moved was then recollected and weighed. The difference in apple weight at each mobile pen location was used to estimate apple consumption.
Grass intake was estimated at each mobile pen location using the rising-plate method, as described by Plagnet et al. (Reference Plagnet, Bannelier, Fillon and Savietto2023). This method involves the regression of grass DM (oven-dried at 60 °C for at least 48 hours) on grass height-density. In both fields, and prior to allowing the animals to graze, grass height (in mm) was measured at each mobile pen location (40 measurements per pen location) using an electronic plate meter (HerboMETRE®, ARVALIS - Institut du Végétal, Paris, France). For each field, the grass height data were divided into quintiles. Based on this division, 20 sampling locations representing the observed height range were selected to collect grass samples for DM determination. Regression equations of grass DM on grass height were then applied to estimate the biomass available at each mobile pen location. The same procedure was repeated at each location after the grazing period to determine the remaining grass. Grass consumption at each mobile pen location was then estimated by calculating the difference between the available and remaining grass biomass.
The DM content, using the ISO 6496:1999 method, and the CP content, using the ISO 16634-1:2008 method, were determined in samples of apples, grass and pelleted feed. Apples were sampled from the entire AO area 2 weeks after the experiment started. Grass samples, pooled from sub-samples from all pen locations in each field, and pelleted feed samples, taken from every 25 kg bag used in the experiment, were also analyzed. The total DM and CP consumptions were estimated by multiplying the average consumption of apples, grass, and pelleted feed over the entire experimental period using the DM and CP values from the laboratory analyses.
Rabbit growth was determined by weighing each animal once a week from 45 to 80 days of age. Each rabbit was placed in a cardboard box, and its live weight was determined using a stabilized balance with a 5 g accuracy.
Health indicators
Immediately after weighing, a trained veterinarian visually assessed the health status of each rabbit, checking for early signs of digestive (shaggy hair, anal discharge, and dehydration) and respiratory diseases (nasal discharge and coughing), as well as physical injuries. Sick or injured animals were treated individually on site. If special care was required, the rabbit was transferred to the nursery and kept in a controlled environment until full recovery, before being reintroduced to its group. Visual health status was recorded as qualitative descriptive data only. The live weight measurements of all rabbits that received treatment, whether on site or in the nursery, were included in the statistical analysis.
The excretion of oocysts (Eimeria species) was determined on the group level from fecal samples collected inside the mobile pen area at 2, 16, and 30 days after the rabbits gained access to the AO or the GL. Oocyst excretion is an indicator of digestive health commonly assessed in young rabbits (Saunders, Reference Saunders, Mayer and Donnelly2013). Fecal samples obtained from each pen were stored at 4 °C until analysis (less than one week). Before analysis, the samples were gently crushed and homogenized. Then, 3 g of crushed feces were mixed with 42 mL of a saturated saline solution (360 g/L of NaCl in distilled water). The supernatant was then placed in a McMaster chamber for visual oocyst counting under a light microscope (×20 magnification).
Differential white blood cell counts were performed on blood samples collected at 76 and 77 days of age, with half of the animals from each field sampled on each day. The blood samples were collected from the central ear artery (approximately 1.5 mL per rabbit) into EDTA tubes from all alive rabbits (n = 71 rabbits in the AO and 72 in the GL). A few minutes after sampling, a differential count of white blood cells (WBC total, lymphocytes, neutrophils, monocytes, eosinophils and basophils) was performed using a MS9-5 veterinary hematology analyzer (Melet Schloesing, Osny, France), previously calibrated for rabbit blood samples.
Animals diagnosed as sick (based on the visual health examination combined with an individual analysis of oocyst excretion) received antibiotic treatment. Each instance of antibiotic use was recorded, including the number of animals treated, the active compounds administered, and the duration of the treatment for each sick rabbit. This information was documented as descriptive data only.
Welfare indicators
Corticosterone accumulated in the hair of rabbits was used as a proxy for general stress level. To quantify the accumulation of corticosterone in the hair, a patch measuring 50 × 50 mm was shaved using clippers from the dorsal region, just behind the shoulder blades of all the rabbits at 42 days old. This initial hair sample was discarded. At 73 days of age, approximately 250 mg of hair was collected from two rabbits (one male and one female, randomly selected) per mobile pen (n = 24 rabbits in each field) by shaving the same area. Corticosterone concentration in the hair was quantified using an adapted ELISA corticosterone immunoassay, as described by Fetiveau et al. (Reference Fetiveau, Savietto, Fillon, Bannelier, Pujol and Fortun-Lamothe2023b). The assay was performed using the Salimetrics® Salivary Cortisol ELISA Kit (Salimetrics LLC, Carlsbad, CA, USA), following the manufacturer’s instructions.
The air temperature inside the shelters was recorded using six automatic humidity and temperature data loggers (OM-CP-RHTEMP101A, OMEGA, France). The six devices (n = 3 per field) were positioned approximately 10 cm from the shelter’s roof. Each logger was programmed to record one data point every 10 minutes, operating continuously (24 hours a day, 7 days a week). Air temperature data were used as a proxy for the microclimate conditions in the AO and GL.
Assessing the benefits of rabbits for apple trees
The soil mineral content, grass regrowth, leaves on the orchard ground, and apple tree debarking were measured within the apple tree row in areas of the AO without (n = 55 trees) and with rabbits (n = 215 trees). These areas are displayed in the Supplementary Figure S1.
Soil mineral content
Soil samples from the 25 cm upper layer were collected in areas of the AO without rabbits (n = 6 composite samples, one per tree row; all locations together) and in areas of the AO with rabbits (n = 12 composite samples, one per mobile pen; all locations together) using a helical soil sampler. The samples were taken 119 days after the departure of rabbits and sent to a specialized laboratory for quantification of potassium oxide (K2O; AFNOR method NF X 31-108), ammonium (NH4) and nitrate (NO3) ions (AFNOR method NF ISO 14256-2).
Grass regrowth
Grass regrowth was assessed by measuring the herbage height (in cm) with an electronic rising plate meter. Measurements were taken at 94 and 136 days after the departure of rabbits in areas of the AO without rabbits (n = 30 measurements per tree row and measurement date, totaling 360 measurements), and in areas of the AO with rabbits (n = 20 measurements at each pen location, totaling 2 400 measurements).
Leaves on the orchard ground
Leaf samples were obtained by randomly throwing a 50 × 50 cm squared frame four times within each mobile pen location. Sampling was conducted near the trees, within the area covered by the mobile pen area, in areas of the AO without rabbits and with rabbits. In total, 1 m2 was sampled per pen location and in areas of the AO without rabbits. All visible leaves inside the frame were carefully collected into pre-weighted paper bags for DM quantification, following the ISO 6496:1999 method. Leaf samples were collected at 115 days and at 129 days after the departure of rabbits from the orchard.
Apple tree debarking
All apple trees in areas of the AO with rabbits were protected with plastic tree guards (H: 50 x Ø: 11 cm) attached with two strings. In order to assess the damage caused by rabbits to the trees, a categorical score for tree debarking was created: 0 for no debarking, 1 for light debarking (< 5 cm2), 2 for moderate debarking (5–50 cm2), and 3 for severe debarking (> 50 cm2). Tree debarking grades were recorded in January 2023 on all trees exposed to the rabbits at each pen locations. The different pen locations corresponded to the age of rabbits in the periods between 46–53, 53–59, 59–66, 66–73, and 73–91 days of age.
Statistical analysis
All statistical analyses were carried out using R software, version 4.4.2 (https://www.R-project.org/). Equation [1] was used to evaluate the effect of each predictor on the measured variables:

where Y is the studied variable, μ is the average effect, a is the vector of coefficients associated with the fixed effects, b is the vector of coefficients associated with the interactions between the fixed effects, c is the vector of coefficients associated with the random effects, and e is the vector of residuals. Statistical models were adapted depending on the data distribution for each variable. ANOVA was used to evaluate the significance of each effect, along with the Bonferroni test for testing the difference between the systems. Differences were considered significant at an alpha value below 0.05.
Assessing the benefits of apple trees for rabbits
The study design used to support this statistical analysis was the two groups of 72 rabbits, one in the AO with apple trees and one in the GL without trees. Details on the modeling applied to evaluate the effect of predictors on each observed variable, according to equation (1), are provided in the Supplementary Table S1. Visual health status assessment data were used solely to assess the need for antibiotic therapy. Data on antibiotic administration are descriptive, and no statistical analysis was performed on these data.
Assessing the benefits of rabbits to apple trees
The experimental design used to support this statistical analysis was the two areas of the AO: apple trees without rabbits and apple trees with rabbits. Details on the modeling applied to evaluate the effect of predictors on each observed variable, according to equation (1), are presented in the Supplementary Table S2.
Results
Assessing the benefits of apple trees for rabbits
Zootechnical traits: intake of feed resources, feed quality, and rabbit growth
Intake of feed resources (apples, grass, and pelleted feed) is presented in Fig. 2.
Daily intake of feed resources in the apple orchard (AO) and grassland (GL). A. Daily apple intake. B. Daily grass intake. C. Pelleted feed intake. Error bars represent the 95% confidence interval around the estimated marginal means.

Figure 2. Long description
A three-panel set of bar charts labeled A, B, and C. A legend at the bottom indicates orange bars for Apple-Orchard and blue bars for Grassland.
Panel A: A bar chart titled Daily apple intake in grams per rabbit. The x-axis shows five time periods in days: 46 to 53, 53 to 59, 59 to 66, 66 to 73, and 73 to 84. Only orange bars are present, showing a steady decline in apple intake from approximately 75 grams in the first period to 25 grams in the final period. Large error bars indicate high variability.
Panel B: A bar chart titled Daily grass intake in grams of DM per rabbit. The x-axis lists paired time periods for Apple-Orchard and Grassland. Orange bars (AO) fluctuate between 30 and 55 grams. Blue bars (GL) show intake around 40 grams initially, dropping to below 20 grams in the second and fourth periods. Statistical brackets indicate significant differences at period 53 to 61 (P equals 0.023) and 70 to 80 (P is less than 0.001).
Panel C: A bar chart titled Daily pelleted feed intake in grams per rabbit. The x-axis shows five periods from day 46 to 81. Both orange and blue bars show a linear increase over time, starting near 100 grams and ending near 180 grams. Significant differences where Grassland intake is higher than Apple-Orchard are noted in the first two periods: 46 to 53 (P equals 0.001) and 53 to 60 (P equals 0.004).
On average, each rabbit in the AO ingested 49.1 g of apples per day. Due to the high variability in the quantity of apples available in the different pen locations, no statistical effect of the period was observed (Fig. 2A). Depending on the quantity of apples available within each mobile pen area (ranging from 0 to 14.7 kg), the average daily apple intake per rabbit ranged from 0 to 230 g per rabbit.
Differences in the average daily grass intake between the AO and the GL were observed during the second and fourth periods (Fig. 2B). In these periods, the daily intake of grass was 11.7 and 18.9 g of DM per rabbit higher in the AO than in the GL (P < 0.02). Over the entire study period, the average daily grass intake was 38.6 g of DM per rabbit in the AO and 36.2 g of DM per rabbit in the GL (P = 0.69).
During the first two periods, rabbits in the GL consumed more pelleted feed than those in the AO (15.2 and 13.7 g per day, respectively; P < 0.01; Fig. 2C). However, no differences were observed in the subsequent periods (P > 0.52). Overall, rabbits in the GL consumed a total of 5 246 g of feed, compared with 4 996 g in the AO (P < 0.01), representing a 4.7% reduction in pelleted feed intake in the AO relative to the GL.
Average daily intake of DM and CP per rabbit between 46 and 81 days of age, according to feed source (apple, grass, and pelleted feed) is presented in Fig. 3. Total daily DM intake was higher in the AO than in the GL (176.9 vs 164.5 g; P < 0.001; Fig. 3A). In the AO, apples, grass, and pelleted feed accounted for 4.6%, 23.3%, and 72.2% of total DM intake, respectively. In the GL, grass and pelleted feed accounted for 18.5% and 81.5% of the total DM intake, respectively.
Average daily intake of A. dry matter (DM) and B. crude protein (CP) per rabbit between 46 and 81 days of age, according to the feed source (apples, grass, or pelleted feed). Error bars represent the 95% confidence interval around the estimated marginal means.

Figure 3. Long description
Two side-by-side bar graphs labeled A and B. Both share a common legend at the top: Apple (pink), Grass (green), Feed (orange), and Total (white).
Panel A: Average daily dry matter intake (g DM per rabbit).
- The x-axis shows two categories: Apple-Orchard and Grassland.
- The y-axis ranges from 0 to 200.
- In Apple Orchard, intake is approximately 8 for Apple, 41 for Grass, 128 for Feed, and 177 for Total.
- In Grassland, Apple intake is 0, Grass is 31, Feed is 134, and Total is 165.
- Statistical brackets show significant differences between fields for Grass (P < 0.001), Feed (P = 0.001), and Total (P < 0.001).
Panel B: Average daily crude protein intake (g CP per rabbit).
- The x-axis shows Apple Orchard and Grassland.
- The y-axis ranges from 0 to 28.
- In Apple Orchard, intake is near 0 for Apple, 0.9 for Grass, 19.9 for Feed, and 20.8 for Total.
- In Grassland, Apple is 0, Grass is 0.7, Feed is 20.9, and Total is 21.6.
- Statistical brackets show significant differences between fields for Grass (P = 0.002), Feed (P = 0.001), and Total (P = 0.036).
Total daily CP intake averaged 20.8 g in the AO, and 21.6 g in the GL (P = 0.036; Fig. 3B). In the AO, apples, grass, and pelleted feed contributed 0.2%, 4.1%, and 95.7% of total CP intake, respectively, while in the GL, grass contributed 3.2%, and pelleted feed contributed 96.8%.
Growth curves of rabbits in the AO and GL are shown in Fig. 4. At 45 days of age, rabbits assigned to the AO (1 532 g) and the GL (1 563 g) had similar live weights (P = 1.0). Between 45 and 80 days of age, rabbits in the AO showed a slightly higher average daily gain (33.2 g per day) than rabbits in the GL (31.8 g per day; P = 0.042). However, this difference did not affect the final live weight at 80 days, as rabbits in both fields had similar weights (AO vs GL: 2 693 vs 2 675 g; P = 1.0).
Average live weight of rabbits in the apple orchard and grassland between 45 and 80 days of age. Error bars represent the 95% confidence interval around the estimated marginal means.

Figure 4. Long description
A line graph with a grid background.
* The horizontal X axis is labeled Age in days, with markers at 45, 52, 59, 66, 73, and 80.
* The vertical Y axis is labeled Live weight in g, with markers from 1400 to 2800 in increments of 350.
* A legend at the top identifies two groups: Apple Orchard represented by orange circles and a solid red line, and Grassland represented by blue diamonds and a dashed blue line.
* At 45 days, Grassland rabbits start slightly heavier at approximately 1550 g compared to Apple Orchard rabbits at 1500 g.
* Both groups follow a nearly identical upward linear trajectory. By day 66, both groups converge at approximately 2150 g.
* At the final data point of 80 days, both groups reach a peak weight of approximately 2700 g, with the Apple Orchard group finishing slightly higher than the Grassland group.
* Vertical error bars are present at every data point, showing the 95 percent confidence interval.
Health indicators
Excretion of oocysts per gram of feces (OPG) is shown in Fig. 5. The field had no significant effect on the OPG counts from samples collected 2, 16 or 30 days after the rabbits gained access to the mobile pen area (P = 1.0). Regardless of the field, excretion of E. magna was higher at 16 and 30 days compared to samples obtained at day 2 (average: 5 365 vs 516 OPG; P < 0.01). A similar pattern was observed for the other Eimeria species, with average counts of 18 398 vs 1 769 OPG (P < 0.01).
Oocysts per gram of feces by Eimeria species from fecal samples collected 2, 16, and 30 days after the rabbits gained access to either the apple orchard or the grassland. Error bars represent the 95% confidence interval around the estimated marginal means.

Figure 5. Long description
The graph consists of three vertical panels labeled 2 days, 16 days, and 30 days. The Y-axis represents Oocysts per g of faeces with increments of 10,000 from 0 to 30,000. The X-axis categorizes two groups: E. magna and E. other. A legend at the top identifies orange bars as Apple Orchard and blue bars as Grassland.
* In the 2 days panel, all bars are low, near the 0 mark.
* In the 16 days panel, E. magna counts rise to approximately 4,000 for both field types. E. other counts are higher, reaching approximately 14,000 for both field types.
* In the 30 days panel, E. magna counts increase to approximately 7,000. E. other counts show a substantial increase, reaching approximately 23,000 for both field types.
Vertical error bars are present on every bar, showing the 95 percent confidence interval. The error bars for E. other at 30 days are the largest, extending from roughly 15,000 to over 35,000. Across all panels and species, the Apple Orchard and Grassland values remain nearly identical to each other.
The differential counts of WBC populations are shown in Table 2. Neutrophils were the only WBC type with a statistically significant difference in average counts between rabbits in the AO and the GL, with higher values observed in the GL (P = 0.03).
Range and average values (estimated marginal means with SE in parentheses) of white blood cell (WBC) population counts from blood samples of rabbits in the apple orchard or grassland

Table 2. Long description
The table lists white blood cells (WBC) population counts in units of 109 per L.
* Total WBC: Reference range 1.90 to 12.3. Apple-Orchard (n = 71) range 4.12 to 9.87, average 6.21 (S E 0.218), 0 outside range. Grassland (n = 72) range 4.08 to 13.9, average 6.83 (S E 0.228), 1 outside range. P-value 0.050.
* Lymphocytes: Reference range 0.60 to 4.80. Apple Orchard range 1.50 to 4.00, average 2.80 (S E 0.089), 0 outside range. Grassland range 1.90 to 5.00, average 2.90 (S E 0.091), 1 outside range. P-value 0.451.
* Neutrophils: Reference range 0.00 to 7.30. Apple Orchard range 1.30 to 4.70, average 2.51 (S E 0.151), 0 outside range. Grassland range 1.40 to 9.30, average 2.99 (S E 0.164), 1 outside range. P-value 0.030.
* Monocytes: Reference range 0.30 to 0.90. Apple Orchard range 0.40 to 1.20, average 0.62 (S E 0.023), 2 outside range. Grassland range 0.40 to 1.00, average 0.63 (S E 0.024), 1 outside range. P-value 0.619.
* Eosinophils: Reference range 0.00 to 1.00. Apple Orchard range 0.00 to 1.90, average 0.14 (S E 0.040), 1 outside range. Grassland range 0.00 to 2.10, average 0.16 (S E 0.044), 1 outside range. P-value 0.649.
* Basophils: Reference range 0.00 to 0.50. Apple Orchard range 0.00 to 0.10, average 0.01 (S E 0.004), 0 outside range. Grassland range 0.00 to 0.10, average 0.02 (S E 0.006), 0 outside range. P-value 0.113.
1 Reference normal range according to Bigot et al. (Reference Bigot, Savietto, Combes, Fortun-Lamothe and Gunia2024) for healthy crossbred rabbits (both sexes) between 64 and 67 days old.
2 Number of samples outside the reference range.
3 The same sample had high values of total white blood cells, neutrophils, and monocytes.
4 Recompilation of normal range for healthy rabbits (no breed, age, or sex mentioned) from various sources (https://www.medirabbit.com/EN/Hematology/blood_chemistry.htm).
In the AO, three samples (out of 71) were outside the reference range. Specifically, two rabbits exhibited monocyte counts of 1.2 × 10⁹ cells/L, while one rabbit had an eosinophil count of 1.9 × 10⁹ cells/L. In the GL, three samples (out of 72) were outside the reference range. One rabbit showed elevated counts of total white blood cells, neutrophils, and monocytes. Another rabbit had a lymphocyte count of 5.0 × 10⁹ cells/L, and a third rabbit exhibited an eosinophil count of 2.1 × 10⁹ cells/L.
Despite one or more values being outside the reference range for these six individuals, all rabbits were assessed by a trained veterinarian and found to be in good visual health at the time of blood sampling.
The administration of antibiotics was recorded as descriptive data (Supplementary Table S3). This included the number of animals treated, the antibiotics used, and the duration of treatment. The average duration of antibiotic treatment per sick animal was 7.5 days. During this period, a total of 1 650 mg of Bacivet S (Bacitracin 4 200 IU) and 4 905 mg of Corylap (Sulfadimethoxine 75 mg and Trimethoprim 15 mg) were administered. A total of 11 animals received treatment.
In the AO, four animals received treatment, three in the field for mild symptoms and one in the nursery for diarrhea associated with high OPG counts. In the GL, seven rabbits received treatment, five in the field for mild symptoms and two in the nursery for diarrhea with high OPG counts.
The first rabbit treated was 58 days old and lived in the GL. The last two rabbits treated were 62 days old at the start of treatment and lived in the AO. Despite vaccination, one rabbit in the AO died of myxomatosis at 75 days old.
Welfare indicators
Corticosterone accumulated in the hair of rabbits is presented in Supplementary Figure S3. Between 42 and 73 days of age, rabbits in the AO (2.09 pg/mg of hair) and in the GL (2.14 pg/mg of hair) exhibited similar levels of accumulated hair corticosterone (P = 0.725).
Daily air temperature recorded inside the shelters is presented in Supplementary Figure S4. The minimum and maximum temperatures at AO were 4.5 °C and 30.7 °C, respectively, whereas the temperatures at GL ranged from 2.3 °C to 31.2 °C. The average daily thermal amplitude inside the shelters at AO was 1.5 °C lower than at GL, with mean amplitudes of 11.6 and 13.1 °C, respectively (P < 0.001).
Assessing the benefits of rabbits for apple trees
Soil mineral content
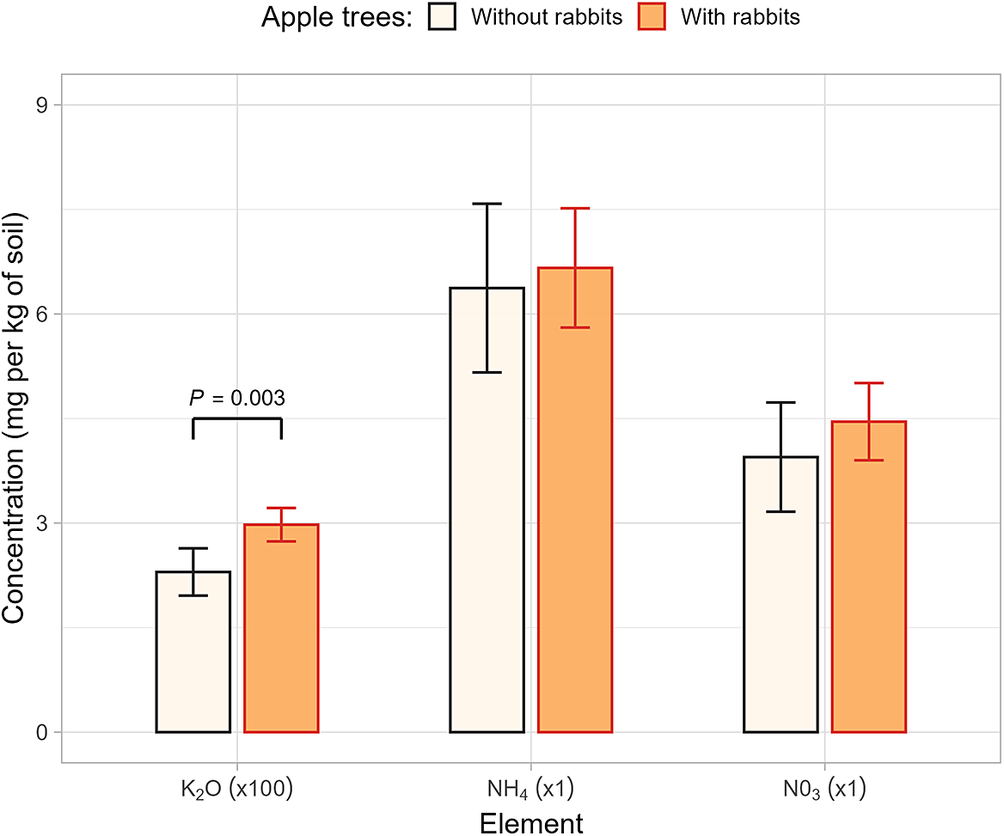
The presence of six rabbits (about 19.0 m2 for 7 days) within the tree rows increased the potassium soil content by 29.6%, reaching 297.7 mg/kg of DM, compared with 229.8 mg/kg of DM in soil samples taken from AO areas without rabbits (P = 0.003). No differences in ammonium or nitrate were observed (Fig. 6). Despite the absence of differences in ammonium and nitrate at AO, the former positions of the mobile pens were visible as darker green patches (qualitative visual assessment) in the drone photographs taken at the GL at 144 days after the rabbit departure (see Supplementary Figure S5A and B, no filter).
Soil concentrations of potassium oxide (K20), ammonium (NH4), and nitrate (NO3) ions measured at 119 days after the departure of rabbits, in areas beneath the apple trees without or with prior rabbit presence. For K20, multiply the values shown in the figure by 100 to obtain the actual measured concentrations. Error bars represent the 95% confidence interval around the estimated marginal means.

Figure 6. Long description
A bar chart with a vertical y-axis labeled Concentration in m g per kg of soil, ranging from 0 to 9. The horizontal x-axis is labeled Element and contains three categories. A legend at the top indicates that white bars represent Apple-Orchard without rabbits and orange bars represent Apple-Orchard with rabbits.
* K2 O (times 100): The white bar is at approximately 2.2 and the orange bar is at 3.0. A bracket above these bars indicates a significant difference with P equals 0.003.
* NH4 (times 1): The white bar is at approximately 6.4 and the orange bar is slightly higher at 6.8. Both have large error bars.
* NO3 (times 1): The white bar is at approximately 4.0 and the orange bar is at 4.5.
All bars include vertical error bars representing 95 percent confidence intervals. The orange bars are consistently higher than the white bars across all three elements.
Grass regrowth
At day 94 after the rabbit departure, grass height (see Supplementary Figure S6) in AO areas with rabbits was significantly lower compared to areas without rabbits (2.2 vs 4.0 cm, respectively; P < 0.001). No significant difference was observed at day 136 (6.9 vs 7.7 cm, respectively; P = 0.089). Between day 94 and day 136, grass height increased by 5.5 cm in the areas with rabbits and by 3.3 cm in the areas without rabbits.
Leaves on the orchard ground
The quantity of leaves on the orchard ground is shown in Supplementary Figure S7. At 115 days after the rabbit departure, leaf quantity was 2.8-fold lower in AO areas with rabbits than in areas without rabbits (30.6 vs 84.8 g of DM/m2, respectively; P < 0.001).
Although not statistically significant, a similar pattern was observed 14 days later, with 13.7 and 39.9 g of DM/m2 in areas with and without rabbits (P = 0.065). Between 115 and 129 days, leaf quantity decreased by 55.2% in areas with rabbits (from 30.6 to 13.7 g of DM/m2; P = 0.128) and by 52.9% in areas without rabbits (from 84.8 to 39.9 g of DM/m2; P = 0.008).
Apple tree debarking
Tree debarking incidence is shown in Fig. 7. Over the entire period, rabbits gnawed 35 out of 215 exposed trees (about 16.3%). Most damage occurred during the last three periods, totaling 34 damaged trees. Debarking degree also varied. Light debarking was observed in 10 of the 35 damaged trees (about 28.6%). Moderate debarking occurred in the third (n = 8 trees), fourth (n = 3 trees), and fifth (n = 8 trees) periods, representing 54.3% of cases. Severe debarking was observed in one tree in the third period and in five trees in the fifth period, representing 17.1% of all cases.
Incidence and degree of debarking on apple trees exposed to the rabbits during each measurement period (corresponding to rabbit age, in days). Debarking categories: None (0 cm2), Light (< 5 cm2), Moderate (5–50 cm2), and Severe (> 50 cm2).

Figure 7. Long description
A stacked bar chart with a horizontal x-axis labeled Period in days and a vertical y-axis labeled Relative frequency from 0 to 100. A legend at the top identifies four categories: None (white), Light (blue), Moderate (orange), and Severe (red).
From left to right, the five periods show the following distributions:
* Period 46 to 53: 97.5 percent None and 2.50 percent Light.
* Period 53 to 59: 100 percent None.
* Period 59 to 66: 72.9 percent None, 8.30 percent Light, 16.7 percent Moderate, and 2.10 percent Severe.
* Period 66 to 73: 85.6 percent None, 7.20 percent Light, and 7.20 percent Moderate.
* Period 73 to 91: 66.7 percent None, 4.40 percent Light, 17.8 percent Moderate, and 11.1 percent Severe.
The chart indicates that debarking incidence and severity generally increase in the later periods, particularly after day 59.
The probability of tree damage was 2.5% in the first period and increased in the last three periods to 27.1%, 14.3% and 33.3%, respectively. A statistically significant difference was observed only between the first and fifth period (P = 0.026). No debarking was observed on trees without rabbits because the electric fence protected the trees from a potential attack by the local fauna (wild rabbits and hares).
Discussion
Association between rabbits and apple trees
Benefits of apple trees for rabbits
Our findings indicate several benefits of integrating rabbits into an apple-orchard. The trees provided diverse food resources, including fruits, leaves, grass, and branches, a milder microclimate with reduced temperature fluctuations, and a more complex living environment. Together, these features promoted health and welfare compared with rabbits raised in open-pasture systems without trees (Fetiveau et al., Reference Fetiveau, Savietto, Bannelier, Fillon, Despeyroux, Pujol and Fortun-Lamothe2023a, Reference Fetiveau, Savietto, Fillon, Bannelier, Pujol and Fortun-Lamothe2023b; Fetiveau et al., Reference Fetiveau, Savietto, Janczak, Bannelier, Plagnet, Tauveron and Fortun-Lamothe2023c).
Rabbits were generally healthy and pelleted feed intake was 4.7% lower in the AO than in the GL during the first 2 weeks after weaning, a critical period for weaning rabbits (Gidenne and Fortun-Lamothe, Reference Gidenne and Fortun-Lamothe2002). Reduced pelleted feed intake during this period may help minimize the risks of digestive disorders as reported by Gidenne et al. (Reference Gidenne, Combes, Feugier, Jehl, Arveux, Boisot, Briens, Corrent, Fortune, Montessuy and Verdelhan2009) on feed restriction strategies.
Coccidiosis, a common parasitic risk for young rabbits (Grès et al., Reference Grès, Voza, Chabaud and Landau2003), affected around 8% of animals, with no deaths observed. Contributing factors linked to the absence of deaths include: (i) the pre-weaning administration of anti-coccidia treatment, (ii) the displacement of mobile pens to maintain clean grazing areas, (iii) the close and frequent examination of each animal, (iv) the targeted antibiotic treatment of sick animals, and (v) the isolation of severely affected individuals. These management practices appear to have supported the positive health outcomes observed.
Behavioral and emotional assessments (detailed by Fetiveau et al., Reference Fetiveau, Savietto, Janczak, Fortun-Lamothe and Fillon2024) indicate that apple trees enhanced sociability toward humans and moderated stress, potentially acting as an emotional buffer. Trees also supported natural behaviors, reducing the drive to explore unfamiliar objects, and the lower thermal amplitude in the AO likely contributed to the rabbits’ thermal comfort. Observations of rabbits resting against trees during the day (author’s personal observation; see Supplementary Figure S8) suggest the trees were perceived as a protective factor. Although the European rabbit often uses burrows for shelter, above-ground resting near structural elements is common, particularly near forest edges (Kolb, Reference Kolb1991). Similar findings have been reported for wild rabbits using bushes and shrubs to access food and shelter more efficiently, reducing home range size (Lombardi, Fernández, and Moreno, Reference Lombardi, Fernández and Moreno2007). The presence of humans providing daily care may reinforce this protective effect, but further research is needed to confirm whether rabbits perceive trees, humans, or both as protective elements.
Despite these environmental differences, hair corticosterone levels were similar between AO and GL, suggesting comparable stress and activity levels. Values were lower than those reported for rabbits with limited access (less than 8 hours) to grazing (average, 3.2 pg/mg of hair; Fetiveau et al., Reference Fetiveau, Savietto, Fillon, Bannelier, Pujol and Fortun-Lamothe2023b), but similar to rabbits with unrestricted access (approximately 2.2 pg/mg of hair; Fetiveau et al., Reference Fetiveau, Savietto, Bannelier, Fillon, Despeyroux, Pujol and Fortun-Lamothe2023a). Overall, both fields offered adequate living conditions.
Zootechnical outcomes aligned with industry standards. For comparison, Read et al. (Reference Read, Combes, Gidenne, Destombes, Bébin, Balmisse and Fortun-Lamothe2016) reported live weights of 2.3 kg and mortality rates ranging from 1.7% to 4.8% at 70 days in indoor-caged rabbits. In the present study, rabbits reached 2.4 kg at 73 days with only one mortality observed. These results also exceed typical standards in organic production systems (Gidenne et al., Reference Gidenne, Fortun-Lamothe, Huang and Savietto2024).
Benefits and limitations of rabbits for apple trees
Rabbits provided several ecosystem services to the AO, including soil fertilization, weed control, and sanitation. On average, six rabbits occupying approximately 19 m2 for one week increased soil potassium concentration by 29.6%. However, no increase was observed for nitrogen, likely due to the delayed sampling and the high mobility of this element in soil, which is particularly prone to leaching and plant uptake. These findings are consistent with Islas-Valdez et al. (Reference Islas-Valdez, Lucho-Constantino, Beltrán-Hernández, Gómez-Mercado, Vázquez-Rodríguez, Herrera and Jiménez-González2017), who reported that rabbit manure contained 322 mg/L potassium and 455 mg/L of nitrogen, and increased soil concentration of K, Cu, Zn, Na, and Mg following its use.
Rabbits also delivered effective weed control and sanitation services. They consumed all the available grass and readily consumed fallen apples. In addition, rabbits fed on leaves, gnawed branches, and damaged spontaneous forest trees growing in the orchard. These observations confirm previous pilot studies demonstrating the grazing and sanitation potential of rabbits in orchards (Savietto et al., Reference Savietto, Fillon, Temple-Boyer--Dury, Derbez, Aymard, Pujol, Rodriguez, Borne, Simon, Grillot, Lhoste, Dufils and Drusch2023).
Leaf litter was markedly reduced in areas with rabbits. This may be explained by both leaf consumption and accelerated leaf decomposition. Faster leaf decomposition may have resulted from mechanical fragmentation by rabbit activity (rabbits walked, scratched, and rested on the leaves), stimulation of soil microbial communities via fecal inputs (Zapata Martínez et al., Reference Zapata Martínez, Serrano, Aguilera Flores and Villa-Gómez2019), and increased organic matter and nutrient availability supporting decomposer organisms. Accelerated leaf degradation may provide prophylactic benefits by reducing pathogen reservoirs. For instance, Gomez et al. (Reference Gomez, Brun, Chauffour and De Le Vallée2007) showed that leaf litter removal reduced apple scab incidence by 82.5% and 54.6% over two consecutive years. However, this regulatory service could not be confirmed because of the proximity of AO areas with and without rabbits. Future studies with separated plots (at least 25 m apart) should be designed to properly assess scab regulation effects.
Tree debarking was the primary limitation observed. Moderate and severe damage occurred mainly during the third and fifth grazing periods. In the third period, damage was related to inadequate installation of the tree guards and rabbits learning to remove them. In the fifth period, severe damage likely resulted from rabbits being large enough to reach the trunks above the tree guards and from an extended duration in the same location (18 days), which depleted grass. Once grass was consumed, rabbits began gnawing exposed trunk sections above the tree guards.
Despite this limitation, effective technical solutions exist. Properly designed tree guards, adapted to trunk circumference and of sufficient height, could reduce debarking risk to near zero. Importantly, the incidence of debarking risk observed here was substantially lower than that reported for other livestock species used in orchards. López-Sánchez et al. (Reference López-Sánchez, Perea, Roig, Isselstein and Schmitz2020) reported debarking rates of 72%, 70%, and 62% for cattle, horses, and sheep, respectively. These findings suggest that rabbits provide effective grazing and sanitation services while posing a comparatively lower risk of tree damage.
Limitations of this proof-of-concept
Although our findings indicate mutual benefits for both rabbits and apple trees, this proof-of-concept study was limited to a single, limited-scale trial (under 1 ha), conducted during autumn and implemented under expert supervision. Replication under a wider range of environmental, technical, and management conditions is therefore required to assess the generalizability and scalability of this approach.
Furthermore, the orchard used in this study (17-year-old) was cut down shortly after the experiment ended, preventing the assessment of longer-term effects. Consequently, the potential influence of rabbits on tree growth, fruit yield, and overall orchard resilience remains unknown, as does the cumulative effects of their continuous presence over multiple years.
Operational adjustments are necessary to minimize the risk of tree damage. In particular, tree guards must be adapted to both the size of fast-growing rabbits and the circumference of mature tree trunks. In addition, maintaining abundant and accessible grass resources appears essential to divert rabbits from gnawing trees. This may require the design of grass covers capable of producing sufficient quantities of high-quality biomass while avoiding excessive competition with trees for water and nutrients. When combined with appropriate animal management, these measures should substantially reduce debarking risks.
The current orchard design was not well suited to integrating animals. High tree density, the trellising system, and training practices promoting numerous low branches reduced the working ergonomics and increased the risk of accidents. For example, head impacts with branches while working inside the pens were frequent. Greater spacing between trees and training practices such as vase-shaped forms without trellising could improve working conditions and facilitate animal management. These proposed modifications to the orchard design may affect orchard productivity. Accordingly, the system design should also focus on producing both forage and rabbits to offset any potential reduction in fruit yield per unit of land area. The regulating services provided by animals to the orchard may also positively affect the orchard’s production costs; however, specific studies are required to assess these impacts.
Overall, our study demonstrates the potential for reciprocal services between rabbits and apple trees to contribute to a more sustainable production system, while also highlighting key areas for technical optimization. This approach opens promising perspectives for the development of innovative and integrated crop-livestock systems.
Perspective for agroecological transition
The proposed association aligns with the current definition of agroecology (Gliessman, Reference Gliessman2018), encompassing both its scientific and practical dimensions. Although agroecology as a social movement was not the primary focus, this work contributed to a parallel sociological investigation examining barriers to the implementation of similar initiatives within a research institute. These barriers include job specialization, socio-cultural differences among stakeholders, and regulatory constraints, among others (Derbez, Lhoste, and Grillot, Reference Derbez, Lhoste and Grillot2025).
While economic analysis was beyond the scope of this study, integrating rabbit farming into orchards could reduce certain orchard management costs, particularly those associated with weed control and sanitation. These animal services may provide both economic and ecological benefits. However, wider adoption will depend on multiple factors, including technical feasibility, ergonomics, economic viability, and market access. Orchardists may need to acquire animal husbandry skills, while rabbit farmers interested in diversification would need training in orchard management. Fruit producers could also partner with rabbit farmers to place the animals in their fields, creating a mutually beneficial arrangement. In any case, a more integrated, knowledge-sharing approach will be essential to evaluate the socioeconomic feasibility of this model within current and evolving agricultural systems.
This study provides a concrete example of how multispecies farming systems can contribute to the agroecological transition. By promoting nutrient cycling, improving resource use efficiency, and fostering cross-disciplinary knowledge exchange, the association between rabbits and apple trees reflects key agroecological principles. It also supports animal welfare, reduces the use of antibiotics and chemical inputs, and may contribute to improving ecosystem health and food safety.
Although further research is required to confirm long-term outcomes, this proof-of-concept study illustrates the potential of locally adapted, integrated systems to address multiple challenges in sustainable agriculture.
Conclusion
This proof-of-concept study highlights the potential of integrating rabbits into apple-orchards as a mutually beneficial association. Apple trees provided rabbits with a diversified diet, a milder microclimate, and a structurally complex environment that supported health, welfare, and productive performance. In return, rabbits delivered key ecosystem services to the orchard, including soil fertility and effective weed control. It may potentially contribute to orchard sanitation through the removal and accelerated decomposition of leaf litter, but further research is required to demonstrate this regulatory service.
Tree debarking was identified as the main technical limitation, but this risk can be effectively mitigated through appropriate tree protection and grazing management. Importantly, the level of damage remained substantially lower than that reported for other grazing livestock, confirming the suitability of rabbits as a low-impact species for orchard integration.
While cost analysis was beyond the scope of this study, rabbit grazing could reduce orchard costs related to weeding management. However, successful implementation depends on farmer training and the development of cross-disciplinary skills. Further socioeconomic research is also needed to evaluate the viability and scalability of such systems in diverse farming contexts.
Overall, this proof-of-concept study demonstrates how interspecific services can support more sustainable and efficient production systems. By reducing reliance on external inputs and encouraging innovative crop-livestock integrations, the rabbit–orchard association offers a pathway for designing tailored agroecological solutions.
Supplementary material
The supplementary material for this article can be found at http://doi.org/10.1017/S1742170526100568.
Data availability statement
Original data are publicly available at https://doi.org/10.57745/DQCZGQ.
Acknowledgments
We acknowledge P. Asencio, P. Aymard, M. Despeyroux, M. Fetiveau, A. Guillermin, S. Leroux, F. Merlin, and F. Richard for their technical support and expertise. We thank L. Riaboff and A.S. Villain for their valuable comments on early versions of this manuscript. Special thanks go to the associations GRAAL, Ethosph’R, and White Rabbit for their assistance in the rabbit adoption process, and to all the rabbits we had the privilege to work with.
During the preparation of this manuscript, the corresponding author used OpenAI ChatGPT (https://chat.openai.com/) for grammar review and language editing, applying UK-English spelling conventions. Following the use of this tool, the corresponding author carefully reviewed and edited the manuscript and takes full responsibility for its content
Author contributions
Conceptualisation: D.S., V.F., A.R., S.B., S.S., M.G., F.D., S.D.; Data Curation: D.S.; Formal analysis: D.S., S.D.; Funding acquisition: D.S.; Investigation: D.S., V.F., C.B., A.R., K.M., S.D.; Methodology: D.S., V.F., S.B., S.S., M.G., F.D., S.D.; Project administration: D.S., S.D.; Supervision: D.S., V.F., S.D.; Resources: C.B., A.R., K.M.; Visualization: D.S.; Writing - Original Draft: D.S.; Writing - Review & Editing: V.F., C.B., A.R., K.M., S.B., S.S., M.G., F.D., S.D.
Funding statement
This study received financial support from INRAE through the metaprogramme METABIO - LAPOESIE exploratory project (2020-2022). INRAE - METABIO had no role in the design, analysis, or writing of this article.
Competing interests
The authors declare no conflict of interest of any sort.
Ethical standards
Animals were handled in compliance with the EU Directive 2010/63/EU and the French Decree 2013-118 on the protection of animals used for scientific purposes. All procedures were approved by the French Ministry of Higher Education and Research (Agreement Number: 35391-2021091717004334v6).




 Open access

