INTRODUCTION
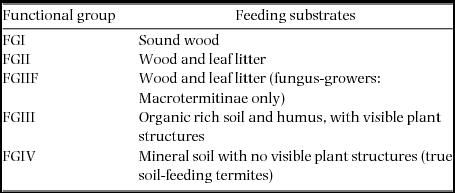
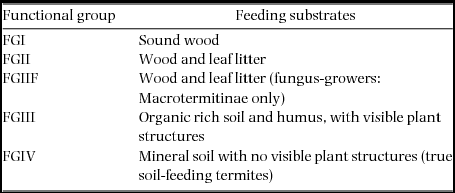
Termites (Blattodea: Termitoidae) are dominant invertebrate decomposers of dead organic matter in tropical and subtropical terrestrial regions (Bignell & Eggleton Reference BIGNELL, EGGLETON, Abe, Bignell and Higashi2000). They are important ecosystem engineers that affect physical and chemical composition of soil through the breakdown and fixation of carbon and nitrogen, as well as the translocation of soil via the construction of mounds, tunnels and runways (Brussaard Reference BRUSSAARD1997, Jones et al. Reference JONES, LAWTON and SHACHAK1994, Jouquet et al. Reference JOUQUET, DAUBER, LAGERLÖF, LAVELLE and LEPAGE2006, Reference JOUQUET, TRAORÉ, CHOOSAI, HARTMANN and BIGNELL2011). Termites feed on a range of dead organic plant-derived matter and have been classified into five functional groups depending on the humification (decomposition) of the substrate that they feed on (Donovan et al. Reference DONOVAN, EGGLETON and BIGNELL2001a, Inward et al. Reference INWARD, VOGLER and EGGLETON2007) (Table 1).
Classification of termite functional groups and respective feeding substrates within tropical rain forests. Modified from Donovan et al. (Reference DONOVAN, EGGLETON and BIGNELL2001a) and Inward et al. (Reference INWARD, VOGLER and EGGLETON2007).
At present we have a relatively good understanding of tropical termite diversity patterns through sampling of termite species density using a standardized transect protocol (Davies et al. Reference DAVIES, EGGLETON, JONES, GATHORNE-HARDY and HERNANDEZ2003, Eggleton et al. Reference EGGLETON, HOMATHEVI, JONES, MACDONALD, JEEVA, BIGNELL, DAVIES and MARYATI1999, Palin et al. Reference PALIN, EGGLETON, MALHI, GIRARDIN, ROZAS-DAVILA and PARR2010). Studies have shown that there is a clear difference in termite functional diversity among the main tropical rain-forest regions: for example, large-bodied soil-feeding termite lineages dominate in Africa (Davies et al. Reference DAVIES, EGGLETON, JONES, GATHORNE-HARDY and HERNANDEZ2003, Eggleton et al. Reference EGGLETON, WILLIAMS and GASTON1994), and Macrotermitinae (fungus-growing termites) are completely absent from South America (Aanen & Eggleton Reference AANEN and EGGLETON2005, Davies et al. Reference DAVIES, EGGLETON, JONES, GATHORNE-HARDY and HERNANDEZ2003, Eggleton et al. Reference EGGLETON, WILLIAMS and GASTON1994, Jones & Eggleton Reference JONES, EGGLETON, Bignell, Roisin and Lo2011). These functional differences have been referred to as the ‘termite functional diversity anomaly’ (Davies et al. Reference DAVIES, EGGLETON, JONES, GATHORNE-HARDY and HERNANDEZ2003). The functional diversity anomaly has been shown to exist even when different types of land (cleared and lacking canopy to old-growth forests) have been compared (Davies et al. Reference DAVIES, EGGLETON, JONES, GATHORNE-HARDY and HERNANDEZ2003, Eggleton et al. Reference EGGLETON, WILLIAMS and GASTON1994).
Although data on density of termite species and variation among continents in key functional groups are important for our understanding of assemblage structure and ecosystem processes, we do not yet know exactly how biomass and abundance are distributed among species. Therefore, the documented differences in functional diversity among regions (Davies et al. Reference DAVIES, EGGLETON, JONES, GATHORNE-HARDY and HERNANDEZ2003) need to be supplemented with biomass and abundance data if the impact of termites on ecosystem processes is to be quantified. However, comparable biomass and abundance data on termites are sparse (Bignell & Eggleton Reference BIGNELL, EGGLETON, Abe, Bignell and Higashi2000, Eggleton et al. Reference EGGLETON, BIGNELL, SANDS, MAWDSLEY, LAWTON, WOOD and BIGNELL1996, Reference EGGLETON, HOMATHEVI, JONES, MACDONALD, JEEVA, BIGNELL, DAVIES and MARYATI1999; Jones & Eggleton Reference JONES, EGGLETON, Bignell, Roisin and Lo2011) because these data are exceptionally time consuming to collect. Combining data from the literature with newly collected data from Peru, our study is novel in that we provide the first preliminary data to test whether the termite functional anomaly is found also for biomass and abundance across the equatorial regions.
We compare biomass and abundance estimates across three equatorial tropical forest regions (Africa (Cameroon), south-east Asia (Malaysian Borneo), South America (Peru)) to investigate whether the functional diversity anomaly exists for biomass and abundance data within functional groups. We aimed to (1) compare species density data for functional groups from the three study sites to confirm the existence of the functional diversity anomaly across our study areas, (2) compare biomass and abundance data for termite functional groups across the three sites, (3) explore the potential causes (termite evolutionary history or present-day climate) of the uncovered differences, and (4) discuss the implications of these differences for ecosystem processes across the main tropical forest blocks.
METHODS
Compilation of data
Biomass and abundance data from Cameroon and Malaysia were gathered from Eggleton et al. (Reference EGGLETON, BIGNELL, SANDS, MAWDSLEY, LAWTON, WOOD and BIGNELL1996), and Eggleton et al. (Reference EGGLETON, HOMATHEVI, JONES, MACDONALD, JEEVA, BIGNELL, DAVIES and MARYATI1999) and Homathevi (unpubl. data), respectively. Samples for the Peru data were obtained by CALD in 2011.
Study sites
Sampling was conducted in relatively undisturbed tropical rain-forest sites in Cameroon, Malaysia (Sabah, Borneo), and Peru. Full site details are provided in Table 2.
Site descriptions and data sources. Many of the tropical rain forests in Africa are at a higher elevation than lowland forests on other continents as they are located on the central continental plateau (see Davies et al. Reference DAVIES, EGGLETON, JONES, GATHORNE-HARDY and HERNANDEZ2003 and Eggleton et al. Reference EGGLETON, BIGNELL and HAUSER2002 for examples of African forest site altitudes). It can therefore be argued that most African forests at an altitude similar to the one in Cameroon are considered lowland forests and therefore justifies the comparison of Cameroon with Malaysia and Peru.

Sampling
In each site species density measurements (the number of species per square metre) were sampled using a standardized belt transect (100 × 2 m) (Eggleton et al. Reference EGGLETON, BIGNELL, SANDS, WAITE, WOOD and LAWTON1995, Jones & Eggleton Reference JONES and EGGLETON2000). Each transect was divided into 20 sections (5 × 2-m) in which termites from 12 soil pits (12 × 12 × 5 cm) and from all dead wood, nests and runways were collected for one person-hour. Four transects were sampled in Malaysia (Eggleton et al. Reference EGGLETON, HOMATHEVI, JONES, MACDONALD, JEEVA, BIGNELL, DAVIES and MARYATI1999) and Cameroon (Eggleton et al. Reference EGGLETON, BIGNELL, SANDS, WAITE, WOOD and LAWTON1995) while six transects were sampled in Peru by CALD.
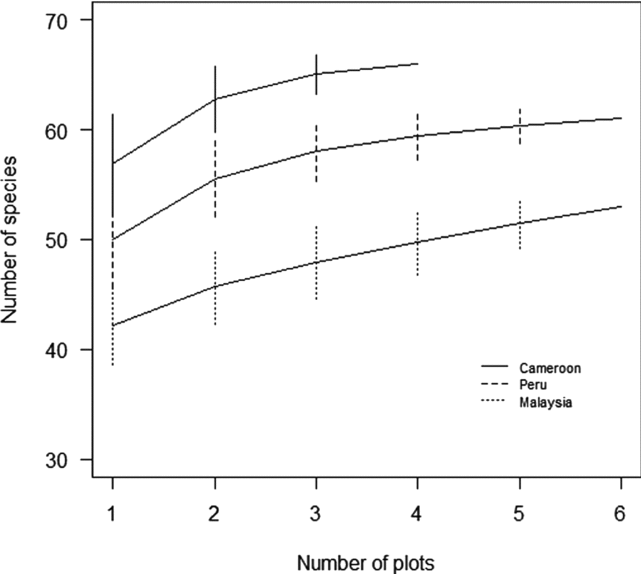
Sampling for biomass and abundance took place in four plots in Cameroon (two old-growth forest plots and two old regenerating forest plots), and six plots each in Malaysia (three old-growth forest plots and three regenerating forest plots) and Peru (six old-growth forest plots). Non-old-growth forest plots were chosen to be as comparable as possible to old-growth forests. At all sites plots were chosen to represent the main forest type and to take into account the natural variability of vegetation structure. A standardized quantitative sampling protocol based on 2 × 2-m quadrats was used in all three study sites following Eggleton et al. (Reference EGGLETON, BIGNELL, SANDS, MAWDSLEY, LAWTON, WOOD and BIGNELL1996). Broadly, the same method was used across all sites with slight variation in soil pit volume, and size and number of quadrats (Table 2). The effect of the differences in sampling effort on species encounters were examined by species rarefaction curves. The rarefaction curves clearly showed that Cameroon had the highest species richness while Malaysia had the lowest species richness despite the low sampling effort in Cameroon and the high sampling effort in Malaysia (Figure 1). As these results did not affect the outcome of this study, all values were made comparable by scaling them to unit area (m2). As this is the first time data from the Peruvian site has been published, a detailed account of the sampling methods is given below.
Species rarefaction curves (± SD) from Cameroon, Peru and Malaysia. Species richness data were collected in quadrats (2 × 2 m). Although Cameroon had the lowest number of plots it had the highest number of species. Malaysia with six plots and the highest number of quadrats (20 per plot) had the lowest number of species suggesting that Cameroon may have increased its dominance over Malaysia and Peru had the sampling effort been equal.
In Cameroon, four 30 × 20-m plots were created in old-growth and old regenerating forest. Termites from all dead wood in 10 quadrats per plot were sampled as well as all termites in 20 × 20 × 50-cm soil pit in the centre of each quadrat.
In Malaysia, six 50 × 50-m plots were set-up in old-growth and two ages of regenerating forest. No significant composition or abundance differences were found between the forest types (Homathevi, unpubl. data).Termites were sampled in dead wood in 20 quadrats per plot. Termites in 30 × 30 × 25-cm soil pits in the centre of each quadrat were also sampled (see Eggleton et al. Reference EGGLETON, BIGNELL, SANDS, MAWDSLEY, LAWTON, WOOD and BIGNELL1996 and Eggleton et al. Reference EGGLETON, HOMATHEVI, JONES, MACDONALD, JEEVA, BIGNELL, DAVIES and MARYATI1999 for a more detailed description of the sampling methods in Cameroon and Malaysia).
In Peru, six 60 × 50-m plots were set-up at least 300 m apart. Each plot was divided into six subplots (10 × 50-m each) of which two in each plot were used for the surveys reported in this paper. Those were spaced 30 m apart. Ten 2 × 2-m quadrats, spaced 5 m apart, were placed in each plot and split between the two subplots, five quadrats in each. Within each quadrat, the total number of worker termites in all dead wood greater than 20 mm diameter were subsampled and extrapolated. Small branches were broken open while larger logs were subsampled with a saw before being split open to extract the termites. In addition, all termites were manually extracted from one soil pit (25 × 25 × 10-cm depth) in the centre of each quadrat. Termites were preserved in 70% alcohol and processed and identified at the Natural History Museum in London (NHM).
Identification
Details of the identification methods for the Cameroonian and Malaysian termites are given in Eggleton et al. (Reference EGGLETON, BIGNELL, SANDS, MAWDSLEY, LAWTON, WOOD and BIGNELL1996) and Eggleton et al. (Reference EGGLETON, HOMATHEVI, JONES, MACDONALD, JEEVA, BIGNELL, DAVIES and MARYATI1999). Termites sampled in Peru were identified by CALD at NHM. Existing species names were given to as many of the specimens as possible. Where soldiers were present these were identified to genus with the key to Neotropical termite genera by Constantino (Reference CONSTANTINO2002), and to species level with identification keys and the NHM collection. Where soldiers were absent, worker gut morphology (including the enteric valve structure) was compared with samples in NHM collection. Soldierless termites were identified to genus and species level with L.M. Hernańdez's (unpubl.) key to the Apicotermitinae of the Guiana Shield.
Functional group classification
Termites can be classified into five feeding groups by the level of ‘humification’ (decomposition) of the organic matter upon which they feed (Donovan et al. Reference DONOVAN, EGGLETON and BIGNELL2001a, Eggleton & Tayasu Reference EGGLETON and TAYASU2001). The groups range from wood-feeding to soil-feeding termites (Table 1). Wood-feeding termites in FGI feed at the top of the humification gradient and include all wood-feeding termites outside the Termitidae. All other feeding groups, including wood-feeding termites in FGII, fungus-growing termites in FGIIF, humus-feeding termites in FGIII and true soil-feeding termites in FGIV (Donovan et al. Reference DONOVAN, EGGLETON and BIGNELL2001a, Inward et al. Reference INWARD, VOGLER and EGGLETON2007), are in the Termitidae. Only FGIIF use external fungi (Termitomyces: Basidiomycotina) for decomposition of organic matter. They also have, along with all other termites, a complex community of symbiotic gut bacteria, Archaea and protists (Hongoh Reference HONGOH2010) which vary in composition and abundance with the degree of humification of the feeding substrate (Brauman et al. Reference BRAUMAN, DORÉ, EGGLETON, BIGNELL, BREZNAK and KANE2001).
Analysis
Biomass and abundance data were estimated for worker termites only as soldiers represented a small proportion of the total number of individuals. In the majority of the termite species in this study soldiers represented less than 5% of the individuals while 30–40% of the species did not include soldiers at all (Anoplotermes-group). Nasutitermes (and other Nasutitermitinae) is the exception with approximately 25% of all individuals being soldiers (Vasconcellos & Moura Reference VASCONCELLOS and MOURA2010). The biomass and abundance measurements for Nasutitermes may therefore have been underestimated, however, this was favoured over the potential error caused by comparing species which did not have soldiers to species with soldiers.
Rarefaction curves were produced using species richness data collected from quadrats in order to examine the effect of the different sampling efforts across sites. The mean masses of worker termites were calculated using the equation M = 3.72w, where M is the mass in mg and w is the mean head width in mm (modified slightly from Eggleton et al. Reference EGGLETON, BIGNELL, SANDS, MAWDSLEY, LAWTON, WOOD and BIGNELL1996). The equation constant (3.71) was produced by regressing head width and body mass data and forcing the slope through zero (to prevent small-bodied speices having negative masses). As termite worker morphology is conservative the mass equation was used to calculate the mass of species in this study. The biomass density was calculated as the product of M and abundance (ind m−2). Biomass and abundance data from the quadrats in each plot were pooled and log(x+1)-transformed prior to analysis. The replicate unit is the individual plot. One-way ANOVAs were used to examine statistical differences in mean biomass and abundance among the biogeographical areas examining each feeding group separately. Phylogenetic structure in the data was visualized using a phylogenetic tree based on the trees in Lo & Eggleton (Reference LO, EGGLETON, Bignell, Roisin and Lo2011). Analyses were conducted using R (version 2.15.3).
RESULTS
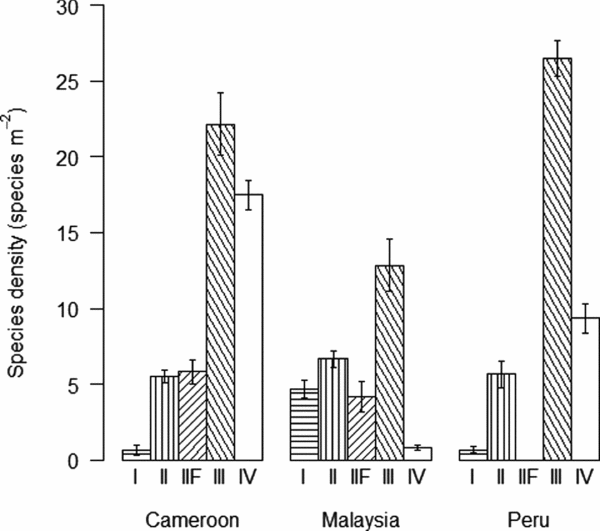
Species richness (±SD), from quadrats, was highest in Cameroon, when sampling effort was accounted for, followed by Peru and then Malaysia despite Cameroon having the smallest sampling area (Figure 1). The highest termites species richness overall and mean (± SE) species density were found in Cameroon with a total of 67 species and 10.3 ± 1.6 spp. m−2, respectively; followed by Peru with a total of 67 species and species density of 8.4 ± 1.8 spp. m−2 and then Malaysia with 52 species and species density of 5.8 ± 0.8 spp. m−2 (Figure 2). Cameroon had the highest mean (± SE) biomass and abundance with 14.5 ± 7.90 g m−2 and 1234 ± 437 ind. m−2, respectively, followed by Malaysia with 0.719 ± 0.193 g m−2 and 327 ± 72 ind. m−2 and then Peru with 0.345 ± 0.103 g m−2 and 130 ± 39 ind. m−2.
Termite species density (mean ± SE) for functional groups FGI and FGII wood-feeders, FGIIF fungus-growers, FGIII humus-feeders and FGIV true soil-feeders across the three sites, Cameroon, Malaysia and Peru, as estimated by standardized transects (data from Eggleton et al. (Reference EGGLETON, BIGNELL, SANDS, MAWDSLEY, LAWTON, WOOD and BIGNELL1996, Reference EGGLETON, HOMATHEVI, JONES, MACDONALD, JEEVA, BIGNELL, DAVIES and MARYATI1999) and from the Peruvian site).
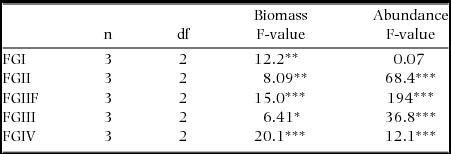
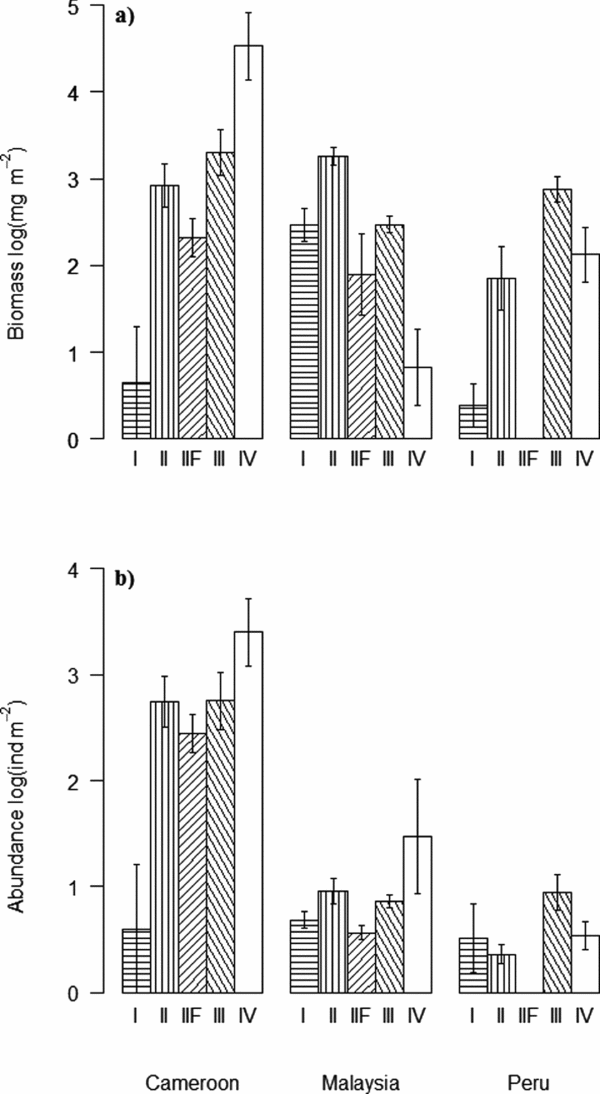
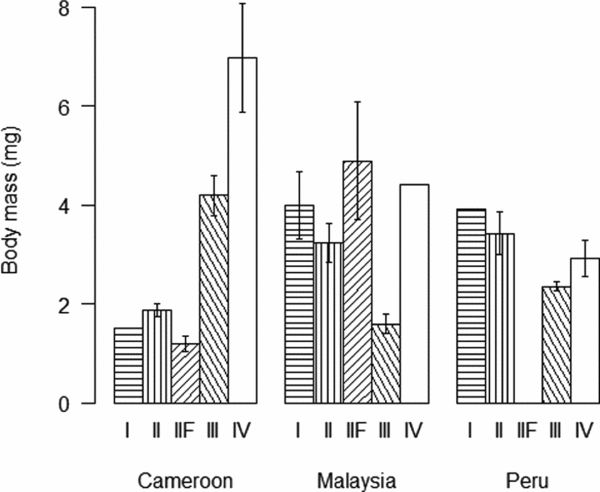
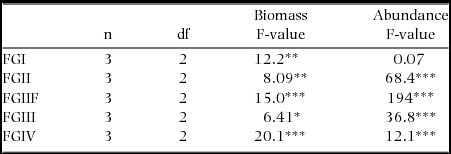
Soil-feeding termites (FGIII & FGIV) had their highest biomass density in Cameroon while ‘wood-feeding’ termites (FGI, FGII and FGIIF) had their highest biomass in Malaysia (Figure 3a). Regionally, FGIV dominated in Cameroon while within Malaysia and Peru FGII and FGIII had the highest biomasses, respectively (Figure 3a). Abundances of all functional groups, with the exception of FGI, were by far the highest in Cameroon (Figure 3b). The high biomasses of wood-feeding termites in both Malaysia and Peru when compared with their relatively low abundances were due to the large body-size of a few wood-feeding termites in those sites (Figure 4). Wood-feeding termites were small-bodied in Cameroon while large-bodied in Malaysia and Peru, while soil-feeding termites were large-bodied in Cameroon and small-bodied in Malaysia and Peru (Figure 4). Regionally, the functional group with highest abundance matched the biomass patterns, except for the high abundance of one species of FGIV in some plots in Malaysia (Figure 3b). The biomass for all functional groups was significantly different across the three continents (Table 3). The same pattern was shown for termite abundance across all functional groups with the exception of wood-feeding termites (FGI) which did not differ among continents (Table 3).
Results from one-way ANOVA comparing termite biomass and abundance for each functional group across Cameroon, Malaysia and Peru. *P < 0.05, **P < 0.01, ***P < 0.001.
Termite biomass (mg m−2 (log(x+1))) (a) and abundance (ind m−2 (log(x+1))) (b) (mean ± SE) for functional groups FGI and FGII wood-feeders, FGIIF fungus-growers, FGIII humus-feeders and FGIV true soil-feeders across the three sites, Cameroon, Malaysia and Peru.
Individual termite body mass (mg) (mean ± SE) in each of the five functional groups, FGI and FGII wood-feeders, FGIIF fungus-growers, FGIII humus-feeders and FGIV true soil-feeders, across the three sites, Cameroon, Malaysia and Peru.
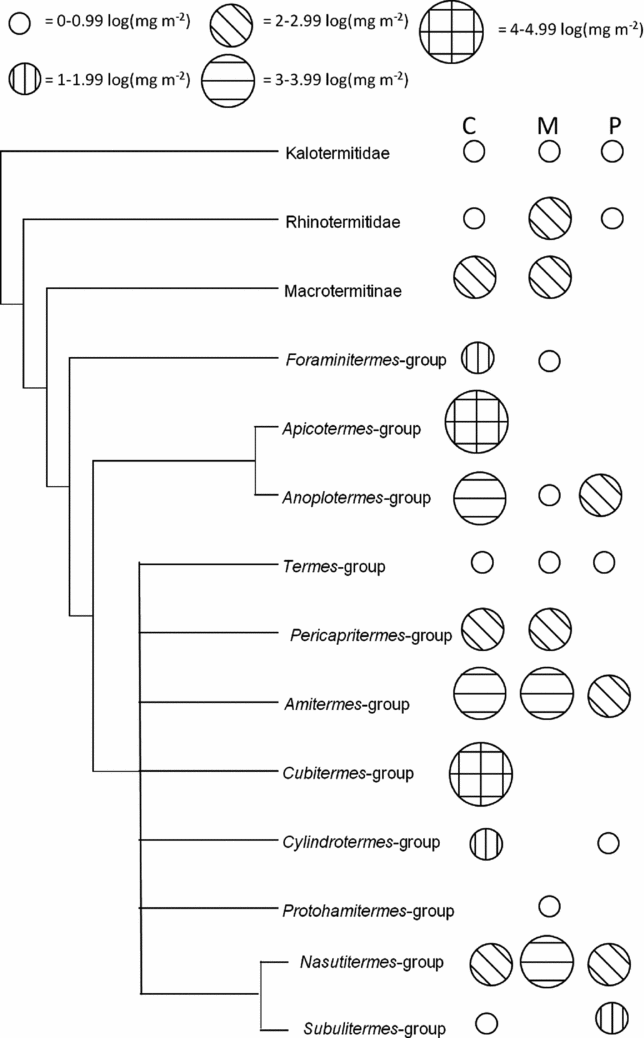
Cameroon had the highest presence of lineages with high biomass concentrated in particularly two lineages, the Cubitermes-group and Apicotermes-group, while those lineages were not found in any of the other sites (Figure 5). The biomass of litter-feeding termites (FGII) in Malaysia was high and concentrated particularly in the Nasutitermes-group (Figure 5). The number of lineages in the Peruvian site was relatively low, with a highest biomass of humus-feeding (FGIII) termites, particularly those in the Anoplotermes-group and Amitermes-group (Figure 5).
Phylogenetic tree including termite lineages from each site. The log transformed biomass (mg m−2) of each lineage is represented by the size and hatched lines within the circles. No circle means that the lineage is absent from the region while lineages with white circles may be absent or have low biomass in the site. The three columns of circles represent each of the sites in Cameroon (C), Malaysia (M) and Peru (P).
DISCUSSION
Comparison of termite assemblage patterns
The main objective of this study was to investigate the existence of the functional diversity anomaly for biomass and abundance of termite functional groups across the three equatorial regions. Although other biomass and abundance data are available (e.g. see list in Bignell & Eggleton Reference BIGNELL, EGGLETON, Abe, Bignell and Higashi2000), only data from the three sites in this study are directly comparable. The termite functional structure across the three sites in this study are consistent with large-scale comparisons of species density data (Davies et al. Reference DAVIES, EGGLETON, JONES, GATHORNE-HARDY and HERNANDEZ2003) which show that there is a large difference between feeding groups across sites. The differences in functional group composition were also consistent with biomass and abundance data which confirms the existence of the functional diversity anomaly for termite biomass and abundance. In particular, there was a high biomass of FGIV termites (particularly in the Cubitermes-group and the Apicotermes-group) in Cameroon while fungus-growing termites (Macrotermitinae) were absent from Peru.
Potential causes of the functional diversity anomaly
Some of the observed diversity differences across the sites may be influenced by differences in body size distribution within particular lineages. Biomass is influenced both by the body size of individual termites and the abundance of individuals in each species. While Cameroon had the highest abundance of all functional groups, except for FGI, the biomass of wood-feeding termites (FGI & FGII) in Malaysia was higher than the biomass of wood-feeding termites in Cameroon. The difference between the biomass and abundance patterns is explained by differences in body-size distributions for each functional group among the sites. Cameroon had relatively larger-bodied soil-feeding termites and relatively smaller-bodied wood-feeding termites compared with Malaysia and Peru. Size distribution across the functional groups is associated with the presence or absence of particular lineages. The high species density of the large-bodied species in the Cubitermes-group and Apicotermes-group (Jones & Eggleton Reference JONES, EGGLETON, Bignell, Roisin and Lo2011) contributed disproportionately to the high biomass of FGIV termites, and the biomass overall, at the Cameroonian site.
Fungus-growing termites are absent from the whole of South America (Aanen & Eggleton Reference AANEN and EGGLETON2005), while humus-feeding and litter-feeding Anoplotermes-group and Nasutitermes-group termites (FGIII & FGII) had high biomasses in the Peruvian site. Additionally, FGIII were small-bodied but with high abundance while FGII were large-bodied with low abundance. In Malaysia the presence of FGIV was low, with only one species recorded; while the dominance of wood-feeding termites in Malaysia was influenced by the presence of particularly Macrotermitinae and Rhinotermitinae. The dominance of the two large-bodied FGIV lineages in Cameroon, the absence of Macrotermitinae in Peru, and the low abundance of true soil-feeding termites (FGIV) in Malaysia strongly contributed to the different patterns of biomass and abundance across sites.
The presence or absence of certain termite lineages therefore appears to be an important correlate of biomass and abundance patterns, as some lineages are widely distributed (Nasutitermes-group and the Amitermes-group) while others are restricted to certain regions (Cubitermes-group, Apicotermes-group and Macrotermitinae). Our data therefore support earlier suggestions (Bignell & Eggleton Reference BIGNELL, EGGLETON, Abe, Bignell and Higashi2000, Davies et al. Reference DAVIES, EGGLETON, JONES, GATHORNE-HARDY and HERNANDEZ2003, Jones & Eggleton Reference JONES, EGGLETON, Bignell, Roisin and Lo2011) that present-day termite distributions are driven by the evolutionary history of termites and not present-day climate. Although temperature and moisture may influence regional termite assemblages (Eggleton et al. Reference EGGLETON, BIGNELL, SANDS, MAWDSLEY, LAWTON, WOOD and BIGNELL1996, Reference EGGLETON, HOMATHEVI, JONES, MACDONALD, JEEVA, BIGNELL, DAVIES and MARYATI1999; Palin et al. Reference PALIN, EGGLETON, MALHI, GIRARDIN, ROZAS-DAVILA and PARR2010), the distribution of feeding groups is more likely to be linked to termite evolutionary history through differential patterns of both dispersal and the regional diversification of functional groups within lineages (Aanen & Eggleton Reference AANEN and EGGLETON2005, Eggleton et al. Reference EGGLETON, WILLIAMS and GASTON1994, Jones & Eggleton Reference JONES, EGGLETON, Bignell, Roisin and Lo2011). In addition, the climatic similarity of the studied habitats, all lowland tropical rain forests, suggests that climate is not the most important factor in explaining the functional diversity anomaly. Moreover, climate can only act as a filter to allow or exclude species through their environmental tolerances. This filter can only act on the regional pool of species and that composition of that regional pool is dependent on historical factors that usually predate the onset of contemporary climates. In this case the regional pools are fundamentally distinct at the major lineage level and those lineages are dated to be several million years old (Eggleton, unpubl. data).
The Termitidae (FGII–FGIV) probably evolved and dispersed from Africa with higher dispersal rates for wood-feeding termites compared with soil-feeding termites (Aanen & Eggleton Reference AANEN and EGGLETON2005, Jones & Eggleton Reference JONES, EGGLETON, Bignell, Roisin and Lo2011). Soil-feeding termites such as the Cubitermes-group and the Apicotermes-group are probably more dependent on the buffered environment within tropical rain forest, which offer less fluctuation in temperature and moisture compared with non-forest habitats (Davies et al. Reference DAVIES, EGGLETON, JONES, GATHORNE-HARDY and HERNANDEZ2003). Therefore, arid and semi-arid habitats such as woodland, savanna and desert would be more likely to be barriers to dispersal for those groups. Wood-feeding termites on the other hand (with the probable exception of fungus-growing termites) are more likely to have been able to disperse across different types of barrier, including bodies of water, because of their rafting abilities (Gathorne-Hardy et al. Reference GATHORNE-HARDY, JONES and MAWDSLEY2000). These activities are probably dependent on their harder and thicker exoskeletons, which support their foraging behaviour (Nalepa Reference NALEPA2011) and therefore the likelihood of allowing dispersal across suboptimal habitat types. The biogeographical patterns of wood-feeding termites may therefore have evolved through a wider range of dispersing types than soil-feeding termites, which may have had relatively low dispersal rates. However, it seems likely that soil-feeding (particularly FGIII) termites may have evolved independently from rafting wood-feeding termites on several occasions across the continents (Inward et al. Reference INWARD, VOGLER and EGGLETON2007, Jones & Eggleton Reference JONES, EGGLETON, Bignell, Roisin and Lo2011) leading to the relatively depauperate humus- and soil-feeder assemblages of the non-African sites.
Macrotermitinae (fungus-growing termites) seem to have evolved in African tropical forests (Aanen & Eggleton Reference AANEN and EGGLETON2005) and although four dispersal events from Africa to South-East Asia appear to have taken place, fungus-growing termites have failed to colonize South America. Macrotermitinae are poor dispersers, as they depend on their close mutualistic relationship with Termitomyces, a fungus, which breaks down organic matter within the termite mound (Aanen & Eggleton Reference AANEN and EGGLETON2005). Generally termites depend on the presence of the reproductive caste (king and queen), however, the species of Macrotermitinae also need spores of Termitomyces to be available in their new environment. The genus Microtermes (along with a single species of Macrotermes, M. bellicosus) is able to store fungal spores in their digestive tracts and so pass them on vertically from generation to generation while other species depend on foraging workers to provide fungal spores from the environment when they settle in a new area (Nobre et al. Reference NOBRE, EGGLETON and AANEN2010). This ability makes species of Microtermes more efficient dispersers and, as a result, species of that genus are found in areas where few Macrotermitinae are present, e.g. on Madagascar (Nobre et al. Reference NOBRE, EGGLETON and AANEN2010). The successful colonization of Asia but their failure to inhabit South America contributes to the diversity anomaly of functional groups across the equatorial regions.
Possible implications of biomass and abundance patterns on ecosystem processes
The patterns of biomass and abundance uncovered here are likely to affect ecosystem processes across equatorial sites differentially because of the differential dominance of particular functional groups (Ji & Brune Reference JI and BRUNE2001, Jouquet et al. Reference JOUQUET, TRAORÉ, CHOOSAI, HARTMANN and BIGNELL2011, Schuurman Reference SCHUURMAN2005). While it was shown that true soil-feeding (group IV) termites dominated the Cameroonian site, litter-feeding and humus-feeding (group II and III) termites dominated the sites in Malaysia and Peru, respectively. This biomass and abundance anomaly may have an effect on the processes of soil and wood decomposition and in turn the turnover and availability of nutrients in the respective sites.
True soil-feeding termites (group IV) are not only physiologically distinct from wood-feeding termites but also have more complex guts than humus-feeding (group III) termites (Ji & Brune Reference JI and BRUNE2005). FGIV termites break down bacterial polysaccharides as a carbon energy source while stimulating the mineralization of soil cellulose and protein (Ji & Brune Reference JI and BRUNE2001, Reference JI and BRUNE2005). True soil-feeding (group IV) Cubitermes species have also been shown to influence soil pH, organic carbon content and water content (Donovan et al. Reference DONOVAN, EGGLETON and DUBBIN2001b). Further, group IV termites have been shown to stabilize nitrogen in a form which plants can use, releasing no more than 3% to the atmosphere compared with other macrofauna (e.g. earthworms) for which emission of N2 gas is higher (Ngugi & Brune Reference NGUGI and BRUNE2012). Tropical forest soils are however generally neither nitrogen nor carbon limited, so these termite effects may only be of local importance, for example, by enhancing soil heterogeneity (Donovan et al. Reference DONOVAN, EGGLETON and DUBBIN2001b). Phosphorus (P), on the other hand, is in short supply (Aragão et al. Reference ARAGÃO, MALHI, METCALFE, SILVA ESPEJO, JIMENEZ, NAVARRETE, ALMEIDA, COSTA, SALINAS, PHILLIPS, ANDERSON, ALVAREZ, BAKER, GONCALVEZ, HUAMAN-OVALLE, MAMANI-SOLORZANO, MEIR, MONTEAGUDO, PATINO, PENUELA, PRIETO, QUESADA, ROZAS-DAVILA, RUDAS, SILVA and VASQUEZ2009) but seems to accumulate in termite mound and nest material (Chapuis-Lardy et al. Reference CHAPUIS-LARDY, BAYON, BROSSARD, LOPEZ-HERNANDEZ, BLANCHART, Brünemann, Oberson and Frossard2011, Rückamp et al. Reference RÜCKAMP, AMELUNG, THEISZ, BANDEIRA and MARTIUS2010). Mound and nest erosions may increase soil P content through, for example, leaching (Chapuis-Lardy et al. Reference CHAPUIS-LARDY, BAYON, BROSSARD, LOPEZ-HERNANDEZ, BLANCHART, Brünemann, Oberson and Frossard2011), although erosion rates have been shown to vary greatly both within and across species (Brossard et al. Reference BROSSARD, LÓPEZ-HERNÁNDEZ, LEPAGE and LEPRUN2007). We therefore predict that the presence of true soil-feeding termites, particularly of the genus Cubitermes, may affect soils by influencing soil heterogeneity.
Macrotermitinae (fungus-growing termites) have been shown to be very important for the decomposition of wood. Results from African studies in savanna woodlands have shown that 90% of the termite wood decomposition was due to fungus-growing termites, and Macrotermes in particular (Buxton Reference BUXTON1981, Schuurman Reference SCHUURMAN2005, Wood & Sands Reference WOOD, SANDS and Brian1978). Both Cameroon and Malaysia had fungus-growing termites (Eggleton et al. Reference EGGLETON, BIGNELL, SANDS, MAWDSLEY, LAWTON, WOOD and BIGNELL1996, Reference EGGLETON, HOMATHEVI, JONES, MACDONALD, JEEVA, BIGNELL, DAVIES and MARYATI1999) while these were absent from Peru altogether. We suggest it is likely therefore that sites with Macrotermitinae may have higher wood decomposition rates than the sites without fungus-growing termites, holding all other factors constant. For example, annual consumption by species of Macrotermitinae was recorded as 35.5 g m−2 and 669 kJ m−2 compared with only 20.0 g m−2 and 377 kJ m−2 for other wood-feeding species (Wood & Sands Reference WOOD, SANDS and Brian1978).
Conclusion
The biomass and abundance patterns across the three sites were broadly similar to the already established global species density patterns. This strongly supports the existence of the functional diversity anomaly as an ecologically meaningful phenomenon. The importance of the presence or absence of certain lineages for the patterns of functional groups in each region strongly suggests that termite functional distributions are a consequence mainly of evolutionary factors, including chance dispersal events. These findings are important as the biomass and abundance of functional groups may be linked to ecosystem processes which in turn may influence the regional ecosystems as a whole. The three study sites have allowed us to compare datasets from different regions; however, further comparable studies are needed to create a broader dataset that will enhance the understanding of the impact and drivers of the biomass and abundance of termite functional groups. These ecological predictions made from the anomaly also clearly need to be tested as soon as is practicable.
ACKNOWLEDGEMENTS
This study is a product of the RAINFOR and ABERG research consortia, and was funded by NERC grant NE/G018278/1 to PM and YM. We are grateful to Explorer's Inn in Tambopata National Park in Peru for hosting the research, SERNAMP, Ministerio de Agricultura, and Museo de Historia Natural in Lima for providing the appropriate research and export permits and field assistants H. Siccos and H. Lopes. We also thank D. Mann at the Hope Department of Entomology, Natural History Museum, Oxford, for help and support in the laboratory.