Introduction
Nucleation is the process that determines how long one has to wait before a crystal appears in the system, or if a crystal forms at all. Whenever we want a crystalline material, whether it be a metal or a drug, we need nucleation. For this reason, the nucleation of crystals is of interest across much of materials science. Here, we consider universal aspects of how crystals nucleate, because many features of crystal nucleation appear to be common to all, or almost all, crystallizing systems. An example is the essentially universal observation that nucleation is typically heterogeneous: the crystal nucleus forms in contact with a surface. Although specific crystallizing systems are used to illustrate the points here, these points apply very widely in materials science. In particular, we show results for ice, as the nucleation of ice is perhaps the best studied crystallizing system of all. Materials scientists can learn from the excellent and innovative work done by atmospheric scientists on ice nucleation.Reference Pruppacher and Klett1,Reference Murray, O’Sullivan, Atkinson and Webb2
Currently, we have very little ability to predict how long nucleation will take (i.e., how long we have to wait before a crystal nucleates) for a given volume of sample at a given supersaturation. We cannot predict if we will have a burst of many small crystals nucleating, or just a few. This is mainly due to a combination of not knowing what nucleation is occurring on, or what the microscopic mechanism is. We know that nucleation is usually heterogeneous (i.e., that it occurs in contact with something), but we almost never know exactly what that surface is. This lack of knowledge is a major stumbling block in this field. The next two sections offer a review of the progress being made on this problem.
In the absence of knowledge of exactly where nucleation is occurring and what the mechanism is, the best approach is to combine quantitative experimental data with simple phenomenological models. These models, such as the Weibull model, are routinely taught and used in materials science in other contexts (brittle fracture),Reference Ashby and Jones3,Reference Chawla4 but surprisingly, are almost never used for nucleation studies. The article discusses how progress could be made by applying these well-known models to this problem.
What do crystals nucleate on?
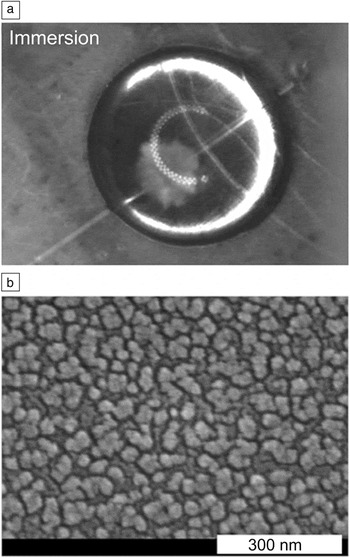
Nucleation is usually heterogeneous: The nucleus of the crystal forms in contact with something. In most cases, this is some form of dirt or impurity in the system, therefore, we have little idea of the properties of the surface where nucleation is occurring. However, it is sometimes possible to observe the early stages of growth of a crystal (although not nucleation itself), and be able to say with some confidence what surface nucleation occurred at. Gurganus et al.Reference Gurganus, Charnawskas, Kostinski and Shaw5 imaged crystallization of a supercooled water droplet (Figure 1a) shortly after nucleation. In the figure, to the left and just below the middle of the droplet is a pale shadow; this is a growing ice crystal. The crystal appeared to originate in contact with the fiber running from bottom left to top right of the droplet. A scanning electron microscope image of the surface of the fiber is shown in Figure 1b. Note: the fiber surface has been deliberately roughened on length scales down to the expected length scale of the nucleus, on the order of 10 nm.
Ice nucleation and growth in a water droplet with immersed nanotextured fibers. (a) Optical image of a 30-µl water droplet shortly after nucleation has occurred. This image, showing ice crystal formation, is from a movie taken with a high-speed camera. The droplet is on a substrate and is viewed from above. Optical fibers with nanotextured surfaces are immersed in the droplet. The fibers are seen as faint lines crossing the droplet. The growing ice crystal is the pale shadow seen just below and to the left of the center of the droplet. It is growing from a point on one of the fibers, suggesting that the ice crystal nucleated in contact with this fiber. The droplets freeze at approximately −20°C. (b) High-resolution scanning electron microscope image of the surface of the nanotextured fiber. Note: there are surface features and roughness down to length scales of 10 nm and below. Classical nucleation theory suggests that the rate-limiting nucleus is on the order of 10 nm across. Adapted with permission from Reference Reference Gurganus, Charnawskas, Kostinski and Shaw5. © 2014 American Physical Society.

The behavior seen in Figure 1 is probably typical; it is to be expected that nucleation usually occurs with the crystal nucleus in contact with a surface that has nanoscale roughness. We have evidence that nucleation is also seen for small molecules on rough surfaces, cracks, etc.Reference Campbell, Meldrum and Christenson6,Reference Diao, Helgeson, Myerson, Hatton, Doyle and Trout7 However, the work of Gurganus and co-workers is atypical in the sense that we know what the surface is; typically, nucleation occurs on some uncharacterized impurity. They also observed nucleation at a line around the fiber’s surface, where the fiber crosses the liquid/air interface. Here, the liquid, air, and fiber all meet at a three-phase line, and this may promote nucleation, for reasons that remain unclear.Reference Gurganus, Kostinski and Shaw8
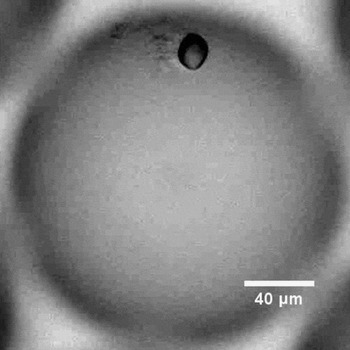
In protein solutions, nucleation can occur when in contact with aggregates of the protein itself.Reference Parmar, Gottschall and Muschol9,Reference Akella, Mowitz, Heymann and Fraden10 A growing crystal of the protein lysozyme, in contact with an aggregate, is shown in Figure 2. It appears that the aggregation occurs at the start of the experiment, when the supersaturation locally spikes during droplet preparation. The aggregates then persist. Subsequently, a crystal nucleates on these aggregates. As the supersaturation drops (the solutions nucleate at concentrations tens of times the crystal solubility) due to crystal growth, the aggregates dissolve.
Optical image of a crystal of the protein lysozyme (black oval) that has apparently nucleated in contact with an aggregate (immediately to the left of the crystal). The image shows a droplet of supersaturated solution produced using microfluidics. The image was taken 75 s after the crystal appeared. Adapted with permission from Reference Reference Akella, Mowitz, Heymann and Fraden10. © 2014 American Chemical Society.

Nucleation at surfaces is especially important in small confined systems, as by definition these are surrounded by a surface and have a high surface-to-volume ratio. (Nucleation in such systems is discussed in the article by Whittaker et al. in this issue.)
Adding a surface to a solution can accelerate nucleation
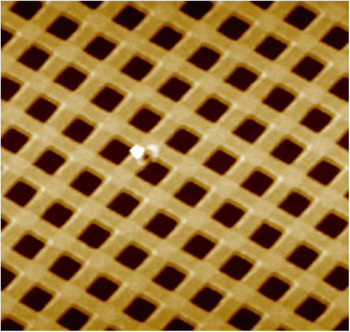
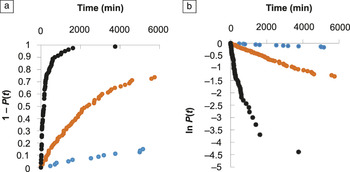
One way of bypassing the problem of not knowing what the crystals are nucleating on is to introduce an engineered surface into the system, and study nucleation on that surface. Tan et al.Reference Tan, Davis, Myerson and Trout11 recently took this approach when they made a polymer substrate with acute-angled (85°) corners with nanoindentations (Figure 3). They quantitatively studied nucleation under three different conditions: with this substrate with corners, with a flat substrate made from the same polymer, and with no substrate at all. They investigated a large set of droplets and determined the fraction P(t) that had not yet crystallized as a function of time. The results are shown in Figure 4.
Atomic force microscope image of a patterned poly(vinyl alcohol) (PVA) film with a grid of nanoindentations with corners with 85° angles. Each indentation is approximately 300 nm across. The white spot near the center is an imperfection in the film. The image was taken after the PVA film had been submerged in ethanol for 48 h. Adapted with permission from Reference Reference Tan, Davis, Myerson and Trout11. © 2015 American Chemical Society.

Nucleation of aspirin crystals from an ethanol solution at a supersaturation S = 1.8. This is an example of Class II nucleation (decreasing rate).Reference Sear28 (a) Cumulative probability 1 − P(t) that nucleation of an aspirin crystal has occurred, as a function of time t. (b) Plot of ln (P) versus t. The blue symbols are for nucleation without a polymer film, the orange symbols are for nucleation in the presence of a flat polymer film, and the black symbols are for nucleation in the presence of the polymer film with the nanoindentations shown in Figure 3. Nucleation is much faster in the presence of the pores, but the increase in speed is still orders of magnitude less than predicted by both classical nucleation theory and computer simulations of simple model systems. Adapted with permission from Reference Reference Tan, Davis, Myerson and Trout11. © 2015 American Chemical Society. Note: P(t), fraction of systems not yet crystallized.

Tan et al. found that adding a flat substrate reduced typical nucleation times by about an order of magnitude, and adding a substrate with 85° corners reduced times by another order of magnitude. Thus, although they did not observe nucleation directly, it seemed likely that nucleation occurred at the corners, although impurities in the solution may still have played a role.
Computer simulations of a simple model confirm that nucleation should be faster in grooves than on flat surfaces.Reference Page and Sear12 It was estimatedReference Page and Sear12 that the nucleation rate on flat surfaces was more than 40 orders of magnitude lower than in the wedge with the highest rate. These simulation results contrast with the one order of magnitude difference seen in the experiments of Tan et al. (Figure 4). The reason for this large discrepancy is unknown. It could be due to atomic-scale roughness in the surfaces inevitably present in the experiments (but absent in the simple model studied by simulation), or the impurity particles also inevitable in experiments could be playing a role here.
What is the microscopic mechanism of nucleation?
We do not know the answer to this question for essentially all experimental systems of interest. Exact computer simulations of simple models usually give results for nucleation that agree with classical nucleation theory (CNT).Reference Auer and Frenkel13–Reference Filion, Ni, Frenkel and Dijkstra15 This theory predicts that nucleation is slow due to requiring a rare (high free-energy cost) fluctuation.Reference Debenedetti16–Reference Sear18 The nucleation rate R in a crystallizing sample at constant supersaturation is then given by:Reference Sear19
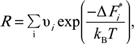 $$R = \mathop \sum \limits_i {\rm{\upsilon }}_i {\kern 1pt} {\kern 1pt} {\rm{exp}}{\kern 1pt} \left( {{{ - {\rm{\Delta }}{\kern 1pt} F_i^{\rm{*}} } \over {k_B T}}} \right){\kern 1pt}$$,
where the sum is over all nucleation sites i in the sample. Here,  ${\rm{\Delta }}F_i^{\rm{*}}$ is the free energy of the crystal nucleus at the top of the barrier at nucleation site i, and
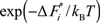 $\exp {\kern 1pt} \left( { - {\rm{\Delta }}{\kern 1pt} F_i^{\rm{*}} {\kern 1pt} /{\kern 1pt} k_B T} \right)$ is the probability of a fluctuation reaching the top of the barrier at site i, where k B is the Boltzmann constant and T is the temperature. νi is roughly one over the natural time scale for the dynamics of the molecules or ions that are crystallizing. Nucleation fluctuations are rare
 $\left( {\exp {\kern 1pt} \left( { - {\rm{\Delta }}{\kern 1pt} F_i^{\rm{*}} {\kern 1pt} /{\kern 1pt} k_B T} \right)\,{\kern 1pt} {\kern 1pt} < < {\kern 1pt} 1} \right)$, because of the free-energy cost of the interface around the nucleus of the crystal phase. This cost is reduced at surfaces, which is why CNT predicts heterogeneous nucleation should dominate.
In principle, CNT can explain why nucleation can be slow. However, direct evidence that nucleation is slow in experiments because of this mechanism is essentially absent. We cannot observe the nucleus because of its small size, and because it is short lived. However, there is some indirect evidence that CNT is at least part of the story. CNT predicts that nucleation should be much faster at surfaces in the bulk, and as we saw in the previous section, nucleation typically occurs at surfaces. It also predicts that the rate of nucleation should vary rapidly with supersaturation, and again, that is what is observed.Reference Akella, Mowitz, Heymann and Fraden10,Reference Herbert, Murray, Whale, Dobbie and Atkinson20–Reference Little, Sear and Keddie23
Classical and nonclassical nucleation
There are a number of systems, for example, the crystallization of calcium carbonate and magnetite from solution,Reference Sear18,Reference Nielsen, Aloni and De Yoreo24,Reference Baumgartner, Dey, Bomans, Coadou, Fratzl, Sommerdijk and Faivre25 where nucleation is described as “nonclassical.” Transmission electron microscopy (TEM) studies typically show nanometer-size clusters (often of an amorphous intermediate, not a crystal) that persist for seconds or more. This is inconsistent with the standard CNT picture, where nanoscale liquid droplets or crystallites rapidly grow if the supersaturation is high enough, or otherwise rapidly shrink. It seems likely that there are slow microscopic dynamics in these systems; in other words, these clusters are at least partially glassy (i.e, have slow internal dynamics), and this somehow arrests both growth and dissolution. Such slow microscopic dynamics are not included in the classical picture.
These are complex systems, and we lack quantitative experimental data due to the difficulty of studying them. Typically, such systems are not studied at constant supersaturation, due to the fact that they are prepared by mixing two soluble salt solutions to make a much more insoluble salt. Although the formation of the crystal phase clearly has nonclassical features, at least under the conditions amenable to TEM studies, we do not yet understand what is going on at a fundamental level, and more work is needed.
The classical picture involves a single nucleation barrier whose height depends only on supersaturation. Hence the rate only depends on the supersaturation. Apart from clusters, another nonclassical example is crystallization that depends on the history of the sample. Here, the nucleation rate changes if the sample had previously been held at a higher or a lower temperature before supersaturation was established.Reference Turnbull26,Reference Kuhs, Zeglinski and Rasmuson27 This behavior looks nonclassical, in the sense that CNT applied to a simple model of homogeneous nucleation or to heterogeneous nucleation on a flat surface will not give a history-dependent nucleation rate. However, if there are pores in a surface, whether they are full or empty may depend on the thermal history of the sample, and even the classical theory for the rate-limiting step may give history-dependent nucleation.Reference Turnbull26 See Reference Reference Sear18 for further discussion of more complex nucleation behavior.
How can we model nucleation?
CNT predicts that nucleation proceeds via a rare fluctuation. If we make two additional assumptions, then CNT makes a prediction for the time dependence of the fraction of samples that have not yet crystallized, P(t). This function is sometimes called the survival function, as it is the probability of surviving to a time t. It predicts that P(t) should decrease exponentially with time:Reference Sear28
 $$P\left( t \right) = \exp \left( { - kt} \right),$$
with k being the nucleation rate. The first of these two assumptions is that the nucleation barriers do not change with time. As nucleation often occurs at surfaces, surfaces must not change with time.Reference Sear29 The second assumption is that the nucleation rate must be the same in all the samples. Because nucleation often seems to occur on impurities, which of course vary from sample to sample, this second assumption is typically, at best, approximately true.
The nucleation rate may not exist
In practice, the measured P(t) is rarely exponential,Reference Sear28 and the nucleation rate k is not well defined. An example of this is seen in Figure 4b, where it is clear that the plotted ln P(t) for the 85° corners clearly curves up from a straight line. The effective nucleation rate at a given time is the slope of ln P(t) with respect to t at that time. When ln P(t) curves upward, this means that the effective nucleation rate is decreasing. When it curves downward, the effective rate is increasing.
In a recent review,Reference Sear28 the time dependence of the effective rate was used to classify crystallizing systems into three classes: I, II, and III. Class I has a constant rate, Class II a decreasing rate, and Class III an increasing effective nucleation rate. Class I behavior occurs when P(t) is exponential and ln P(t) is a straight line. Class II behavior, such as that seen in Figure 4, results whenever the rate in an individual droplet is a stochastic process that occurs at a constant rate, but with a spread in nucleation rates between different droplets.Reference Sear28,Reference Proschan30 The P(t) data in Figure 4 were obtained by studying a set of 80 nominally identical samples. Thus, the observed P(t) could be due to some of the 80 samples having a higher nucleation rate than others. This would naturally be the case for heterogeneous nucleation affected by impurities, which will always vary from sample to sample. Laval et al.Reference Laval, Crombez and Salmon22 developed a way of determining if the rates in two samples are different.
The function P(t) is the survival function of the liquid state,Reference Sear28 and analyzing P(t) falls under survival data analysis.Reference Lee31,Reference Cox and Oakes32 Surprisingly, the methods developed in survival data analysis have not been applied to crystallization, although materials scientists do use them (e.g., to study brittle fracture).Reference Ashby and Jones3,Reference Chawla4 There are opportunities to apply these methods to nucleation.
Varying supersaturation
Up to this point, we have only considered the simplest case—nucleation at constant supersaturation. However, many experiments are conducted under conditions where supersaturation increases with time, for example, when a set of droplets is cooled at a constant rate until they have all frozen. Typically, this complicates analysis, as even in the simplest case, the nucleation rate will depend on time. However, atmospheric scientists have developed a class of models called singular modelsReference Pruppacher and Klett1,Reference Levine33,Reference Sear34 that simplify matters by having no explicit rates at all.
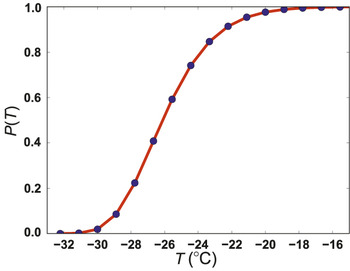
If we consider a set of a few hundred droplets all being cooled at a constant rate α, then at time t, the supercooling is ∆T = αt. In Figure 5, data were plotted on a set of water droplets cooled at a constant rateReference Dorsch and Hacker35 (blue circles). Note: there is a spread in the temperatures (equivalently times) at which the droplets freeze. In Figure 5, this spread is about 10°C.
Plot of the fraction of water droplets not frozen, P(T), as a function of temperature T (°C). The blue circles are data for 692 water droplets of diameter 69 ± 11.5 µm, resting on a platinum surface, and cooled at an approximately constant rate of a few tenths of a °C per second. The red curve is a fit of the Weibull distribution, P(T) = exp[− (T /T 0)β], with parameter values T 0 = −26.9°C and β = 12.6.Reference Dorsch and Hacker35

Some droplets freeze before others. One droplet may freeze earlier than another, simply because by chance, the nucleation fluctuation occurred earlier, or because that droplet contained different impurities and had a lower barrier to nucleation. Typically, we cannot separate these two factors, but singular models simplify matters by assuming that the variability between impurities in one droplet and another dominates. In the language of CNT, if we compare two droplets, the barrier in one will be much lower than that in the other, such that nucleation in the droplet with the lower barrier always occurs first. Since cooling is occurring at a constant rate, “first” indicates “at a higher temperature.” A singular model then assigns a well-defined and different freezing temperature to each droplet.
Singular models can be derived by assuming that in each droplet, there are many nucleation sites, each of which triggers nucleation at a well-defined but different temperature. The use of what is called extreme value statisticsReference Levine33,Reference Sear34,Reference Castillo36 yields a model for the fraction unfrozen as a function of temperature, P(T). This model is a generalization of the Weibull distribution, familiar to materials scientists from its use in the study of brittle facture.Reference Pruppacher and Klett1,Reference Chawla4 The red curve in Figure 5 is a fit of the Weibull function to the data; we see that it is a good fit. Singular models are often good ways to fit data obtained at varying supersaturation. Surprisingly, although these simple and useful models have been used in atmospheric science for over 60 years,Reference Pruppacher and Klett1 they have not been used, to the best of our knowledge, in materials science.
Conclusion
Even though we can control nucleation to some extent by introducing surfaces that promote nucleation, we cannot predict nucleation rates. It seems likely that there are factors in experiments that strongly influence nucleation times, but are missing in the simple models we use for computer simulations and CNT. For example, it is widely appreciated among atmospheric scientists that the ability of a surface to promote nucleation can change with time, due to surface processes such as chemical reactions.Reference Salam, Lohmann and Lesins37 This possibility is almost always neglected in materials science.
We are not alone in working with a stochastic process whose microscopic details we usually cannot study. Many engineers frequently have the same problem; indeed, materials scientists working on brittle fracture are faced with the same problem:Reference Ashby and Jones3,Reference Chawla4 brittle fracture is stochastic in the sense that two nominally identical samples will fail at different stresses, and we do not have enough information on the microscopic mechanism of fracture to predict a priori which sample will fail first. Nucleation is also stochastic: Two nominally identical samples will crystallize at different supersaturations, and we do not have enough information on the microscopic mechanism of nucleation to predict a priori which sample will nucleate first.
There are simple and useful phenomenological models, such as the Weibull model, that can be used to fit nucleation data. The Weibull model appears in materials science textbooksReference Ashby and Jones3,Reference Chawla4 but is not used for nucleation, although it could be. There is also scope for more sophisticated analysis of P(t) or P(T) via effective rates and using survival data analysis.Reference Sear28,Reference Proschan30–Reference Cox and Oakes32
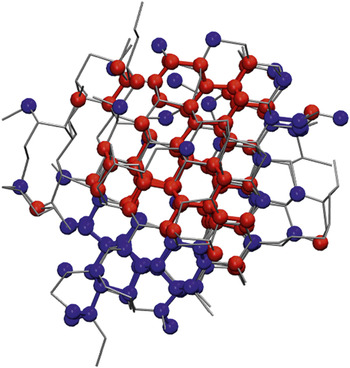
We conclude by briefly mentioning polymorphism. Most systems have not just one possible crystal lattice, but several. These different crystal lattices are called polymorphs. Polymorphism complicates the study of nucleation. Recent computer simulations have found crystal nuclei that are mixtures of more than one polymorph (Figure 6). Naively, one might think that one polymorph may nucleate, or another, but that is clearly not happening. At least in some systems with competing polymorphs, a mixed nucleus forms, and only later is the polymorph that forms determined. This has consequences for how we interpret experimental results.
Computer simulation snapshot of ice nucleation at temperature T = 230 K. The snapshot is taken at the top of the nucleation barrier. Blue and red indicate water molecules in the hexagonal and cubic ice polymorphs, respectively. Hexagonal ice is the equilibrium polymorph, but cubic ice is only slightly higher in free energy. The gray lines indicate hydrogen bonding. The nucleus is a mixture of the two polymorphs.Reference Moore and Molinero38 Courtesy of Laura Lupi and Valeria Molinero (The University of Utah).

Acknowledgments
Thanks to S. Akella, S. Fraden, L. Lupi, V. Molinero, R. Shaw, L. Tan, and B. Trout for figure permissions. I would also like to thank the many scientists I have discussed nucleation with over the years, in particular, D. Frenkel, S. Fraden, B. Peters, and R. Shaw. The author acknowledges EPSRC for funding (EP/J006106/1 and a PhD studentship) and confirms that no new data were created during this study.