I. INTRODUCTION
Multiferroics are materials that exhibit a combination of ferromagnetic, ferroelectric, and piezoelectric properties (Martin et al., Reference Martin, Crane, Chu, Holcomb, Gajek, Huijben, Yang, Balke and Ramesh2008). Ferroelectric materials have a wide range of applications such as non-volatile memory devices, capacitors, and precision actuators (Lines, Reference Lines2001). Similarly, magnetic materials are employed in storage devices and many other applications (Handley, Reference Handley2000). The co-existence of both ferroelectric and ferromagnetic properties in one material provides a fertile ground for fundamental research as well as technological applications (Eerenstein et al., Reference Eerenstein, Mathur and Scott2006). Materials with coupled ferroelectric and ferromagnetic order parameters provide an additional degree of freedom in device design, since polarization of the material can be switched using either the magnetic field or the electric field (Kimura et al., Reference Kimura, Goto, Shintani, Ishizaka, Arima and Tokura2003; Hur et al., Reference Hur, Park, Sharma, Ahn, Guha and Cheong2004; Tokura, Reference Tokura2006). This property is valuable in information storage device design, since (in theory) a data bit can be written with an electric field and read using a magnetic probe, and vice versa (Verma et al., Reference Verma, Kotnala and Negi2009). However, room temperature multiferroics are scarce, since the competing conditions are hard to satisfy simultaneously (Spaldin and Fiebig, Reference Spaldin and Fiebig2005). Both ferroelectricity (reflected by lattice distortions) and ferromagnetism are related to the d-orbital occupancy (Hill, Reference Hill2000). The wide range of ferroelectric perovskite materials with a ABO3 chemical formula contain B-site cations such as Ti4+, Nb5+, and Zr4+ with empty d orbitals. Doping transition-metal cations with d-electrons reduces the tendency for an off-centering distortion, thereby reducing the lattice distortion responsible for ferroelectricity. Nevertheless, Palkar and Malik (Reference Palkar and Malik2005) reported the existence of magneto-electric properties in a PbTi0.5Fe0.5O(3−δ) sample, with a tetragonal distortion of 1.028. This is surprising, since a high level of Fe3+ substituted in Ti4+ site may create oxygen vacancies that lead to structural instabilities. Similar studies by Ren et al. (Reference Ren, Xu, Wei, Liu, Hou, Du, Weng, Shen and Han2007, Reference Ren, Xu, Wei, Liu, Wang, Xiao, Shen and Han2009) and Liu et al. (Reference Liu, Ren, Wei, Xiao, Hou, Shen, Xu and Han2010) also reported room temperature ferromagnetic behavior in low Fe-doped (4 mol%) PbTiO3 (PT) nanocrystals.
Ferroelectric perovskite B-site doping with 3d magnetic transition elements has been extensively studied (Kim, Reference Kim2005; Koduri and Lopez, Reference Koduri and Lopez2007; Stoupin et al., Reference Stoupin, Chattopadhyay, Bolin and Segre2007). Many electron paramagnetic resonance (EPR) studies have shown that magnetic ions are indeed incorporated into the B-sublattice (Dimza, Reference Dimza1993; Eichel, Reference Eichel2007; Keeble et al., Reference Keeble, Loyo-Menoyo, Booq, Garipov, Eremkin and Smotrakov2009; Puthucheri et al., Reference Puthucheri, Pandey, Gajbhiye, Gupta, Singh, Chatterjee and Date2011). In an effort to better understand the PbTi(1−x)Fe x O(3−δ) solid solution system (PTF), we have synthesized a series of samples using a wet chemical synthesis route followed by a moderate temperature (700 °C) calcination. In this paper, we report the structures of the PTF series up to x = 0.3 obtained using the Rietveld method (Rietveld, Reference Rietveld1969). The effects of charge compensating oxygen vacancies were studied using lattice strain, the variation of B–O bond length and strain were compared against existing theoretical predictions (Meštrić et al., Reference Meštrić, Eichel, Kloss, Dinse, Laubach, Laubach, Schmidt, Schonau, Knapp and Ehrenberg2005), and the solubility limit of Fe in PT has been established. Cubic, cubic + tetragonal, and tetragonal models were tested. Based on the goodness-of-fit, the existence of a cubic PTF phase at Fe concentrations x ≤ 0.3 was ruled out. PTF samples with x ≥ 0.4 contained an additional phase, PbFe12O19 (Diaz-Castanon et al., Reference Diaz-Castanon, Sanchez, Estevez-Rams, Leccabue and Watts1998). In the perovskite structure, oxygen octahedra-encapsulated B-site cations are arranged in a corner-sharing configuration. With perovskites, the crystallographic shear (CS) structure, where along the CS planes the octahedra share edges or faces instead of corners and edges, is generally believed to be not realizable (Mitchell, Reference Mitchell2002). The existence of a perovskite-based CS structure has been reported for Pb2Fe2O5 (Abakumov et al., Reference Abakumov, Hadermann, Bals, Nikolaev, Antipov and Van Tendeloo2006; Batuk et al., Reference Batuk, Hadermann, Abakumov, Vranken, Hardy, Van Bael and Van Tende- loo2011). The end member of our sample series, x = 1 contains Pb2Fe2O5, PbFe12O19, and PbO.
II. EXPERIMENTAL
Wet chemical techniques have an advantage over conventional solid state processing in terms of higher solubility, homogeneity, and distribution of dopants (Mulla et al., Reference Mulla, Natarajan, Gaikwad, Samuel, Guptha and Ravi2007). Our PTF samples were prepared using an acetic acid based sol–gel route. All reagents of choice, lead subacetate, Pb(C2H3O2)2·2Pb(OH)2 (Sigma-Aldrich, ACS reagent grade) iron(III) acetylacetonate, Fe(C5H7O2)3 (Sigma-Aldrich, 99.9%), and titanium isopropoxide Ti(OCH(CH3)2)4 (Sigma-Aldrich 99.999%), have good solubility in the solvent, acetic acid (Thermo-Fisher 98.5%). Stoichiometric solutions with desired Fe-concentrations were prepared by dissolving appropriate amounts of precursor powders in acetic acid. Lead sub- acetate and iron(III) acetylacetonate powders were separately dissolved in small beakers using 25–35 ml of acetic acid. Complete dissolution was achieved with the aid of a magnetic stirrer. Excess amounts of lead (typically 3%) were used to compensate for possible lead volatilization (Ma et al., Reference Ma, Narayanan, Tong and Balachandran2009). On complete dissolution, two solutions were poured into a large beaker and stirred for approximately 10 min. Subsequently, a stoichiometric amount of titanium isopropoxide, typically between 1.25 and 5 ml was added while the solution was constantly being stirred. Ultrasonication promotes better mixing, aids gelation, and prevents pyrochlore phase formation (Kim et al., Reference Kim, Kim and Park2000), therefore, the solution was ultrasonicated for 1–3 h where longer sonication times are associated with higher iron concentrations. The solution was then transferred into a Petri dish for gel formation. Drying was carried out inside a 75 °C furnace and dried samples were ground and pyrolyzed in air at 300 °C for 5 h. Samples were then re-ground and calcined in air at 700 °C for 3 h to form the crystallized powders.
X-ray diffraction (XRD) patterns were collected using a Bruker D2 PHASER diffractometer in Bragg–Brentano geometry employing Ni filtered CuKα radiation. Data collection were performed from 5 to 130°2θ using a LynxEye linear position sensitive detector. A step width of 0.02°2θ and a counting time of 0.5 s step−1 were used. The diffractrograms were evaluated by the Rietveld method using the program EXPGUI (Toby, Reference Toby2001) a graphical user interface to General Structure Analysis System (GSAS) and profile function 4 (Larson and Von Dreele, Reference Larson and Von Dreele2000). Partial occupancies of Fe and Ti were difficult to refine, and thus set to nominal composition values. Attempts to refine site occupancies of Pb or O resulted in non-physical or diverging fits, and were hence assumed to be unity. All other structural parameters of samples up to x = 0.3 were refined. The z-coordinates of the atomic positions were also refined, except Pb, where the coordinates were fixed at (0, 0, 0) to define the origin. Isotropic displacement coefficients (U iso) of all atoms were refined up to x = 0.2. To increase stability of the fit, U iso of Ti, Fe, and O of x = 0.3 sample were set to those of the x = 0.2 sample and the U iso of Pb was refined. GSAS profile function 4 parameters such as sample displacement (shft) and all anisotropic strain broadening terms (S hkl ) were refined. The pseudo-Voigt mixing ratio (η) of the profile function was refined except at x = 0.3 where the line shape was considered Lorentzian (η = 1). Anisotropic strain in tetragonal symmetry was modeled with four S hkl parameters to account for the strain induced, reflection (hkl) dependent, lineshape broadening. The correlations between crystallite size (Scherrer) broadening (LX), S hkl terms, and η adversely affected the quality of the refinements, mainly above the x = 0.05 composition. Consequently, the LX value of PTF samples with x = 0.075 and beyond was assumed to be constant and held at the LX value extracted from the x = 0.05 refinement. The background was fitted using a six-term shifted Chebyshev polynomial function.
III. RESULTS AND DISCUSSION
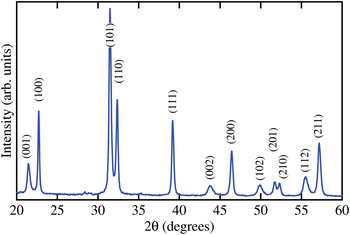
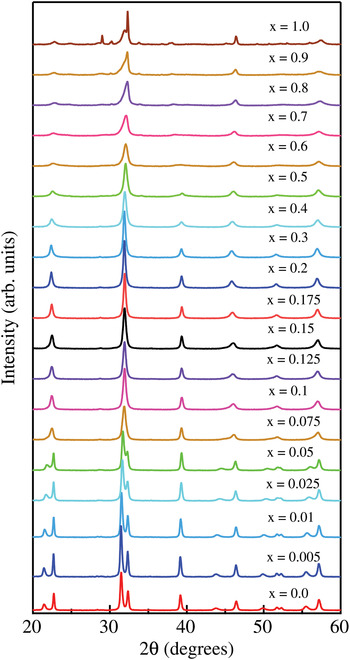
The powder diffractograms of PTF samples (x = 0, 0.005, 0.01, 0.025, 0.05, 0.075, 0.1, 0.125, 0.15, 0.175, 0.2, and 0.3) showed that they were free of common impurity phases, such as the pyrochlore phases Pb2Ti2O6 or Pb2Ti2O7. A low intensity sharp peak resulting from CuKβ leakage was observed at the low theta base of the most prominent peak. This region was not excluded and may have a small negative effect on the goodness-of-fit. All the diffraction peaks of PbTiO3 were indexed using tetragonal P4mm (99) symmetry (Nelmes and Kuhs, Reference Nelmes and Kuhs1985) as shown in Figure 1. Rapid decrease of (001)–(100) tetragonal splitting was observed up to x = 0.1, after which splitting was no longer visible. Diffraction peaks of the samples in the composition range x = 0.1–0.3 show broadening and increased asymmetry. Samples with Fe concentration x ≤ 0.3 are free from impurity phases. The diffractogram of x = 0.4 has minor reflections from the ferromagnetic magnetoplumbite phase, PbFe12O19. The intensities of these reflections increase with increasing iron concentration. A recent study (Kleebe et al., Reference Kleebe, Lauterbach, Silvestroni, Kungl, Hoffmann, Erdem and Eichel2009) reports magnetoplumbite phase formation in Pb(Zr0.6Ti0.4)O3 ceramics doped beyond the 3 mol% solubility limit with Fe3+ ions. The formation of magnetoplumbite could be responsible for the room-temperature ferromagnetism reported in 4 mol% Fe-doped PbTiO3 nanocrystals (Ren et al., Reference Ren, Xu, Wei, Liu, Hou, Du, Weng, Shen and Han2007). The end member x = 1 sample contains PbFe12O19, Pb2Fe2O5, and lead oxide (PbO), which confirms phase segregation at higher Fe-dopant concentrations. Diffractograms of the PTF sample series are shown in Figure 2.
(Color online) Diffraction pattern of PbTiO3 prepared using the sol–gel route. Diffraction peaks are indexed with a tetragonal P4mm crystal structure.

(Color online) Diffraction patterns of the PbTi(1−x)Fe x O(3−δ) solid solution series. The evolution of the diffraction peaks indicates loss of tetragonal splitting at x = 0.1. Samples with x ≥ 0.4 show diffraction peaks belonging to secondary phases, mainly PbFe12O19.

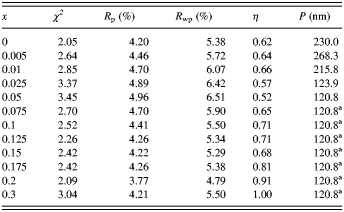
Rietveld refinements yielded goodness-of-fit (χ2) values between 2.05 and 3.45. The profile residual (Rp) and weighted profile residual (R wp) values were in the ranges of 3.77–4.96% and 4.79–6.51%, respectively. Significantly large correlations between LX, η, and S hkl parameters were observed in fits of samples with iron composition x ≥ 0.075. Reliability of the refined parameters was improved by carefully constraining these parameters as discussed above. The line shapes changed from having more Gaussian characters to more Lorentzian characters with increased Fe concentration. Consequently, η was allowed to refine. Peak broadening and asymmetry have many different origins. Three main contributions to line shape are considered to be instrumental broadening, crystallite size broadening, and strain broadening. Strain is a measure of lattice stress existing in the material as a result of crystal imperfections. Residual stresses in PTF originate primarily from the paraelectric → ferroelectric phase transition that occurs on cooling from growth temperature (Levin et al., Reference Levin, Slutsker, Li, Tan and Roytburd2007). In addition, strain contributions from oxygen vacancies, other forms of point defects, line defects, and plane defects may result in line shape broadening (Jenkins and Snyder, Reference Jenkins and Snyder1996). Several models were tested to best-fit datasets refining a minimum number of parameters. Higher quality of microstrain-containing refinements indicated the existence of strain-induced line shape broadening. The crystalline size distribution of PTF depends on sintering temperature and time duration, and is presumably less sensitive to changes in the composition. It was clear that constraining LX was more feasible than constraining η or S hkl . Therefore, LX was held constant at the value of the x = 0.05 fit for all higher Fe concentrations. Final fit residuals, χ2, η values, and crystallite sizes at different Fe concentrations are listed in Table I.
Rietveld refinement fit parameters, pseudo-Voight mixing ratios, and crystallite sizes of PbTi(1−x)Fe x O(3−δ) samples.

aHeld constant during refinement.
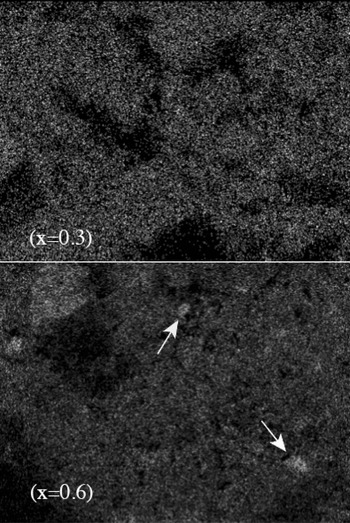
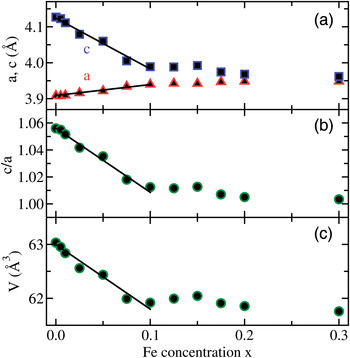
The c/a ratio of our PbTiO3 sample, 1.056, is lower than the value 1.066 (Palkar et al., Reference Palkar, Purandare, Gohil, John and Bhattacharya2007) reported in the literature. The linear change in unit-cell parameter, following Vegard's law (Denton and Ashcroft, Reference Denton and Ashcroft1991), is a strong indication that B-site doping is homogeneous. The sol–gel preparation technique is known to produce samples with better homogeneity and high purity at lower processing temperatures compared to traditional solid state synthesis (Mulla et al., Reference Mulla, Natarajan, Gaikwad, Samuel, Guptha and Ravi2007). The elemental maps of Pb, Ti, and Fe show uniform dopant distribution up to x = 0.3. Figure 3 shows the elemental maps captured using FeKα fluorescence line intensity. White arrows indicate Fe-rich regions that appear to be Pb-deficient in Pb elemental maps.
Elemental maps of PbTi(1−x)Fe x O(3−δ), x = 0.3 and x = 0.6 samples using the FeKα fluorescence line. Arrows indicate Fe-rich regions.

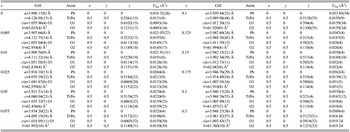
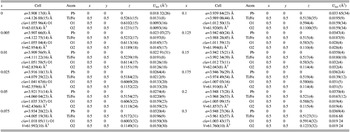
Rapid decrease of tetragonal distortion and the absence of XRD reflections from segregated phases support the conclusion that Fe-ions are indeed homogeneously distributed. Figure 4(a) shows that both unit-cell parameters a and c change linearly with concentration until 10 mol% (x = 0.1) of the B-sites are doped with Fe. Beyond x = 0.1, neither unit-cell parameters nor tetragonal distortion (see Figures 4 and 5) follow the same linear trend. Therefore, the solubility limit of Fe in PbTiO3 host B-site using our sol–gel synthesis method is approximately 10 mol%. The x = 0.3 sample has minimum tetragonal distortion. The changes in tetragonal distortion and cell volume vs. concentration are shown in Figures 4(b) and 4(c). The Wyckoff positions (x, y, and z) for Pb (1a), Ti/Fe (1b), O1 (2c), and O2(1b), and unit-cell constants a, c are given in Table II.
(Color online) Cell parameters obtained from Rietveld refinement of PTF XRD data at room temperature as a function of Fe concentration. (a) Unit-cell parameters a and c, (b) tetragonal distortion c/a, and (c) cell volume.

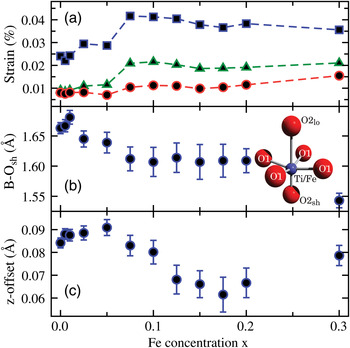
(Color online) As a function of Fe concentration: (a) the variation of strain in the (00l) (triangles), (hk0) (squares), and (111) (circles) planes; (b) the shortest B–O bond length (B–O2sh); (c) the offset in the z-direction between the B-site cation and oxygens in a, b faces (|B(z)–O1(z)|).

Structural parameters for PbTi(1−x)Fe x O(3−δ) samples obtained by Rietveld refinement. Space group P4mm.
The common tetragonally distorted PbTiO3 structure consists of an off-center shifted Ti4+ ion surrounded by six oxygen atoms. The oxygen octahedron is elongated and shifted along the c-direction, with respect to Pb2+ ions. The Pb2+ ions are 12-fold coordinated by oxygens and are located at the corners of the unit cell. Ti4+ and Fe3+ have similar ionic radii, 0.605 and 0.58 Å, respectively (Shannon, Reference Shannon1976) The ionic radius of the A-site occupying Pb2+, 1.63 Å, is much larger than those of Ti4+ or Fe3+. Consequently, Fe3+ is preferentially substituted at the B-site. When a Ti4+ is replaced by Fe3+, charge compensation necessitates formation of oxygen vacancies. Density functional theory (DFT) calculations by Meštrić et al. (Reference Meštrić, Eichel, Kloss, Dinse, Laubach, Laubach, Schmidt, Schonau, Knapp and Ehrenberg2005) using a 2 × 2 × 2 PbTiO3 supercell have shown that formation of oxygen vacancies along the c-direction is energetically more favorable than other directions. The effect of spin polarization on the energy was found to be insignificant. Furthermore, the cation nearest to the vacant site moves away from the vacancy, shortening the metal–oxygen bond distance. With homogeneously distributed dopants, the composition x = 0.125 corresponds to one Fe3+ ion substitution and nominally one-half oxygen vacancy created per 2 × 2 × 2 supercell.
Modification of PbTiO3 B-sites by Fe3+ tends to form (Fe′Ti–VO˙˙)˙ defect dipoles with partially charge-compensated oxygen vacancies (Eichel, Reference Eichel2007). In this notation Fe′Ti represents the negative charge created by replacing Ti4+ ion with Fe3+ in an otherwise neutral crystal structure. Similarly, VO˙˙ represents the doubly positive charge resulting from O2− vacancy following the symbolism by Kroger and Vink (Reference Kroger and Vink1956). (Fe′Ti–VO˙˙)˙ defect dipoles are energetically favored to form along the polarization direction of the crystal (Meštrić et al., Reference Meštrić, Eichel, Kloss, Dinse, Laubach, Laubach, Schmidt, Schonau, Knapp and Ehrenberg2005). Ideally, one oxygen vacancy could compensate two Fe′Ti charges. The inclusion of vacancies in terms of oxygen partial fractions based on the Fe3+ concentration had no effect on the final fit, thus, oxygen occupancy was held constant at unity.
We have found that both size-type and anisotropic microstrain-type peak broadening are present in diffraction patterns. The instrument broadening effect has been parameterized using NIST SRM 660a LaB6 standard. Anisotropic microstrain was found to be the dominant contributor to line broadening, especially at high Fe concentrations. The evolution of the size of coherently diffracting domains was refined by up to 5 mol% Fe concentration. The size of the coherently diffracting domains (assumed to be spherical) was evaluated using the Scherrer formula (Patterson, Reference Patterson1939):
 $$P\left({{\rm nm}} \right)= \displaystyle{{ 18\, 000\; K\lambda } \over {\pi \lpar {\rm LX } - X_{{\rm inst}} \rpar }},$$
where K = 0.9 is the Scherrer constant, λ the wavelength in nanometers, X inst the instrumental broadening, and LX the refined Lorentzian coefficient for size-type broadening (Larson and Von Dreele, Reference Larson and Von Dreele2000). Calculated Scherrer particle sizes are listed in Table I. The anisotropic strain broadening has been modeled using the description of Stephens (Stephens, Reference Stephens1999). Microstrain-type broadening in this model is considered a manifestation of the distribution of reciprocal unit-cell parameters. This distribution can originate from crystalline defects such as oxygen vacancies or local inhomogeneities in chemical composition. The microstrain along the direction [hkl] has been calculated according to the relationship (Stephens, Reference Stephens1999; Larson and Von Dreele, Reference Larson and Von Dreele2000):
 $$\displaystyle{{\delta d_{hkl} } \over {d_{hkl} }}= \displaystyle{{\pi \,\lpar \sigma \,\lpar M_{hkl} \rpar \rpar ^{1/2} } \over { 18\, 000M_{hkl} }}\comma \;$$
where M hkl = 1/d 2 hkl and σ 2 (M hkl ) is the variance of M hkl . Complete description of the model can be found elsewhere (Stephens, Reference Stephens1999). In tetragonal symmetry, the strain broadening contribution to the width of the diffraction peak (hkl) is parametrized by (Stephens, Reference Stephens1999; Toby, Reference Toby2001):
 $$\eqalign{ \sigma \,^ 2 \lpar M_{hkl} \rpar & =S_{ 400} \; \lpar h^ 4+k^ 4 \rpar \; +S_{00 4} \; l^ 4+ 3S_{ 220} \lpar h^ 2 k^ 2 \rpar \cr & \quad + 3S_{ 20 2} \; \lpar h^ 2 l^ 2+k^ 2 l^ 2 \rpar .}$$
GSAS profile function 4 (Larson and Von Dreele, Reference Larson and Von Dreele2000) has been utilized to refine S hkl coefficients, S 400, S 004, S 220, and S 202. The values of parameters S400 and S202 are significantly different from the others, suggesting that the crystallite strain is indeed anisotropic. The S202 parameter values are negative, thus variation of a and c unit-cell parameters has a negative correlation. Anisotropic strain contains useful information about “soft” crystal direction with respect to composition variations. Formation of (Fe′Ti–VO˙˙)˙ defect dipoles upon iron doping could build up extra forces that elevate the level of strain anisotropy. Figure 5(a) shows the variation of lattice strain along different crystal directions, which represents the quantitative correlation between the magnitude of the strain and the Fe3+ concentration. Since the number of oxygen vacancies formed is proportional to x, strain can also be linked to the preferred directions of vacancy formation. Since the (Fe′Ti–VO˙˙)˙ defect dipole is singly positive, simple electrostatic stability conditions would also require the closest oxygen ions to move toward each other, causing strain. Other mechanisms such as an electron (e′) trapped in the vacancy site could potentially satisfy the charge compensation requirements. Oxygen vacancy centered oxygen–oxygen and B-site cation–cation displacements induce strain in the lattice planes. Dissimilar ionic radii, Fe3+ being 0.025 Å smaller than Ti4+, could also play a role in increasing strain proportional to the Fe-concentration. Anomalous increase of strain in all directions at Fe concentrations about the solubility limit may originate from structural defects. The (111) crystal planes of PbTiO3 are unaffected by tetragonal distortion evidenced by the non-splitting diffraction peak. Throughout the PTF series, strain in the (111) planes remains small compared to all other directions. The differences in tetragonality between unit cells containing Ti4+ and Fe3+ ions, and formation of oxygen vacancies preferentially along the c-direction may have contributed to the comparatively large strain in the (hk0) crystal planes.
The change in short B–O bond length in the c-direction (B–O2sh) vs. Fe concentration is shown in Figure 5(b). In the inset, short and long bond length oxygens are labeled O2lo and O2sh, respectively. The decrease in B–O1sh bond length below the solubility limit is in agreement with theoretical calculations (Meštrić et al., Reference Meštrić, Eichel, Kloss, Dinse, Laubach, Laubach, Schmidt, Schonau, Knapp and Ehrenberg2005). The bond length remains unchanged for 0.1 ≤ x ≤ 0.2 but shows a large decrease at x = 0.3, possibly suggesting the incipient failure of the P4mm model. The four oxygen atoms on the a and b faces (labeled O1 in Figure 5(b) inset) have different z-coordinates than the B-cation because of ferroelectric polarization. The z-coordinate offset between B-cation and O1 oxygens decreases when the unit cell becomes more centro-symmetric. The offset decreases as shown in Figure 5(c) and remains non-zero even at Fe concentration x = 0.3. Therefore, all analyzed samples possess displacive type ferroelectric properties.
A large number of oxygen vacancies could force oxygen octahedra to shift from corner-sharing to edge-sharing or even face-sharing configurations, where a tetragonal model would no longer apply. Tilted Fe polyhedra break long-range periodicity in crystalline material. Formation of segregated phases could result in ferroelectric, Ti-rich phases and ferromagnetic, Fe-rich phases in PTF powders. The magnetoplumbite impurity phase observed in x ≥ 0.4 samples contains both edge-sharing and face-sharing type Fe polyhedra. Local structure probes such as Pair Distribution Function (PDF) analysis or X-ray Absorption Spectroscopy (XAS) can be particularly useful in detecting the Fe concentration at which tilted Fe polyhedra are formed. Employing XAS may be particularly useful in determining the elemental specific average local structures.
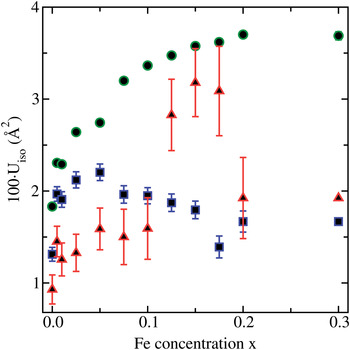
The isotropic displacement coefficients (U iso) were constrained such that all oxygen ions have the same value. Similarly, Ti and Fe ion U iso parameters were constrained and refined in the fit. The behavior of the U iso parameters was tested against different particle size broadening models and trends were verified to be similar. Figure 6 shows the refined U iso parameters against Fe-composition.
(Color online) Isotropic displacement coefficients, U iso, multiplied by 100 for Pb (circles), Ti/Fe (squares), and O (triangles) vs. Fe concentration.

U iso parameters of Pb systematically increase with increasing Fe concentration. This trend may have dominant non-thermal contributions from elevated disorder or lead loss. The B-site U iso parameter increases at lower concentrations (x < 0.05) and decreases afterwards. Any increase in U iso of B-site cations or oxygen anions may have significant partial contributions arising from disorder. At higher concentrations, B-site ions are more tightly bound to oxygen anions as evidenced by the decrease in B–O bond length. Tightly bound atoms result in reduced unit cell volume and lower U iso values. Furthermore, the oxygen octahedron encapsulating the B-site cation is clearly asymmetric, thus treating thermal factors as isotropic is likely to be an invalid approximation, particularly at higher Fe-concentrations. In addition, the number of oxygen vacancies (increasing with Fe-concentration) was ignored in the refinement, and may contribute to the anomalous behavior (above the solubility limit) of the oxygen U iso parameter.
IV. CONCLUSION
Samples of PbTi(1−x)Fe x O(3−δ) (PTF) with 0 ≤ x ≤ 1 were prepared using a sol–gel synthesis route. X-ray diffractograms of samples up to x = 0.3 indicate a perovskite ABO3 structure, free of impurities such as pyrochlore phases or iron oxides. PTF samples with x ≥ 0.4 have secondary phases, mainly PbFe12O19. The end member (x = 1) consists of PbFe12O19, Pb2Fe2O5, and lead oxide (PbO). The results obtained from Rietveld refinement of these data using a B-site composition-based PbTiO3 tetragonal (P4mm) model show a rapid decrease in the c unit-cell parameter and a slow increase in the a unit-cell parameter with increasing Fe concentration. The decrease in tetragonal distortion is expected to result in a reduction of ferroelectricity with increasing Fe-dopant concentration.
The linear variation of PTF unit-cell parameters on Fe-concentration persists up to x = 0.1, the B-site Fe3+ solubility limit using our sol–gel synthesis technique, subjected to a maximum sintering temperature of 700 °C. These results suggest that the Fe dopants are homogeneously distributed only up to x ≈ 0.3. In contrast, Palkar's PbTi0.5Fe0.5O(3−δ) sample (Palkar and Malik, Reference Palkar and Malik2005) shows clear evidence of (001)–(100) tetragonal splitting. This sample was prepared at 1000 °C which is 300 °C higher than our processing temperature. Therefore, the splitting of diffraction peaks at x = 0.5 could be the result of phase segregation where a Ti-rich phase remains tetragonally distorted.
Formation of charge compensating oxygen vacancies, hence (Fe′Ti–VO˙˙)˙ defect dipole formation upon B-site Fe3+ substitution is consistent with the previous EPR (Eichel, Reference Eichel2007; Erdem et al., Reference Erdem, Kiraz, Somer and Eichel2010) and theoretical (Meštrić et al., Reference Meštrić, Eichel, Kloss, Dinse, Laubach, Laubach, Schmidt, Schonau, Knapp and Ehrenberg2005) investigations. The creation of oxygen vacancies in the c-direction at the O-site furthest from B-site Fe+3 is energetically favorable (Meštrić et al., Reference Meštrić, Eichel, Kloss, Dinse, Laubach, Laubach, Schmidt, Schonau, Knapp and Ehrenberg2005). The strain in the c-direction is distinctly higher as a result of inhomogeneities in tetragonality and additional contributions from oxygen voids formed in the (hk0) planes. Formation of oxygen vacancies at O2lo sites and the lowering of B–O2sh bond length with Fe doping are consistent with theoretical predictions (Meštrić et al., Reference Meštrić, Eichel, Kloss, Dinse, Laubach, Laubach, Schmidt, Schonau, Knapp and Ehrenberg2005). The decrease of B–O bond length with Fe concentration resulted in lower Uiso (B) parameters. Distorted oxygen octahedra with off-center shifted B-site cation imply the continued existence of displacive type ferroelectric properties. Defect dipole formation may contribute to enhanced ferroelectric properties.
ACKNOWLEDGEMENT
This work was supported by the National Science Foundation under grant no. DMR-0806935.