


I. Introduction
For medical devices requiring notified-body involvement under the EU Medical Device Regulation, private intermediaries assess privately produced evidence as part of the applicable conformity-assessment procedure. Manufacturers must compile technical documentation of considerable depth and breadth, and notified bodies assess conformity with the applicable general safety and performance requirements of Annex I within the scope of that procedure.Footnote 1 This system gives institutional form to the precautionary principle, addressed in the precautionary-principle case law of the EU courts,Footnote 2 by interposing a verification layer between the manufacturer and the market. That layer can only function, however, if the evidence it must assess is coherent, traceable and updateable. And here the difficulty begins.
What happens, then, when the evidence on which this gateway depends is privately fragmented, distributed across organisations in different jurisdictions, and exposed to coordination failures? The Regulation addresses such failures through manufacturer obligations and documented QMS and supplier controls, but does not prescribe the complete module-by-module governance schedule examined here. Figure 1 sketches this arrangement and the assumption on which it rests. An answer, suggested by the European Commission’s own data, is that the system’s front-end performance is seriously compromised. The 14th notified-body survey (a census of all fifty-one MDR- and IVDR-designated bodies, conducted in March–April 2025 with a 100% response rate) makes the point sharply: Thirty-five of the fifty MDR-designated notified bodies report that at most half of manufacturer submissions are complete at first assessment.Footnote 3 Incomplete applications account for 39% of reported refusal reasons. In the separate time-allocation item, forty-four notified bodies estimated that, on average, 58% of the time from written agreement to certificate issuance lay with the manufacturer. Figure 2 sets these three numbers side by side.
The MDR’s institutional premise. For devices requiring notified-body involvement, a private verification layer stands between privately produced evidence and market access, under a public frame that gives the precautionary principle institutional form. The layer functions only if the evidence it assesses is coherent, traceable and updateable; the Regulation supports that assumption through manufacturer obligations and QMS and supplier controls, without prescribing a complete module-by-module governance schedule. Sections II to IV examine what follows when the assumption fails.

The front end in three numbers. Of the fifty MDR-designated notified bodies, thirty-five report that at most half of manufacturer submissions arrive complete at first assessment; incomplete applications account for 39% of reported refusal reasons; and the mean manufacturer-side share of agreement-to-certificate time estimated by forty-four notified bodies is 58%.
Source: European Commission, 14th Notified Body Survey (2025); cf. Table 1.

These numbers expose more than an administrative inconvenience. They point to a structural deficit in what Hood, Rothstein and Baldwin identified as the informational dimension of risk-regulation regimes.Footnote 4 Regimes vary, within that framework, along three dimensions: regulatory content (the standards that govern conduct), institutional context (the political, economic and cultural setting) and organisational architecture. To the last of these belong the mechanisms through which information is gathered, processed and acted upon. My argument here is that the MDR’s difficulty lies squarely in the third dimension, but in a specific region of it that the original framework treated only in passing. Whether the regime gathers information is not the question; it does, through the conformity-assessment procedure. What matters is who controls the evidence the assessment depends on, how that control is coordinated across organisations and jurisdictions, and what happens when coordination fails. In a single sentence, the central claim of this article runs as follows: the MDR assigns legal responsibility for technical documentation to the manufacturer but does not prescribe a complete module-by-module governance schedule for distributed evidence chains, the practical interfaces through which a multi-actor file is kept coherent, traceable and updateable across the device lifecycle. That gap, duties assigned but their module-level coordination incompletely specified, is what this article calls the evidence-governance deficit: in plain terms, the presence or absence of rules that say who may, and who must, act on the technical file at any given moment.
The gap extends to technology-intensive regulation more broadly. Taeihagh, Ramesh and Howlett mapped regulatory challenges across emerging technologies without formalising the distributional structure of the governance problem;Footnote 5 Paul analysed EU risk-based technology regulation in competitive transatlantic framing.Footnote 6 Within EJRR itself, recent work has examined MedTech governance from several angles without addressing evidence ownership directly. Biasin and Kamenjašević compared EU and US approaches to AI-based medical device cybersecurity;Footnote 7 Biczysko-Pudełko examined the regulatory environment for Internet of Medical Things users.Footnote 8 Additionally, Gallinella and Christiansen found that delegated rule-making remained largely “business as usual” even during crises: a finding whose implications for the MedTech delegation chain, where failure occurs under normal operating conditions, deserve attention.Footnote 9 On the MDR’s implementation trajectory itself, Shatrov and Blankart provided early evidence that the Regulation’s goals were unlikely to be met within the original transition period.Footnote 10
Black and Baldwin refined the Hood–Rothstein–Baldwin framework by insisting that risk-based regulation must be “really responsive”: attentive to the institutional environment, to the cognitive limitations of decision-makers and to the behavioural responses of regulated firms.Footnote 11 The argument here extends their insight in one direction. In the medical-device domain, the responsiveness deficit is not one of regulatory attention. Commission surveys track the NB population annually; the MDCG coordinates among national authorities; Articles 39 and 44 MDR provide for joint assessments of notified bodies. The deficit lies elsewhere, namely in the regime’s access to the knowledge base. When clinical evaluation reports sit with a contract research organisation in one Member State, risk-management files with a consultancy in another, and post-market surveillance data with a commercial affiliate in a third country, the strain falls on the notified body. Structurally, not incidentally, its capacity for coherent risk assessment is compromised. Regulatory attentiveness alone does not repair that.
Two features of the MDR regime make this problem distinctive. One is the coupling of risk assessment to patent rights. Unlike pharmaceuticals, where supplementary protection certificates extend exclusivity to compensate for regulatory delays, medical devices enjoy no equivalent mechanism in Europe.Footnote 12 Every month consumed by evidence-coordination failures is a month of patent runway lost: a coupling that transforms a governance problem into an economic one. A second is the comparative dimension: the United States retains a central FDA clearance or approval decision, although accredited third-party organisations may perform the primary review of eligible 510(k) submissions. Structural differences between these two architectures create evidence-portability costs that are not reducible to processing-time differentials.
This article situates itself within debates that EJRR has engaged and extends them in one direction. It refines the informational dimension of risk-regulation regimes for settings in which the regulated activity generates privately owned, multi-jurisdictional knowledge assets. It turns out that the way control over the evidence is distributed constrains regime performance whether or not information is gathered at all. Put more simply: the regulator can be no better informed than the file in front of it, and the file can be no better than the coordination behind it. In doing so, it connects to the EJRR’s December 2024 treatment of delegated rulemaking under Articles 290 and 291 TFEU.Footnote 13 The notified-body assessment relationship is not itself a delegation under Articles 290 and 291 TFEU; the article identifies where that arrangement breaks. As a test case, the Commission’s December 2025 simplification proposal (COM(2025) 1023 final)Footnote 14 serves to illustrate the gap. It addresses content and procedure and clarifies documentation responsibilities for outsourced design and manufacture through the proposed amendment to Article 10(15), but does not prescribe a complete coordination and update schedule for the wider evidence chain.
A scope boundary should be stated at the outset. No causal model of review duration is estimated here, nor are the temporal dynamics of the certification process modelled. Its dependent variable is the governability of regulatory-relevant evidence: the capacity of the regulatory system to access, coordinate and act on the knowledge it needs to perform its precautionary function.
The argument proceeds from diagnosis to design. Section II locates evidence governance within the risk-regulation literature and distinguishes the four dimensions of a distributed file: production, custody, coordination, updating. The condition of the evidence base itself, on both sides of the Atlantic, is established in Section III, drawing on the Commission’s survey census and 98,378 FDA 510(k) records. Section IV traces the damage itself through five institutional channels, four of which concern documentary coordination while a fifth (data-protection law) compounds the other four. Whether the December 2025 reform proposal has recognised the same problem is the question of Section V; the answer developed there is: only in part. Section VI takes up the instrument question, weighing four legal vehicles against five evaluative dimensions and examining common specifications under Article 9(1) MDR for technical schedule requirements and legislative amendment for any new autonomous duty.
Three clarifications set expectations. The article does not offer a causal evaluation of the MDR; the completeness figures are read as institutional indicators, not as application-level measurements. Nor is data protection treated for its own sake; the GDPR enters only where it adds a coordination layer to the evidence chain. And no new institutional actor is proposed: the remedies examined in Section VI work with the Regulation’s existing instruments.
II. Conceptual framework: risk, precaution and the informational dimension
1. Risk regulation, precaution and the evidence-governance problem
Whether the numbers reported in the Introduction amount to a governance failure, and not merely to an administrative nuisance, depends on what risk regulation requires of its evidence base. Risk regulation, in the sense that this journal has given the term, concerns the institutional arrangements through which public authorities identify, assess, manage and communicate risks to human health, safety and the environment.Footnote 15 The precautionary principle enters when scientific evidence of a risk is plausible but not conclusive, authorising protective measures that are proportionate to the level of protection sought.Footnote 16 In medical-device governance, the precautionary principle is not invoked episodically; it is built into the conformity-assessment architecture. For devices requiring notified-body involvement under Article 52 MDR, market placement depends on completion of the applicable conformity-assessment procedure. Ordinary Class I devices are generally subject to manufacturer self-declaration; notified-body involvement for sterile, measuring and reusable surgical Class I devices is limited to specified aspects. Verification rests on clinical evidence, risk-management documentation and technical assessment. This is an ex ante precautionary filter, and its effectiveness depends entirely on the quality and accessibility of the evidence base. Much of what follows turns on that dependence.
One scenario has received comparatively little attention in the EJRR’s risk-regulation debate: the pre-cautionary filter can fail even when the science is tractable and the regulatory standard well specified. It fails because the evidence needed for assessment is fragmented across private organisations whose coordination may remain incomplete despite the QMS and supplier controls the regime requires. This is a different type of uncertainty from those catalogued in the precautionary literature.Footnote 17 One might call this governance uncertainty: the evidence exists, but no single actor in the hybrid regulatory arrangement controls the full evidentiary architecture, and so it cannot be reliably assembled. Whether a regime leaves room for uncertainty of this kind depends on how it is built, and the MDR’s construction is distinctive.
2. The MDR as a hybrid regulatory arrangement
The MDR is best understood as a sector-specific variant of the Union’s broader conformity-assessment architecture rather than as a delegation chain in the Articles 290 and 291 TFEU sense.Footnote 18 Manufacturers remain the primary duty-bearers. Notified bodies are private organisations designated within an EU framework to perform regulated third-party conformity assessment; they are not Union agencies, and their role should not be confused with delegated or implementing powers. National competent authorities designate and supervise notified bodies, while the Commission and the MDCG seek to maintain coherence across the system. The architecture is hybrid: publicly framed, privately operated, nationally supervised and supranationally coordinated.
This arrangement has a distinctive feature: the knowledge on which the final assessment depends is produced not by any public actor but by the regulated firm and its subcontractors. Why would a legal order choose that design? Majone’s answer was the shift from the positive to the regulatory state: rule-making displacing taxing and spending as the mode of governance.Footnote 19 Carpenter’s history of the FDA supplies the counterpoint: an agency that met information asymmetry by building organisational capacity of its own.Footnote 20 The contrast carries the point. Where the US model retains a central FDA decision, the EU model relies on notified-body certification alongside public designation, supervision and market surveillance.Footnote 21 In the vocabulary of Abbott, Levi-Faur and Snidal, the notified body is a regulatory intermediary, and an intermediary’s effectiveness is bounded by the quality of the information the regulated target supplies.Footnote 22
Article 10(1) MDR obliges the manufacturer to see to it that devices are “designed and manufactured in accordance with the requirements of this Regulation.” Article 10(8) requires the manufacturer to “keep available for the competent authorities” the technical documentation specified in Annexes II and III. Article 15 adds a layer that receives less attention than it deserves: every manufacturer must have available at least one person responsible for regulatory compliance (PRRC). The PRRC must at least ensure that conformity is appropriately checked before release, the technical documentation and declaration of conformity are drawn up and kept current, post-market surveillance and reporting duties under Articles 87–91 are fulfilled, and the required statement for investigational devices is issued. Micro and small enterprises may externalise the function but must have it permanently and continuously at their disposal. Annex IX supplements this with quality-management-system requirements that extend notified-body surveillance to suppliers and subcontractors where appropriate.
The MDR therefore does not leave documentary coherence wholly unassigned. It creates compliance nodes (Article 10, Article 15, the PRRC, the QMS provisions of Annex IX) and audit hooks through which notified bodies and national authorities can verify documentation. What the Regulation does only indirectly is prescribe how those nodes should govern a dispersed evidence chain in day-to-day practice. It requires responsibilities and outsourced-process controls to be documented, but does not prescribe a complete module-by-module schedule for custody, reconciliation and updating across the manufacturer’s supply chain. When these artefacts are distributed across a CRO, a patent-holding company, a contract manufacturer and a commercial affiliate, the manufacturer’s legal obligation and the PRRC’s compliance duty do not automatically translate into operational governance over the evidence base. The gap is not one of legal responsibility (that is clearly assigned) but of evidence governance: the practical capacity to keep a distributed file coherent, traceable and updateable.Footnote 23
Judicial control is correspondingly dispersed. Under the predecessor Medical Devices Directive, the Court addressed the regulatory status of notified bodies in Schmitt v TÜV Rheinland. Member States, the Court held, must see to it that notified bodies carry out their tasks in conformity with the relevant legislation; where there is evidence indicating non-compliance, the notified body must take the steps needed to protect health.Footnote 24 The ruling did not impose a free-standing duty on notified bodies to discover every defect in every file. Its lesson is modest but relevant. What the regime presupposes is a functioning evidence chain capable of generating reliable indications of non-compliance. Where the evidence chain is fragmented across organisations, the premise on which Schmitt’s reasoning rests is structurally weakened. The right to health protection under Article 35 CFREUFootnote 25 is engaged in the background, though it is Article 10 and Article 15 MDR, not the Charter, that bear the operational weight of accountability in this domain. Accountability of that kind presupposes that one can say who was supposed to do what with the file. Before anything else, then, the object of that question needs a name and a boundary.
3. Evidence governance: four dimensions of a distributed file
Before formalising the problem, its conceptual boundaries should be specified. Evidence governance, as the term is used here, denotes the allocation of responsibility, access, coordination and update duties for the documents through which regulatory compliance is demonstrated and re-assessed.
The term is easiest to grasp by what it is not. It is not coextensive with quality management: whether the file’s content is accurate and complete is governed in detail by the MDR and the harmonised standards beneath it. Nor is it data protection: whether personal data inside the file are lawfully processed is the GDPR’s territory. Evidence governance asks a cross-cutting question: who is entitled, and who is obliged, to create, hold, reconcile and revise the file, and who must be told when it changes. The third question cuts across existing QMS and data-protection duties, but lacks the complete module-level schedule examined here. Four dimensions matter. A first concerns production: who creates the relevant document or data stream (the clinical evaluation report, the risk-management file, the software validation record, the post-market surveillance plan). Next comes custody and access: who holds the authoritative version and who can retrieve it promptly and authenticate it when a notified body, a competent authority or the manufacturer’s own PRRC requires it. A further dimension is coordination: who keeps adjacent components of the file internally consistent when one of them changes. Finally, updating: who must revise the file when the device changes, when post-market information alters the risk profile, or when a field-safety corrective action is initiated.
An example makes the four dimensions concrete. Take a clinical evaluation report. A contract research organisation typically produces it; the manufacturer’s regulatory function holds the authoritative version and must be able to retrieve it when a notified body asks. It must stay consistent with the risk-management file next to it; and when post-market data alter the risk picture, someone must revise it on time, and in step with the adjacent documents. Each dimension names a different failure point, and a file can be impeccable on three of them while the fourth quietly breaks.
Once framed in those terms, the language of “ownership” becomes secondary. Legal title to a working draft may sit with a contractor while regulatory responsibility remains with the manufacturer under Article 10; a consultancy may draft a risk-management file while the PRRC must see to it that the document remains current. What matters is not ownership in a narrow property-law sense but the bundle of control rights and duties sufficient to keep the file usable for conformity assessment, surveillance and corrective action. That bundle is what the article calls “evidence governance.” How the misallocation of that bundle damages assessment in practice is a separate question, taken up through five channels in Section IV. Before the channels, the framework needs two further pieces: a scale for degrees of fragmentation, and a statement of what is at stake when fragmentation grows.
4. Measuring the evidence-governance deficit
To give the governance problem analytical traction, the article deploys a coordination-cost measure drawn from information theory. Let the regulatory knowledge base be decomposed into five modules (patent core, EU-specific clinical evidence, US-specific clinical evidence, quality-system artefacts and post-market rights) and let
 ${a_{pm}} \in \left[ {0,\,1} \right]$
denote party p’s control share over module m. The ownership entropy is:
 $${H_{total}}\left( A \right) = \sum\limits_m {{w_m}\left( { - \sum\limits_p {{a_{pm}}\log {\mkern 1mu} {a_{pm}}} } \right)} .$$
In plain terms, the measure describes how control is dispersed within each module: it is zero when each module has a single controlling party and increases when a given control share is split among additional parties. The justification for this measure is institutional rather than thermodynamic. Each additional party in the evidence–ownership structure introduces a contractual interface: a sign-off obligation, a notification requirement, an audit right. In Williamson’s terms, regulatory knowledge artefacts are co-specialised assets whose fragmented ownership creates hold-up risk when updates are needed.Footnote 26 In Ostrom’s terms, fragmented ownership undermines monitoring: a threat that Ostrom identified as the central weakness of commons governance.Footnote 27 Both effects are captured by the entropy measure: clean module separation (one owner per module) contributes zero within-module control dispersion to the measure; within-module sharing generates an illustrative coordination burden that depends on the number of parties and their control shares. A full formal specification, including the axiomatic justification of the entropy measure and the parameter sensitivity, is developed in the Online Supplement. For the main text, the measure’s qualitative and ordinal properties carry the argument; its cardinal outputs are illustrative. Nothing more is claimed for it.
Two further conceptual connections deserve elaboration. A first concerns proportionality. Disproportionate protective measures are not authorised by the precautionary principle; it requires that the level of protection sought and the restrictions imposed bear a reasonable relationship to one another.Footnote 28 An evidence–governance deficit creates a proportionality problem in both directions. If the conformity-assessment filter is weakened because evidence is fragmented, residual risk borne by patients increases. If, to compensate, notified bodies impose stricter documentation demands, the compliance burden rises beyond what the device’s actual risk profile warrants. Rothstein’s work on blame avoidance suggests a mechanism: regulators who fear the reputational fallout of under-regulation may over-specify documentation requirements to protect themselves. Where the evidence base is already fragmented, that self-protection amplifies the proportionality distortion.Footnote 29 Commission recognition of a “tipping point” for device availability suggests that this dynamic is already at work.
A second connection runs through private standard-setting. Harmonised standards developed by CEN and CENELEC and cited by the Commission in the OJEU provide a route to demonstrating conformity with the MDR requirements they cover.Footnote 30 A notified body using a harmonised standard such as EN ISO 14971, or another technical standard such as EN 62304, depends on the accessibility and currency of those standards. Where access is paywalled or updates delayed, the informational dimension of the regime is weakened upstream of the manufacturer’s evidence base.
The framework can be summarised as follows: Evidence governance names the object: the allocation of production, custody, coordination and update duties over a distributed file. For how far that allocation is fragmented, the entropy measure supplies a scale. And proportionality marks the stakes, in both directions, of getting it wrong. What the framework cannot supply is the condition of the system it describes: for that, one needs data. One sentence travels ahead of them: duties assigned, module-level coordination incompletely specified. Figure 3 holds that mechanism on a single page; Sections III and IV supply the numbers and the worked case behind each arrow.
The evidence-governance mechanism in outline. Fragmented ownership of the five evidence modules, with operational coordination gaps between the actors, feeds four operational channels; a data-protection layer compounds them. The channels converge on slower conformity assessment and stalled post-market updating. Sections III and IV supply the empirical and the case-based content behind each arrow.

III. The condition of the evidence base: EU and US data
1. EU conformity assessment under the 14th notified-body survey
If the framework holds, the deficit should be visible before a single interview is conducted: files assembled by many hands should reach notified bodies incomplete, and the waiting time should sit largely on the manufacturer’s side. Both patterns appear in the data. Read through the lens of risk regulation, the 14th notified-body surveyFootnote 32 is not merely a throughput statistic. It shows the condition of the conformity-assessment system on which the MDR relies to keep inadequately documented devices off the market. Read as a distribution, the completeness figures (twenty-two notified bodies reporting that fewer than 25% of submissions are complete at first assessment, thirteen in the 25–50% band, thirteen in the 51–75% band, and only two above 75%) indicate the condition of the evidence base on which the precautionary filter depends. Where at most half of submissions are adequate at first assessment, the notified body must either expend scarce review capacity on remediation cycles or decline the application altogether; incomplete applications account for 39% of reported refusal reasons. Both outcomes have risk implications: remediation delays access to beneficial devices; refusal forces manufacturers to reapply, possibly with a different notified body whose assessment standards may diverge. Table 1 assembles the survey indicators behind these numbers, and Figure 4 shows the full response distribution on first-assessment completeness.
EU governance indicators relevant to the precautionary filter

Table 1. Long description
The table presents data on EU indicators related to MDR designated notified bodies. It has two columns: Official EU indicator and Value. The table contains eight rows with the following data: Row 1: MDR designated notified bodies (Feb 2025), 50. Row 2: MDR applications lodged, approximately 28,500. Row 3: Certificates issued, 12,177. Row 4: Completeness: 25 percent/25 percent-50 percent/51 percent-75 percent, 22/13/13/2 NBs. Row 5: NBs reporting 50 percent complete submissions, 15 of 50. Row 6: Mean estimated time share NB/manufacturer, 42 percent/58 percent. Row 7: Refusal reasons citing incomplete applications, 39 percent.
Source: European Commission, 14th NB Survey (2025).
Distribution of notified-body responses on completeness at first assessment, with the cumulative count overlaid. The two lower bands (shaded) hold thirty-five of the fifty designated bodies; the cumulative count after the second band is thirty-five and across all four bands is fifty.
Source: European Commission, 14th NB Survey (25 July 2025, data to 28 February 2025).

Team NB’s independent 2024 annual member survey confirms the pattern from a different vantage point.Footnote 33 The convergence of two data sources with different sampling frames strengthens the inference that the completeness deficit is not an artefact of one survey. The capacity challenge, on that reading, is not only one of too few intermediaries; it is also a problem of fragmented evidence arriving at those intermediaries.
An important caveat: the completeness distribution characterises notified-body assessments, not individual applications. Volume weighting is absent; the direction of any resulting bias is ambiguous. Where the analysis draws on these figures, it treats them as institutional indicators of the precautionary filter’s condition rather than as individual-application-level measures.
What the numbers mean depends on where one stands. For a manufacturer, an incomplete submission means another remediation cycle, and the 42/58 time split shows on whose side those months accumulate. For a notified body, it means scarce assessment capacity spent on chasing documents rather than on evaluating risk. For a patient, it means that the precautionary filter is working with degraded input, and a filter is only as good as what reaches it. Whether these patterns are peculiar to the EU’s institutional design is a fair question, and there is a natural comparator with which to test it.
2. The US regime and the transatlantic comparison
The FDA’s device-regulatory architecture offers a structural comparator centred on a public clearance or approval decision, including where an accredited third party conducts the primary review of an eligible 510(k) submission. Under the 510(k) pathway, median review times across the twelve largest advisory-committee panels vary widely, with cardiovascular submissions in the central range and interquartile spreads of 95–160 days. Within the cardiovascular subset itself, the Special and Traditional 510(k) pathways generate a further spread, with median review durations of approximately 30 days for Cardiovascular Special and 136 days for Cardiovascular Traditional. Behind the spread lies the difference between change-only review of an existing device and full substantial-equivalence review.Footnote 34 For the 43 FY2025 CDRH original PMAs and panel-track supplements reaching an MDUFA decision without panel review in the reporting period, average total days were 228.72, split into 168.53 FDA days and 60.19 industry days.Footnote 35 The QMSR, effective since February 2026, aligns the US quality-system regulation with ISO 13485: a convergence at the QMS level that leaves the evidence architecture above it structurally divergent.Footnote 36 Within that shared quality-system regime, review times still differ widely across advisory-committee panels (Figure 5); Figure 6 traces the cardiovascular panel’s cohort medians, and Table 2 collects the corresponding US-side indicators.
Review-time heterogeneity across the twelve largest FDA advisory-committee panels. Markers show panel-level medians of K-numbered 510(k) records; bars show interquartile ranges. Within the cardiovascular subset (CV), Special and Traditional 510(k) pathways generate an additional spread between approximately 30 and 136 day medians (not separately broken out in this figure).
Source: Author’s calculations from the March 2026 PMN96CUR extract.

Cardiovascular (CV) panel median review time by receipt-year cohort, 2018–2025. The median peaks in 2021 and subsequently declines. These descriptive cohort medians do not distinguish capacity effects from evidence-architecture effects.
Source: Author’s calculations from the March 2026 PMN96CUR extract.

US pathway regime facts. The PMA subset comprises 43 CDRH original PMAs and panel-track supplements reaching an MDUFA decision without panel review.

Table 2. Long description
A table with four rows and two columns. The columns are labeled US regime fact and Value. Row 1: FY2026 standard user fees: 510(k)/De Novo/PMA, $26,067/$173,782/$579,272. Row 2: FY2025 CDRH PMA subset: avg. FDA/industry/total days, 168.53/60.19/228.72. Row 3: QMSR effective date, 2 Feb 2026. Row 4: 510(k) records in analysed cohort, 98,378.
Sources: FDA, MDUFA V Performance Report (23 February 2026), Table 1.7; FDA, Medical Device User Fee Amendments: Fees, FY2026 standard schedule; PMN96CUR extract (March 2026).
An identification boundary deserves emphasis. The analysis characterises the K-number record cohort represented in the archived summaries. The generating script selects records by their K-number prefix without an additional decision-outcome filter. The final checks of the archived summaries, calculation code and model expressions do not constitute a new analysis of the historical raw extract. It does not estimate withdrawal or not-substantially-equivalent outcomes, and the reported durations cannot be generalised to all submissions.
For the risk-regulation analysis, the transatlantic comparison is instructive less for the timeline differentials than for the structural difference in how evidence control is organised. The FDA retains the clearance or approval decision, including for eligible submissions reviewed by accredited third parties. The EU relies on notified-body certification for the pathways requiring it, with the assessor dependent on knowledge controlled by the entity it is supposed to assess. Portability costs of reshaping a US-optimised evidence file for EU admission are not a delay that can be compressed but a structural documentation-architecture cost. Costs of this kind do not remain inside the regulatory ledger. They interact with the one asset in a device program whose value runs on a fixed statutory clock.
3. Patent term, evidence governance and the risk trade-off
A further dimension, so far peripheral in the EJRR’s medical-device debate, is the coupling between patent protection and evidence governance.Footnote 37 Europe offers no device-specific supplementary protection certificate; time consumed in the MDR certification pipeline is irrecoverable patent time. A product family whose EU evidence module is controlled by a third party faces not only a coordination cost but a patent-erosion cost, transforming the evidence-governance deficit into a market-access risk.
Put in one sentence, the coupling works like this. A patent runs on calendar time, not on regulatory time: every month a file spends in a remediation cycle is a month of protected market life spent standing still. Fragmentation upstream therefore prices itself twice: once in assessment delay, once in exclusivity forgone. What the aggregate numbers cannot supply is the mechanism. Those who assemble the files are better placed to speak to it.
IV. How ownership fragmentation weakens the conformity-assessment chain
A pattern in aggregates is what the deficit has been so far; here it acquires its mechanism. Ownership fragmentation weakens the conformity-assessment chain through five institutional channels, each observable in the survey data and corroborated by twenty-four semi-structured expert interviews conducted between April 2024 and January 2026. Four of these channels concern the coordination of regulatory documentation as such; the fifth concerns its data-protection layer, which compounds rather than substitutes for the first four. These channels are not the four dimensions of Section II by another name. The dimensions map where duties attach to a distributed file, who makes it, who holds it, who reconciles it, who revises it; the channels trace what happens in conformity assessment when that mapping fails. Interviews covered five respondent categories: regulatory-affairs directors at manufacturers (7), notified-body assessors (6), national competent authority officials (4), regulatory consultants (3) and CRO executives (4). An extended fieldwork period was chosen deliberately. Respondents interviewed in 2024 tended to attribute documentation incompleteness to MDR novelty. Those interviewed in late 2025 and January 2026, having by then completed multiple full certification cycles under the new regime, consistently described the same problems as structural and persistent. Full details of the interview design, coding strategy and saturation analysis are reported in the Online Supplement.
All twenty-four respondents confirmed that regulatory documentation for medical devices is routinely produced by multiple, legally distinct organisations. A typical product family involves patent counsel (often in a different jurisdiction), one or more CROs for clinical investigations, manufacturing sites with their own quality systems, and commercial affiliates managing post-market data across regions. One regulatory-affairs director described the preparation of a technical file for a new indication as “project managers trying to herd cats across four time zones and three legal systems” (RA-M3). Behind this anecdote lies an institutional reality: the MDR’s documentation requirements assume a degree of organisational coherence that does not exist where evidence ownership is fragmented. Five channels make the mismatch concrete.
Sign-off latency. When a notified body issues a major non-conformity finding, the manufacturer must respond within the timeline stipulated in the written agreement. Where the relevant evidence module (the clinical evaluation report, the risk-management file) is controlled by an external party, the response is delayed by the need for interorganisational sign-off. An NB assessor reported that responses involving three or more external parties took, on average, eighteen days longer than those managed internally (NB2). The figure comes from one notified body’s internal tracking and should not be generalised without further data, but it gives a concrete anchor for what the 58% manufacturer-side time share describes in aggregate. Each day of sign-off delay is a day during which the conformity-assessment process is suspended: the device is neither cleared nor refused, and the risk assessment that should underpin the decision remains incomplete.
Documentation inconsistency . Annex II MDR requires internal consistency across the elements of technical documentation: risk-management file, clinical evaluation report, post-market clinical follow-up plan. Where the regime mandates that these elements form a coherent risk narrative, and where separate organisations produce them without shared coordination, contradictions arise that go beyond administrative inconvenience. A consultant described a case in which a clinical evaluation report and a risk-management file reached opposite conclusions about the acceptable level of an adverse-event rate (CON1). Months passed before anyone noticed; the two teams had no direct communication channel. Six months of re-work followed. From a risk-governance perspective, this is a failure of the evidentiary basis on which a risk-benefit determination depends. The proportionality of any regulatory decision taken on the basis of such a determination is compromised when the underlying evidence contradicts itself. Here the precautionary case law bites: protective measures, the CJEU insists, must be based on a “sufficiently reliable and cogent” scientific basis.Footnote 38
Audit-trail fragmentation : Article 10(8) MDR requires manufacturers to keep technical documentation available to competent authorities. An NCA official recounted an inspection where the chain of custody for clinical agreements was broken across three organisations: “The device wasn’t unsafe, but the governance of the evidence was unacceptable” (NCA2). When audit trails fragment, the capacity for ex post risk management (which depends on tracing the evidentiary basis of the original conformity assessment when a field-safety issue surfaces) is compromised. Vigilance under Articles 87–92 MDR pre-supposes that the manufacturer can locate, update and submit risk-relevant documentation within tight timelines (generally no later than 15 days under Article 87(3), with shorter 2- and 10-day limits under Article 87(4)–(5); COM(2025) 1023 proposes extending the general limit to 30 days, without displacing the obligation to report immediately once a causal relationship is established or considered reasonably possible). Fragmented evidence ownership makes this operationally difficult and, in some configurations, practically impossible without operational arrangements implementing the required QMS and supplier controls across the evidence chain.
Update-obligation diffusion : Post-market surveillance under Article 83 MDR and vigilance under Article 87 MDR require timely updates to documentation when field-safety signals arise. Where evidence modules are distributed, the obligation to update diffuses: each party may assume that another is responsible. The coordination failure is particularly dangerous because it affects the ex post arm of the regulatory system: the mechanism through which risks that materialise after market placement are detected and managed. Suppose a field safety corrective action under Articles 87 and 89 MDR requires simultaneous updates to the risk-management file, the clinical evaluation report and the post-market surveillance plan, and the three artefacts sit with three different organisations. Speed and coherence of the response then depend on contractual interfaces. Article 10(9)(d) and Annex IX require supplier controls and permit appropriate audits, but do not prescribe the complete module-by-module reconciliation and update schedule proposed here. From a patient-safety perspective, the governance failure is downstream of the certification event. Devices safely assessed at certification may become inadequately governed if the post-market evidence architecture fragments over the product lifecycle.
Data-protection-law compounding : A fifth channel cuts across the previous four and intensifies each of them. Clinical and post-market evidence modules may contain personal data concerning health within the meaning of Article 4(15) of Regulation (EU) 2016/679 (GDPR). Those personal health data fall within Article 9(1); anonymous information and modules containing no personal data fall outside the GDPR.Footnote 39 The data-governance dimension (the question who, in the GDPR sense, is the relevant data-controller for any given evidence module) therefore overlays the MDR’s evidence-governance dimension where personal data are processed. Pre-market clinical investigations and Post-Market Clinical Follow-up (PMCF) studies under Annex XIV Part B MDR are governed jointly by the MDR’s scientific-evidence rules and the GDPR’s protection regime. Operational decisions involving personal data (who hosts the database, who applies pseudonymisation, who responds to a data-subject request, who triggers an update after a vigilance signal) are therefore also data-protection decisions. The same applies to real-world evidence collected from clinical practice through registries, hospital information systems and post-market data flows, to the extent that reuse falls within the EHDS Regulation’s phased secondary-use regime.
The dogmatic difficulty is that the relationship between manufacturer, notified body, CRO, hospital site and commercial affiliate does not map cleanly onto either of the two controller configurations the GDPR provides. Two readings are available; both, as will be seen, end at the same governance problem. Under one reading, these actors are joint controllers within Article 26 GDPR: they jointly determine the purposes of the processing (regulatory evidence) and its essential means (which modules, which population, which retention rules). The Court of Justice read joint controllership broadly under the predecessor Directive 95/46/EC. Case C-25/17 Jehovan todistajat Footnote 40 accepted it without a written arrangement and without each controller having access to the data; Case C-40/17 Fashion ID Footnote 41 confined it to the processing stages an actor actually co-determines, without making it a controller for preceding or subsequent operations it does not determine. Under that reading, Article 26(1) GDPR requires the actors to determine “in a transparent manner their respective responsibilities for compliance with the obligations” through “an arrangement.” The GDPR thus requires responsibilities to be determined transparently, while the MDR requires QMS responsibilities and supplier controls; neither prescribes the complete cross-regime, module-by-module schedule proposed here.
Under a second reading, the same actors are separate controllers who process the same data set sequentially for distinct purposes. A CRO may be an independent controller for research where it determines the purposes and means, while the manufacturer, notified body and competent authority may act as controllers for their respective regulatory purposes. Each processing operation requires an applicable Article 6 basis and, for health data, an Article 9(2) condition; Article 89 provides safeguards for research, not an independent legal basis. The EDPB’s Guidelines 07/2020 explicitly recognise that the same dataset may pass through chains of separate controllers, and that the qualification turns on facts rather than on contractual labels.Footnote 42 On this reading, Article 26 GDPR does not bite. Articles 13–14 impose transparency duties subject to their exceptions; Article 28 applies where processors are engaged; and Article 33 allocates notification duties to controllers towards supervisory authorities and to processors towards controllers. These obligations may require coordination across an evidence chain, without imposing an automatic notification cascade between separate controllers.
Which reading applies is fact-sensitive and will often be unstable across the lifecycle of a single device. A CRO that begins as a processor under a clinical-investigation contract may become a joint controller when the same dataset is reused for PMCF, and a separate controller when it later determines independent research purposes and means, subject to the safeguards in Article 89 GDPR. For the present analysis, the choice is doctrinally significant but governance-equivalent. Either reading exposes an interface where the MDR’s QMS and supplier controls must be coordinated with the applicable GDPR roles. The two regimes do not prescribe the complete sequence of module-level custody, reconciliation and update arrangements proposed here. In each of the GDPR roles (joint controller, separate controller, processor), the same three operational questions arise that the MDR also leaves unstandardised: who controls, who accesses and who updates the evidence module. The two regimes assign duties through different legal criteria that must be coordinated in practice.
For readers who do not live in data-protection law, the upshot can be stated without the doctrine. Where an evidence-module hand-over involves personal data, it is two events at once: a documentation event under the MDR and a processing event under the GDPR. Two regimes, two supervisory apparatuses and two clocks must be coordinated without a complete module-level timetable supplied by either regime. Through all four coordination channels the consequences run. Each of the four coordination channels described above becomes harder to operate when the same documentation also constitutes a special-category processing operation under separate enforcement authorities. A sign-off cycle that requires inter-organisational approval may also require coordination of any data-protection impact assessments required under Article 35 GDPR. Documentation inconsistency may be aggravated by jurisdictional variation in pseudonymisation practice. Audit-trail fragmentation now compromises regulatory traceability and data-subject rights alike. And update-obligation diffusion spreads across two regulatory regimes whose enforcement timelines and competent authorities differ.
Rather than resolving this interface, the Regulation on the European Health Data Space (EHDS) reorganises it.Footnote 43 The Regulation, which sets up a general data-governance regime for electronic health data, entered into force on 26 March 2025. It applies in phased fashion from 26 March 2027 onward; the central secondary-use provisions of Chapter IV become operational from 26 March 2029. For secondary use of electronic health data, the EHDS introduces Health Data Access Bodies designated by Member States, controlled access through data permits, approved data requests and the specific route in Article 67(3), together with standardised dataset descriptions.Footnote 44 Secondary use is an explicit purpose category: under Article 53(1) it covers scientific research, development and innovation activities for products and services, and the training, testing and evaluation of algorithms in medical devices and in vitro diagnostic medical devices. Article 74 already assigns controller and processor roles for the EHDS access route and permits implementing templates for those relationships. The remaining question is how those allocations connect to the wider MDR evidence chain. Two consequences follow for evidence governance under the MDR. An authoritative coordination layer is added for some kinds of evidence reuse: registry-based PMCF, real-world-evidence studies for software-as-medical-device updates, and real-world evidence collected from clinical practice. To that extent, the fragmentation costs identified above are reduced where the secondary-use route is taken. Yet a third regulatory authority (the Health Data Access Body) is also introduced into a relationship that already contained two, and a third procedural timeline (data-permit issuance) into a sequence that already contained two. Whether the EHDS will operate as a net reduction or a net increase of the evidence-governance deficit depends on operational choices not yet made. Three matter most: alignment between data-permit and conformity-assessment timelines; the equipment of Health Data Access Bodies for notified-body interfacing; and whether the implementing acts foreseen for adoption by March 2027 deliver harmonised dataset descriptions that match the MDR’s Annex II content categories. This article supplies the vocabulary in which those choices can be assessed once they become observable.
Under a heuristic throughput relationship (developed in the Online Supplement), the illustrative through-put ratio declines with both ownership entropy and the aggregate notified-body incompleteness proxy. The ordinal result is stable across the admissible parameter range: low-fragmentation configurations dominate medium, which in turn dominate high. In other words, the argument rests on the ranking of configurations, not on the exact percentages any particular calibration produces. The arithmetic it-self is short. Take the low-fragmentation column: every module is held 6/7−1/7, so each contributes
 $\, - \,\left( {{6 \over 7}{\mkern 1mu} \ln {\mkern 1mu} {6 \over 7}{\mkern 1mu} + {\mkern 1mu} {1 \over 7}\ln {\mkern 1mu} {1 \over 7}} \right) \approx 0.41$
, and with equal weights the aggregate is the same 0.41; inserting that value into returns the first row of Table 3. Nothing beyond a pocket calculator is required to reproduce the column. Under illustrative high-fragmentation conditions (more hand-off points, more places to stall) the model suggests throughput could fall by roughly 80% or more below a low-fragmentation benchmark. That figure’s cardinal precision should not be over-read. Its directional implication holds across the parameter space. Modest is the heuristic proposition: coordination burdens increase when multiple actors must approve changes to the same evidentiary module and when update authority is dispersed across adjacent modules. Analytical structure comes from the formal apparatus in the Online Supplement; causal identification is not claimed.
Ownership configurations and illustrative certification throughput. Entropy scores:
 ${H_{total}}\left( A \right)$
with equal module weights
 ${\omega _m} = {\rm{ }}1{\rm{/}}15$
. Throughput ratio
 $\Theta \left( {A;\,\eta, \,\kappa, \,L} \right) = \exp \left[ { - \eta {H_{total}}\left( A \right) - \kappa L} \right]$
, factorisable as
 ${c_T} \cdot F\left( A \right)$
with
 $F\left( A \right) = \exp \left[ { - \eta {H_{total}}\left( A \right)} \right]$
and
 ${c_T} = \exp \left[ { - \kappa L} \right]$
. Benchmark parameters
 $\eta = 1.5$
,
 $\kappa = 2.0$
,
 ${L_{obs}} = 0.70$
(the share of notified bodies in the two lower completeness bands, used as an illustrative incompleteness proxy), giving
 ${c_T} = \exp \left( { - 1.4} \right) \approx 0.247$
. Ordinal ranking invariant across
 $\eta \in \left[ {0.5,\,3.0} \right]$
(entropy elasticity) and across
 $\kappa \in \left[ {1.0,\,4.0} \right]$
at fixed
 ${L_{obs}}$
(uniform scaling). Full control matrices and both sensitivity tables in the Online Supplement.

Table 3. Long description
A table with three rows and three columns comparing different ownership configurations based on entropy scores, fragmentation factors, and throughput ratios. The columns are labeled Entropy score, Fragmentation factor, and Throughput ratio. The rows are labeled Low fragmentation (lead-firm dominant), Medium fragmentation (jurisdiction-split), and High fragmentation (uniform dispersion). Row 1: Entropy score 0.41, Fragmentation factor 0.541, Throughput ratio 0.133. Row 2: Entropy score 0.76, Fragmentation factor 0.319, Throughput ratio 0.079. Row 3: Entropy score 1.61, Fragmentation factor 0.089, Throughput ratio 0.022.
Seen together, the five channels are one institutional fact viewed from five angles: no actor owns the whole file. Each channel turns that fact into a distinct operational cost, and the aggregate numbers of Section III (the completeness distribution, the 42/58 time split) are what those costs look like from the outside. Figure 7 renders the arithmetic visible: the same five modules, held by two, four or five parties, with entropy and illustrative throughput as reported in Table 3.
Ownership configurations behind Table 3. Rows: the five evidence modules of Section II; columns: the parties holding control; cell shading proportional to the control share
 ${a_{pm}}$
. Exact allocations as specified in the Online Supplement: Low, 6/7–1/7 in every module between a lead firm and a minority partner; Medium, modules 1–4 split equally between the EU and the US principal, module 5 held 1/2–1/4–1/4 by the EU principal and two regional affiliates; High, uniform 1/5 across five parties. Entropy
 ${H_{total}}$
and throughput ratio
 $\Theta$
as reported in Table 3.

Figure 7. Long description
The table compares ownership configurations and their impact on certification throughput. It has three main sections: Low, Medium, and High fragmentation. Each section lists five evidence modules: patent core, EU clinical, US clinical, QMS artefacts, and post-market. The columns indicate the parties holding control, with cell shading proportional to the control share. The table shows the entropy score and throughput ratio for each configuration. In the Low fragmentation section, the lead firm holds 6/7 control and the partner holds 1/7 control across all modules. In the Medium fragmentation section, modules 1-4 are split equally between the EU and the US principal, and module 5 is held 1/2-1/4-1/4 by the EU principal and two regional affiliates. In the High fragmentation section, control is uniformly dispersed 1/5 across five parties. The entropy score and throughput ratio are reported for each configuration.
Three boundary conditions qualify the finding. One multinational had implemented a centralised document-governance platform that neutralised fragmentation costs, suggesting that coordination infrastructure can substitute for formal ownership centralisation. Two startups with fully centralised ownership produced poor documentation because the binding constraint was competence, not coordination. And two manufacturers reported that the same technical file received opposite completeness assessments from different notified bodies, indicating that the EU’s completeness statistics partly reflect NB-stringency heterogeneity rather than documentation quality alone. These moderators specify the domain within which the ownership-fragmentation channel operates. They do not eliminate it.
Figure 8 displays the governance architecture that integrates the five ownership-right classes, the two regulatory fields and the patent-enforcement infrastructure.
Governance architecture for a transatlantic MedTech product family. Top tier: five ownership-right classes with coordination-cost measure. Middle tier: EU and US regulatory fields with certification and post-market stages. Bottom tier: patent enforcement infrastructure. Dashed arcs: evidence-portability cost between the two architectures. Dotted boundary: a schematic feasibility region under the five constraints and assumptions specified in the Online Supplement.

What the channels mean for a concrete programme is easiest to see in a worked case.
1. An applied scenario: the cardiac-monitoring product family
Take the example of a stylised cardiovascular product family: a non-invasive monitoring branch (510(k)-eligible in the US), a software-enabled dashboard and a higher-evidence branch that could move toward PMA. In Europe, the completeness data constrain the design space: adding parties to EU evidence and QMS modules raises coordination cost precisely where the regime is weakest. The configuration this points toward is selective modularity: the patent core centralised, post-market modules narrowly and auditably decentralised. On the US side, cardiovascular Special and Traditional 510(k) records have median review durations of 30 and 136 days, respectively. The different submission routes provide institutional context, but these descriptive differences do not identify whether evidence quality, capacity or other factors account for the gap. Where a PMA branch is realistic and the statutory conditions are met, 35 USC § 156(c)(4) permits extension of no more than one patent for the same regulatory review period for a product. This creates a patent-selection constraint for extension; it does not prohibit dividing a patent portfolio or its ownership between branches. Under high-fragmentation conditions, the viability question (developed in the Online Supplement) becomes whether the project can remain inside five constraints simultaneously (liquidity, evidence completeness, patent force, audit compliance and post-market governance) before patent time and financial runway are consumed. Stated without the formalism, the kernel comprises the program states feasible on all five counts under specified governance conditions. Any contraction as entropy increases is conditional on the monotonicity assumption stated in the Online Supplement. A scenario, however carefully built, remains a scenario. What the analysis can and cannot claim deserves equally careful statement.
2. Limitations and competing explanations
Five limitations bound the claims: the analysis derives conditional prescriptions rather than unconditional recommendations; no causal effects are estimated; generalisability beyond MedTech is a conjecture; the article does not address implementation pathways for modular governance; and the twenty-four interviews support channel-level saturation but not saturation across all firm sizes, device classes and jurisdictions. A structural difference with pharmaceuticals is worth flagging. In that sector the clinical-trial sponsor typically controls the full evidence package, so the regulatory interface is relatively centralised. In MedTech it is not: post-market data are co-produced by hospitals, registries and affiliates outside the manufacturer’s control.
A competing account would attribute the completeness deficit to NB capacity shortages, MDR novelty effects or NB-stringency heterogeneity. These factors are real and not mutually exclusive with ownership fragmentation. The forty-two/fifty-eight time split locates substantial time on the manufacturer side, but does not identify the causes of that time or exclude NB capacity as a binding constraint. The twenty-two-month fieldwork window provides one further check: as reported at the opening of Section IV, the attribution of documentation problems shifted across interview cohorts from MDR novelty to structural persistence. My reading of that cross-cohort shift is that it is compatible with the ownership-fragmentation channel, though it cannot substitute for a panel design with repeated interviews of the same individuals.
V. The December 2025 reform proposal and the evidence-governance gap
If Sections III and IV supply the diagnosis, the December 2025 reform is the natural place to ask whether the legislator has recognised the same deficit. In part, it has. The Commission’s proposal COM(2025) 1023 finalFootnote 45 is more serious than some early sectoral reactions suggested. Its content-dimension reforms respond to the sector’s longstanding complaint that the MDR imposes disproportionate documentation burdens: removal of the five-year certificate expiry, reclassification of decision-support software under Rule 11, “well-established technology device” pathways, relaxed equivalence referencing under a revised Article 61(5), regulatory sandboxes under new Articles 59b–c, and reduced surveillance-audit frequency.Footnote 46 Its organisational-dimension reforms address real friction points in the institutional archi-tecture: an ombudsperson for manufacturer–NB disputes, an expanded EMA role for expert panels, and a legal basis for structured dialogue between manufacturers and notified bodies before and during conformity assessment. Accompanying evaluation materials are candid about uneven oversight, unpredictable conformity assessment and governance complexity. The proposal responds to those weaknesses; it is no sign of indifference on the Commission’s part.
The proposed amendment to Article 10(15) clarifies who must draw up, update and make available relevant technical documentation where design and manufacture are outsourced, while leaving responsibility for the remaining documentation with the manufacturer. What remains less fully specified is coordination across the wider evidence chain. Structured dialogue may improve application quality and reduce some avoidable remediation cycles. Dialogue alone does not prescribe a complete schedule for working-file custody, reconciliation of adjacent documents and updates across that wider chain when the device changes or a post-market signal arises. Figure 9 draws that boundary. The proposed revision of Article 61(5) illustrates the gap. It removes the explicit contractual full-access condition for relying on another manufacturer’s equivalent device to avoid a clinical investigation under Article 61(4). The applicable equivalence and clinical-evidence requirements, and the manufacturer’s lifecycle updating duties under Article 61(11), remain. The revision does not itself allocate cross-firm governance rights over the referenced documentation. Reliance without separate governance arrangements may therefore preserve an evidence dependency and coordination costs.
Coverage map of the December 2025 simplification proposal. Solid fields: documentation content, procedure and the proposed Article 10(15) allocation of documentation responsibilities for out-sourced design and manufacture. Dashed fields: questions not fully standardised across the wider evidence chain: working-file custody, reconciliation, update authority and constraints on module delegation. Existing QMS and supplier controls remain applicable; the remaining gap concerns a complete module-by-module schedule.

A correct criticism is therefore one of incompleteness, not indifference.
Why does the distinction matter? The remaining problem concerns a complete operational schedule alongside existing duties, QMS controls and the proposed Article 10(15) allocation. Section VI therefore distinguishes technical requirements that can be specified within the Regulation’s existing powers from any new autonomous duty requiring legislative amendment. Specifying the remaining schedule elements through the legally appropriate combination of MDCG guidance, common specifications, harmonised standards and legislative amendment would make that operational coordination more explicit.Footnote 47 Which instrument should carry that conversion is discussed in Section VI below.
MedTech Europe welcomed the proposal but noted the absence of a “single governance structure.”Footnote 48 Neither MedTech Europe nor Team NB, in their initial reactions, identified evidence governance as a distinct institutional dimension: the gap this article seeks to name.
What kind of regulatory object is a distributed evidence file? Hancher and Moran’s “regulatory space” conceptFootnote 49 receives a distributional extension here: once the regulated object is a knowledge architecture, the governance question becomes how the distribution over documentation quality evolves under institutional rules. And no rule, however well drafted, enables a notified body to produce a high-quality assessment from low-quality inputs. Designation growth is consistent with that reading but cannot prove it by itself. A larger notified-body population would not, without manufacturer-side file governance, repair the completeness distribution reported above. Safer, therefore, is the narrower inference: capacity growth alone does not answer the evidence-governance question. Whether EUDAMED changes this is open to debate. Its first four modules became mandatory on 28 May 2026,Footnote 50 and the platform may serve as coordination infrastructure or merely as a reporting layer that leaves underlying fragmentation untouched. Which of the two it becomes is, in the end, a design choice, and design choices need instruments.
VII. Implications for risk governance and regulatory design
A diagnosis is of limited use unless something can follow from it. What follows here distributes across a three-level institutional system (legislative, agency and firm-level) each constrained by the EU’s constitutional architecture. The three levels are taken in sequence; the choice among the four legal instruments through which the legislative-level intervention might be carried is then examined against five evaluative dimensions.
At the legislative level, a targeted amendment to the MDR’s conformity-assessment annexes could require, as a condition of application acceptance, an evidence-governance plan. It would identify the owner of each documentation module, the contractual framework for inter-party coordination and the update-trigger obligations that arise when field-safety events occur. Such a requirement would sit naturally within Annex IX (which governs conformity assessment based on the quality management system and assessment of technical documentation) or within a revised Article 10 (manufacturer obligations). The appropriate Treaty basis would need to be assessed against Articles 114 and 168(4)(c) TFEU, on which the MDR rests. An evidence-governance requirement addresses a documented source of regulatory friction, visible in the Commission’s own data.
The question of which legal instrument should carry the evidence-governance reform is not merely procedural. Four vehicles are available: legislative amendment, common specifications under Article 9(1) MDR, harmonised standards under Regulation (EU) 1025/2012,Footnote 51 and MDCG guidance under Articles 103 and 105(c) MDR. Each rests on a different legal basis, generates a different intensity of legal obligation, follows a different adoption timeline and engages the EU’s institutional balance differently. An undifferentiated reference to “regulatory action” obscures these distinctions; a structured comparison makes them tractable, but the adoption-time assumptions used here have not been empirically validated.
Table 4 sets out the four options against five evaluative dimensions. Figure 10 plots the same choice along its two decisive axes, adoption time against binding force, and adds the risk-class tiering of the proposed schedules.
Regulatory instruments considered for an evidence-governance reform under the MDR. Adoption-time ranges are illustrative planning assumptions, not statutory time limits or empirical estimates; they do not establish the relative speed or practical feasibility of the instruments. Common specifications remain subject to Arts. 9(1)–(3), including the possibility of duly justified at-least-equivalent solutions; Art. 9(4) requires Annex XVI products to comply with the relevant common specifications.

Table 4. Long description
A table comparing regulatory instruments for evidence-governance reform under the MDR. The table has six rows and five columns. Column headers are Instrument, Legal basis, Binding force, Adoption time, Democratic legitimation, and Operational suitability for evidence governance. Row 1: Legislative amendment (Annex IX or Art 10 MDR), Arts. 114 and 168(4)(c) TFEU, ordinary legislative procedure, Fully binding, 36–60 months, (illustrative), Highest (Parliament + Council co-decision). Row 2: Required for a new autonomous manufacturer duty,, , , , . Row 3: Common specifications (CS), Art. 9(1) MDR, implementing act under Art. 291 TFEU, Compliance or duly justified equivalent solution; presumption of conformity, 18–30 months, Member-State control via comitology (Reg 182/2011), Candidate for technical schedule, traceability and update requirements within the subjects listed in Art. 9(1). Row 4: Harmonised standard, Art. 8 MDR; Reg (EU) 1025/2012, Commission Standardisation request, Presumption of conformity if cited in OJEU, 24–48 months, (illustrative), Indirect (private standardisation, Member-State scrutiny under Art. 11 Reg 1025/2012). Row 5: Technical layer for data formats, interface specifications and audit-trail integrity tests once the legal architecture is fixed,, , , , . Row 6: MDCG guidance, Arts. 103, 105(c) MDR, Soft law; persuasive in conformity assessment but not binding, 6–12 months, Low (Member-State experts, no formal scrutiny), Implementation support; insufficient as the final source of uniform obligation.
Instrument choice and proposed schedule tiering. Left: the four instruments of Table 4, with illustrative author estimates of adoption time: legislative amendment 36–60 months, common specifications 18–30, harmonised standards 24–48 and MDCG guidance 6–12. The ranges are illustrative planning assumptions and do not establish relative adoption speed. Common specifications, shown in bold, are a candidate only within Article 9(1), with equivalent solutions permitted under Article 9(3). Right: pro-posed full schedules for Class III and Class IIb implantable devices, lighter schedules for Class IIa and non-implantable Class IIb, and minimal schedules for Class I.

The legal differences in Table 4 support consideration of a layered approach; its illustrative timing assumptions do not establish which instrument would be fastest. A legislative amendment can create a new autonomous duty but requires the ordinary legislative procedure. A new autonomous duty under Article 10 MDR to maintain an evidence-governance plan would require legislative amendment, with the appropriate Treaty basis assessed in light of Articles 114 and 168(4)(c) TFEU. Common specifications under Article 9(1) MDR are a candidate for technical requirements concerning the subjects it lists: general safety and performance requirements, technical documentation, clinical evaluation and PMCF, and clinical investigations. Each proposed schedule element must remain within those subjects and the existing legislative requirements. Their adoption follows the examination procedure under Regulation 182/2011, which secures Member-State control without the lengthy co-decision cycle. The presumption-of-conformity mechanism gives them operational effect, while Article 9(3) permits duly justified solutions providing at least equivalent safety and performance, subject to the Annex XVI rule in Article 9(4).Footnote 52 Article 9(1) requires absent or insufficient harmonised standards, or a need to address public-health concerns. Existing harmonised QMS standards already address parts of supplier and document control. A proposal for common specifications would therefore need to establish precisely which schedule elements remain uncovered or insufficiently addressed, unless public-health concerns independently justify action.
Harmonised standards developed by CEN/CENELEC at the Commission’s request occupy a complementary rather than substitutive role. Where the required operational elements have been established through an appropriate legal instrument, CEN/CENELEC could supply engineering detail: data formats, interface specifications and audit-trail integrity tests. This sequencing is a proposed design choice, not a legal requirement.Footnote 53 MDCG guidance keeps its role as the fast bridge. A Commission-endorsed document on evidence-governance expectations could inform practice while a common-specification process is considered, but its adoption time and practical effect remain uncertain. Its limitation is the inverse of its strength: notified bodies and competent authorities are not legally bound by MDCG documents, and inconsistent application across designating authorities is documented in Team NB’s own annual reporting.
The proposed division of labour is therefore conditional. A legislative amendment would establish any new autonomous duty; common specifications could supply technical schedule requirements within Article 9(1); harmonised standards could develop technical formats; and MDCG guidance could support implementation. The instruments have overlapping technical functions but different powers and legal effects.
The proportionality question deserves explicit treatment.Footnote 54 An evidence-governance requirement is not a structural-ownership mandate. Nothing in it prescribes who may own which evidence module. All it asks is that the assignment be documented, the inter-party interfaces specified and the update authority traceable. Three calibrations would support its proportionality. Risk-class differentiation under MDR Article 52 and Annex VIII would impose full schedules for Class III and Class IIb implantable devices, lighter ones for Class IIa and non-implantable Class IIb and minimal ones for Class I. Scope would be limited to those evidence modules whose post-market update is mandatory under Articles 83 and 87 MDR. And transition design would let existing certificates continue, the requirement attaching only to new applications and substantial change notifications. These calibrations support a proportionate design, subject to assessment of the specific obligations and their practical burden.
At the regulatory-agency level, the requirements for notified bodies under Article 36 and Annex VII MDR, assessed through the Article 39 procedure, could be supplemented by evidence-governance indicators through the appropriate legal instrument. Commission Implementing Regulation (EU) 2026/977, adopted on 4 May 2026, entered into force on 25 May 2026 and will apply from 25 February 2027. It sets out uniform elements of notified-body quality management and conformity-assessment procedure, including cost-transparency and timeline disciplines. Secondary legislation, it confirms, can be used to reduce procedural opacity. It remains, however, an NB-procedure instrument rather than a manufacturer-side evidence-governance instrument.Footnote 55 If that regulatory logic were extended, it could encompass evidence-governance metrics. On the US side, the panel-level heterogeneity in FDA review times suggests that CDRH could develop pathway-specific evidence-architecture guidance; the QMSR’s alignment with ISO 13485 provides a procedural anchor for such guidance.
At the firm and intermediary level, the conditional governance prescription for a dual-jurisdiction product family is: centralise patent-core and quality-system rights from the outset; split evidence rights by jurisdiction; share post-market rights only under auditable constraints. This is not standard outsourcing. What is assigned are governance rights: the right to decide when evidence is updated, the duty to notify downstream parties and the audit right that makes such duties enforceable.Footnote 56
A cross-jurisdictional governance observatory (combining Commission survey moments, FDA releasable extracts and patent-system statistics) would permit the approach developed here to be updated as new data become available.Footnote 57 Whether the political will exists to build such an observatory is a question this article cannot answer; that the data architecture for it is becoming feasible is the limited claim advanced here. With the instruments compared and their limits stated, the balance can be drawn.
VII. Conclusion
The MDR’s conformity-assessment architecture was built for a world in which the manufacturer assembles the technical file and the notified body reads it. What the Commission’s own survey data expose, and what the interview material corroborates across twenty-two months of fieldwork, is that the file is no longer assembled by one actor. Clinical evaluation reports, risk-management files, software validation records, post-market surveillance plans and quality-system artefacts are produced by a network of legally distinct organisations. The Regulation addresses their coordination through Articles 10 and 15, the PRRC and the QMS and supplier controls of Annex IX. The proposed amendment to Article 10(15) further clarifies documentation responsibilities for outsourced design and manufacture, while a complete module-by-module schedule for the wider chain remains unspecified. That gap between assigned responsibility and operational governability is what this article has called the evidence-governance deficit. Visible in the data are the five channels through which it operates: sign-off latency, documentation inconsistency, audit-trail fragmentation, update-obligation diffusion, and the data-protection layer that compounds each of the other four.
What follows for the EU’s institutional system? At the legislative level, evidence-governance schedules would answer, module by module, the four questions of Section II (who makes the file, who holds it, who reconciles it, who revises it) by identifying the responsible entity, the custodian, the update triggers and the audit path. Common specifications are a candidate for technical schedule requirements within the subjects and conditions of Article 9(1) MDR; a new autonomous manufacturer duty would require legislative amendment. MDCG guidance could support implementation during the comitology interval; harmonised standards could supply technical detail where the relevant operational architecture is established. At the agency level, the Article 36 and Annex VII requirements assessed through Article 39 could be supplemented by evidence-governance indicators through the appropriate legal instrument, and the structured dialogue proposed in COM(2025) 1023 could support early examination of these schedules. None of these measures requires a new institutional actor. All work within the hybrid architecture that the MDR has created. One further step is compelled by the data-protection layer. The EHDS implementing acts and Member-State Health Data Access Body procedures should be designed to align data-permit workflows with conformity-assessment timelines; the MDCG guidance should address the remaining controller and processor questions for common evidence-module transfers, taking account of the roles already assigned by Article 74 EHDS.
Limits of the argument should be stated squarely. Analytically, the work is diagnostic rather than causal: the heuristic coordination-cost measure developed in the Online Supplement gives the evidence-governance problem analytical traction but does not identify treatment effects. Empirically, the interview evidence supports saturation at the level of the five theorised channels but does not claim representativeness across all firm sizes, device classes and jurisdictions. Doctrinally, the data-protection analysis identifies the regulatory interface that joint or separate controllership creates. What it does not measure is how Health Data Access Bodies will, in practice, sequence permit issuance against conformity-assessment milestones once the EHDS moves from its 2027 governance-setup phase into its 2029 secondary-use phase. And the proportionality of any evidence-governance requirement will depend on calibration to risk class, something this article can advocate but not design.
For the practitioner, the article compresses into a short audit. Take any technical file and count two things for each evidence module: the organisations whose sign-off a change requires, and the instruments that name a coordinator for that module. Wherever the first number exceeds one while the second is zero, the file sits inside the deficit this article has mapped, and the schedule tier of Section VI provides a starting point for a proportionate remedy.
One observation may serve as the closing thought. The Commission’s December 2025 proposal acknowledges that device availability in Europe has reached a tipping point. It responds by simplifying what manufacturers must document and clarifying responsibilities for outsourced design and manufacture. It does not yet prescribe a complete schedule for keeping the wider evidence chain operationally coherent: who holds the authoritative version of a clinical evaluation report when three organisations have contributed to it, who must update the risk-management file when a vigilance signal arises, who bears the coordination cost when adjacent modules contradict each other. Until the regime addresses those questions, the risk is borne by patients twice over: once through delayed access to devices that cannot clear a weakened conformity-assessment filter, and once through inadequate post-market governance of devices that have cleared it.
Supplementary material
The supplementary material for this article can be found at https://doi.org/10.1017/err.2026.10162
Data availability statement
The archived US descriptive summaries were computed from the official FDA file PMN96CUR.ZIP (down-loadable from https://www.fda.gov/medical-devices/510k-clearances/downloadable-510k-files). EU data derive exclusively from the publicly available 14th Notified Body Survey. Interview data are not publicly available due to confidentiality commitments; anonymised coding sheets are available from the author upon reasonable request. The calculation script, archived descriptive tables and for-mal governance model are provided with the Online Supplement. Reproducing the historical descriptive results requires the March 2026 input file.
Acknowledgments
The author thanks the twenty-four expert interviewees for their time, candour and willingness to discuss day-to-day documentation governance practices. The group included regulatory-affairs directors, notified-body assessors, competent-authority officials, regulatory consultants and contract-research-organisation executives. All remaining errors are the author’s own.
Financial support
This research received no specific grant from any funding agency in the public, commercial or not-for-profit sectors.
Competing interests
The author declares no competing interests.
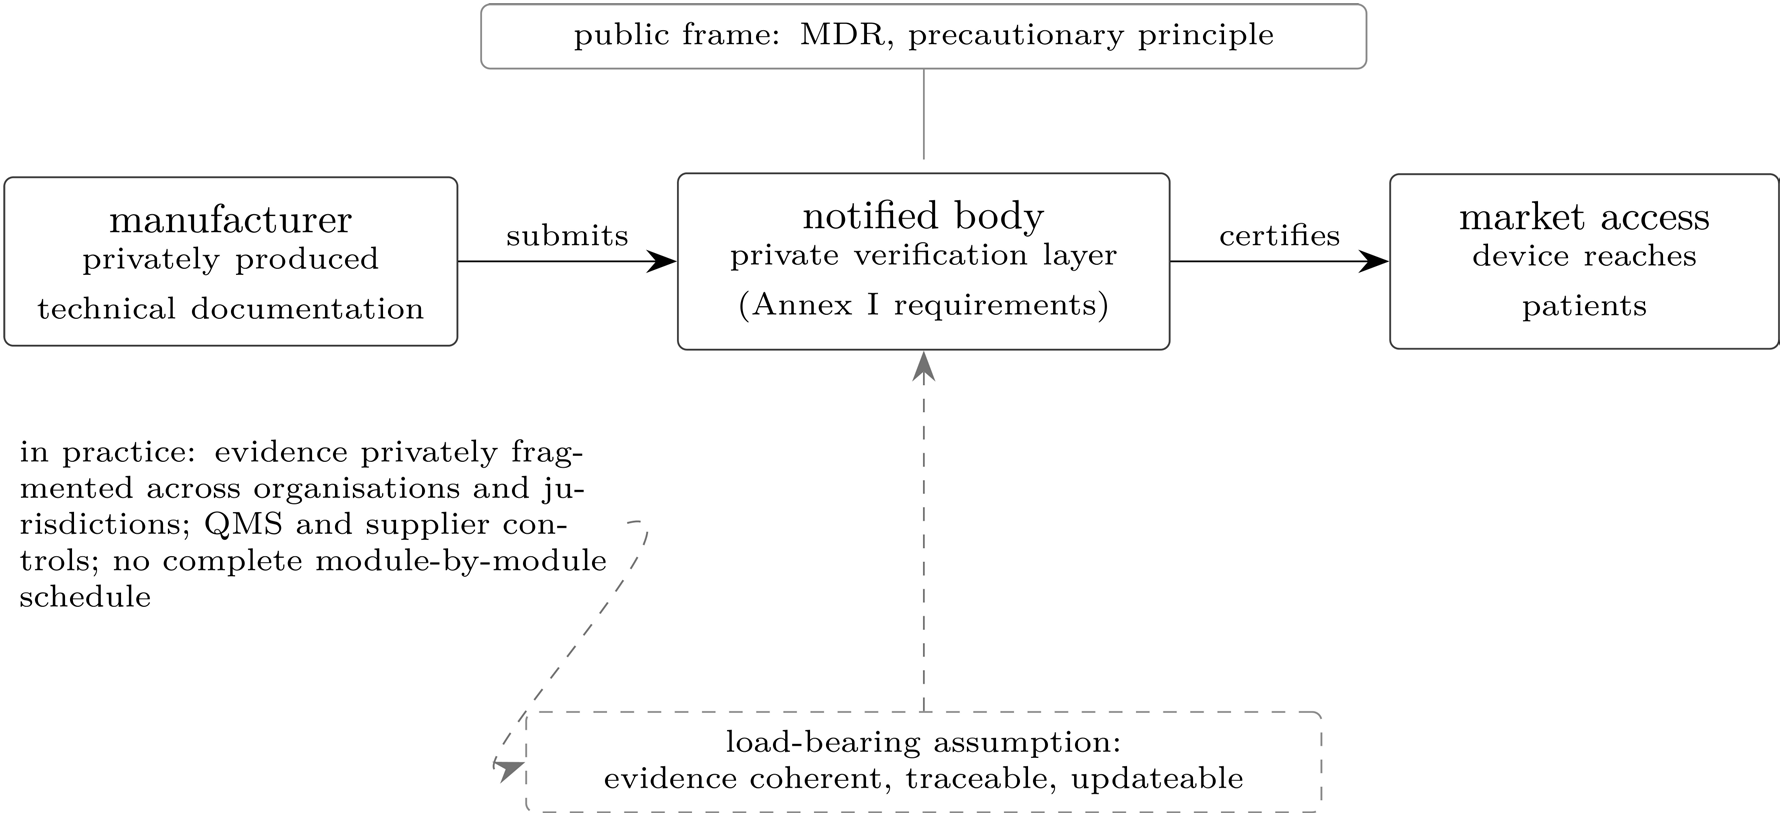
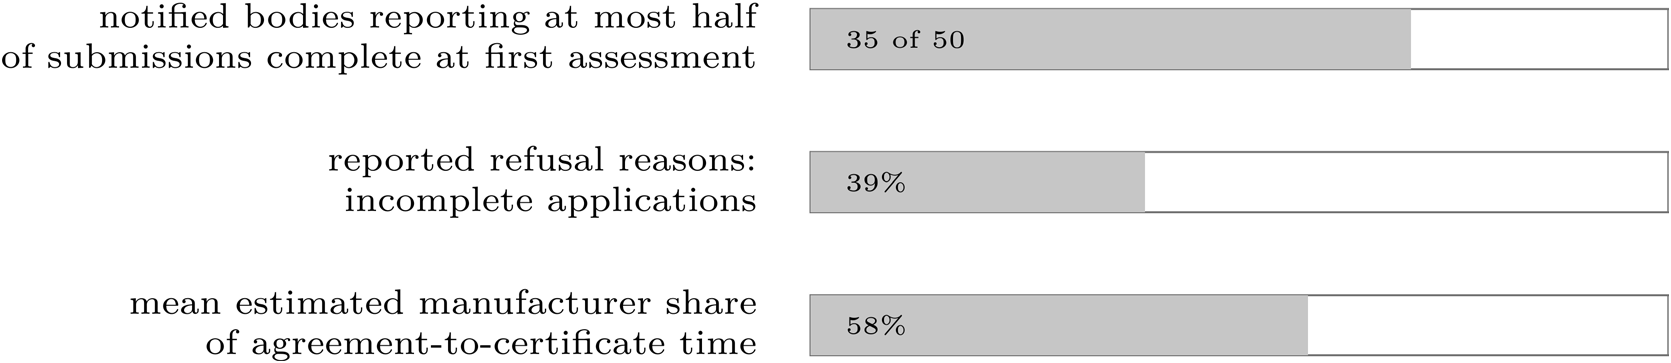
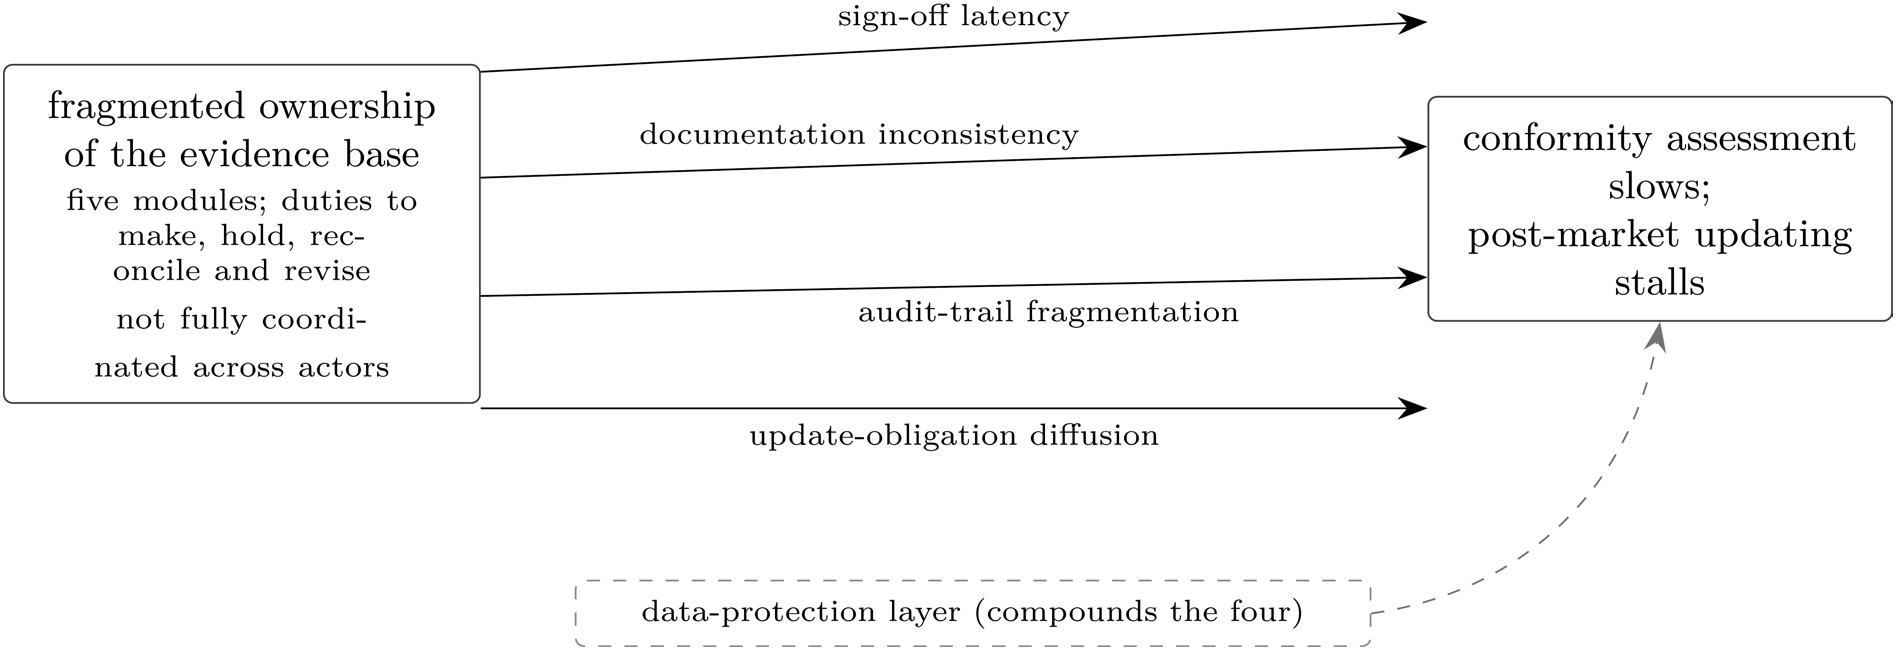
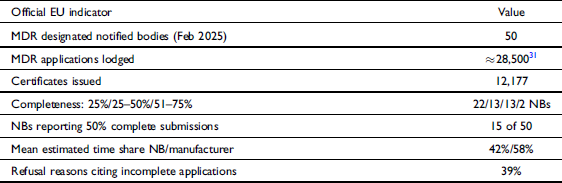
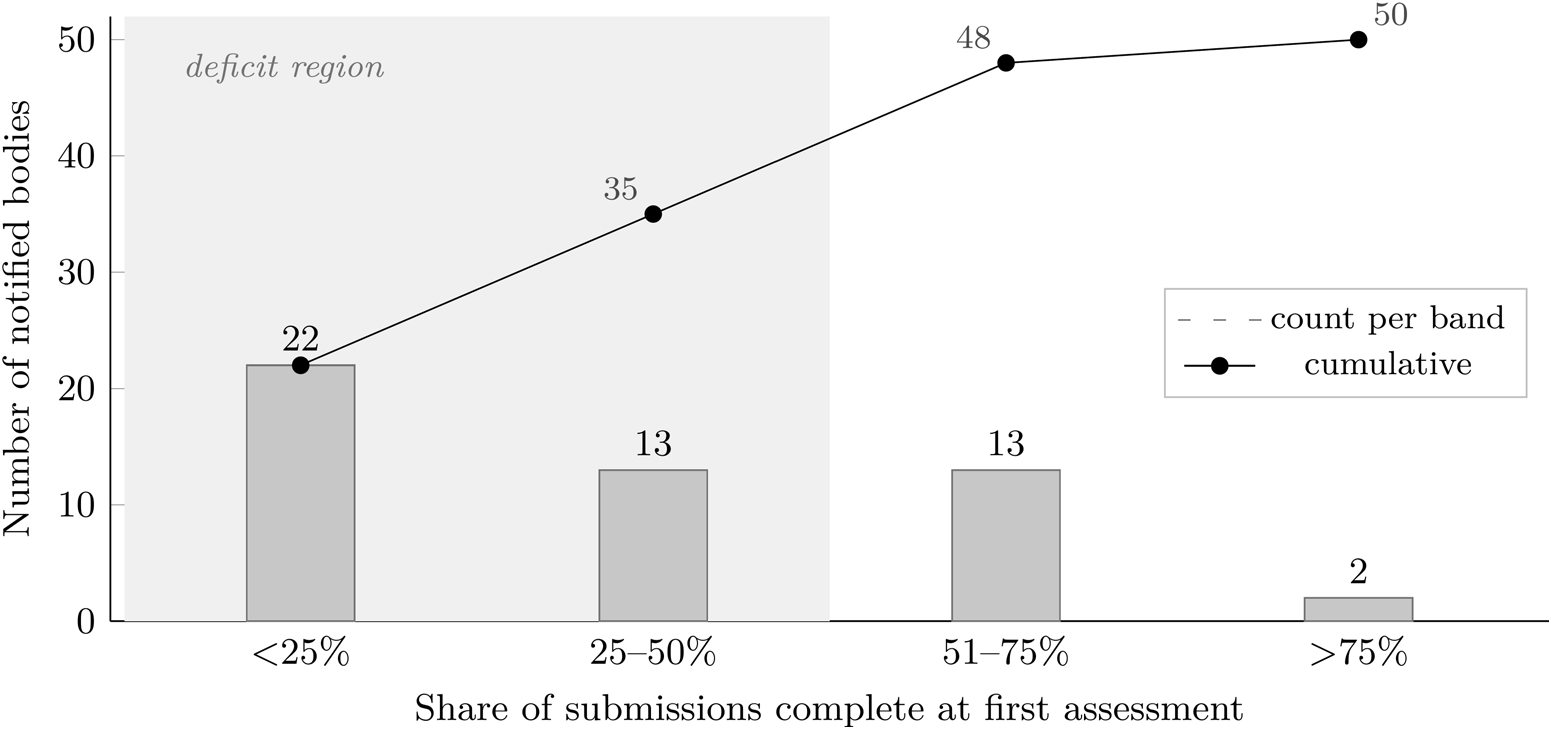
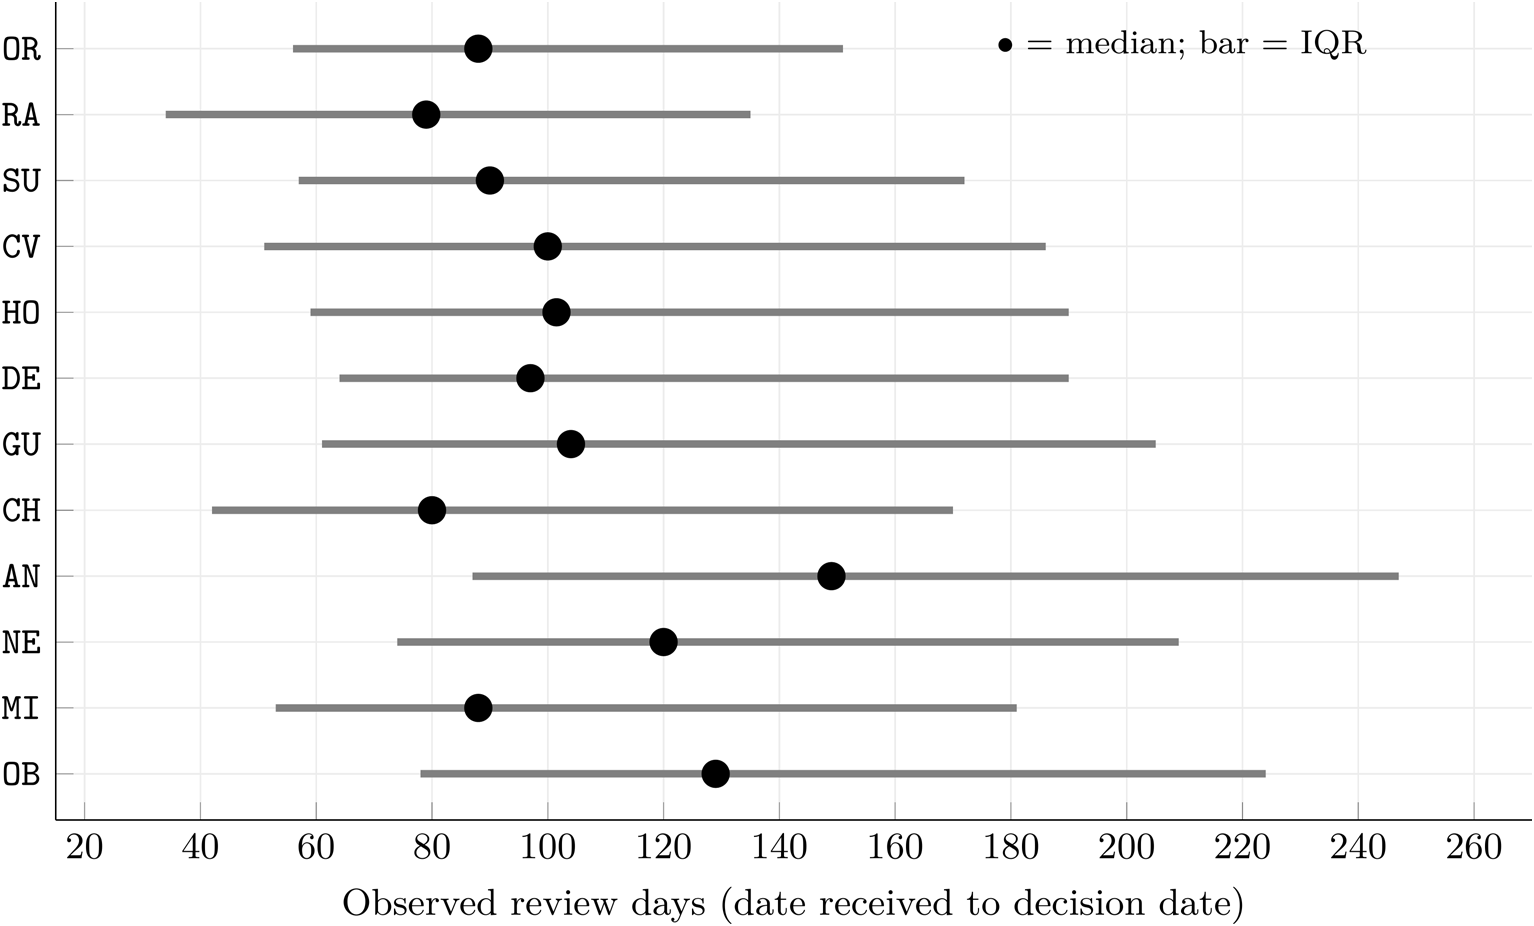
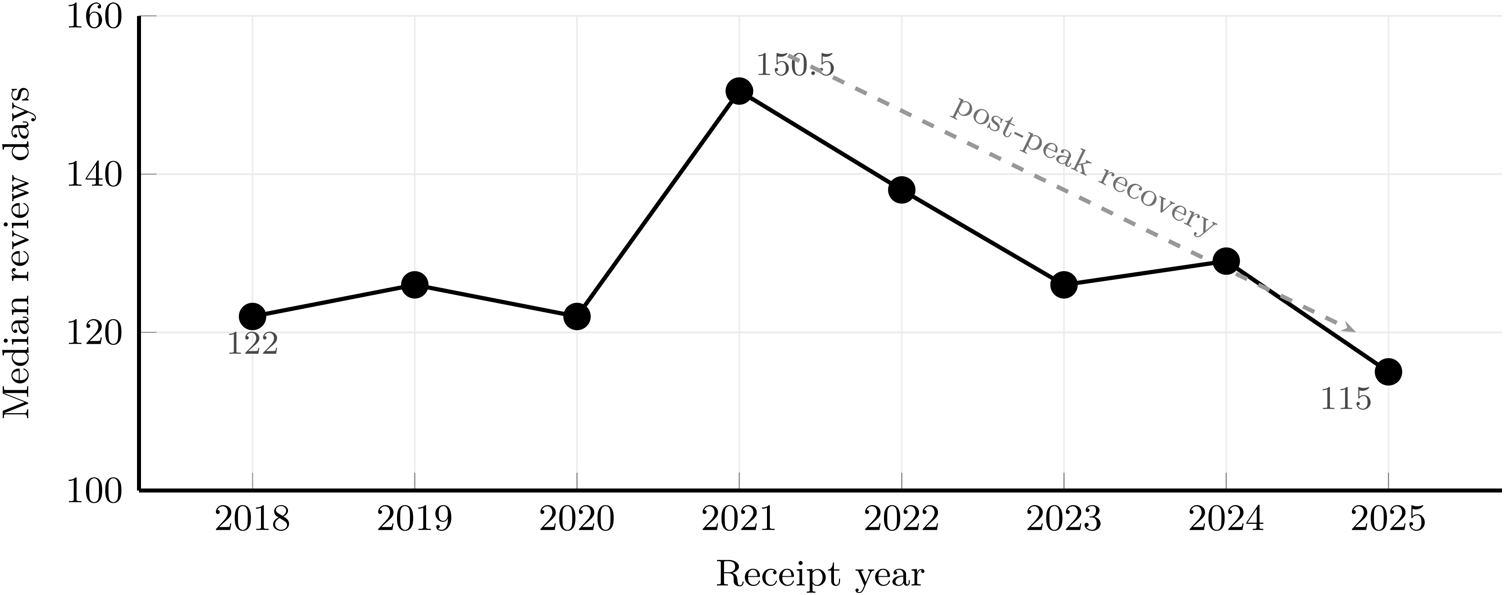
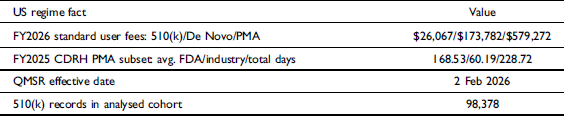

 Htotal(A)
 ωm=1/15
 Θ(A;η,κ,L)=exp[−ηHtotal(A)−κL]
 cT⋅F(A)
 F(A)=exp[−ηHtotal(A)]
 cT=exp[−κL]
 η=1.5
 κ=2.0
 Lobs=0.70
 cT=exp(−1.4)≈0.247
 η∈[0.5,3.0]
 κ∈[1.0,4.0]
 Lobs
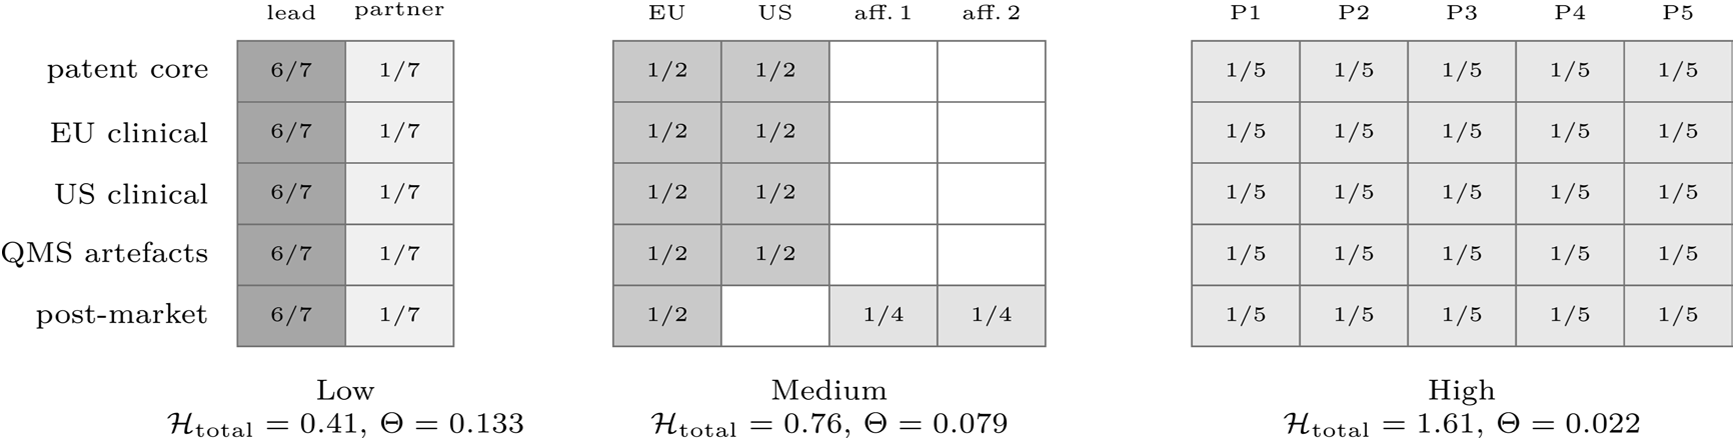
 apm
 Htotal
 Θ
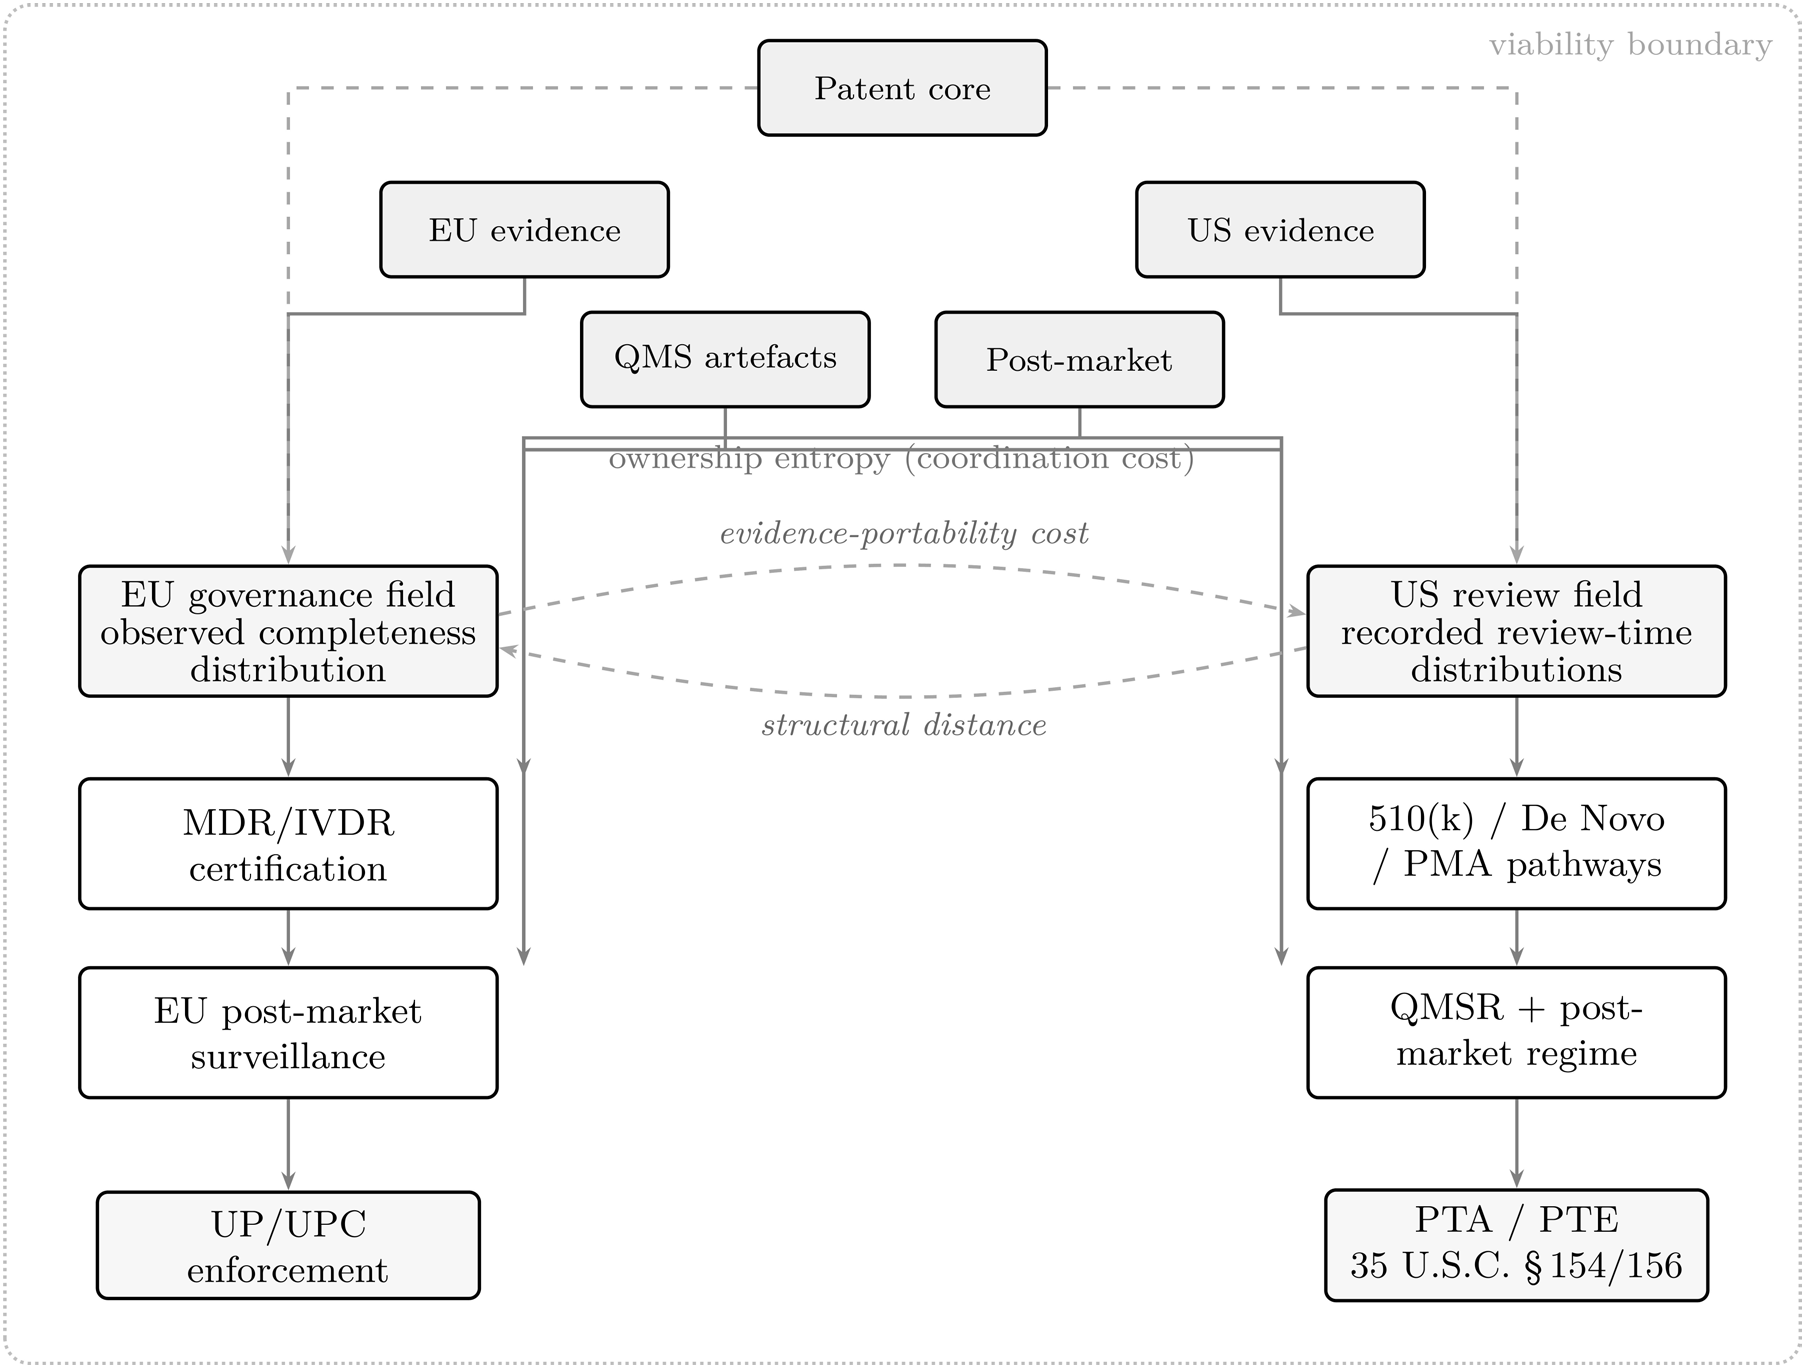
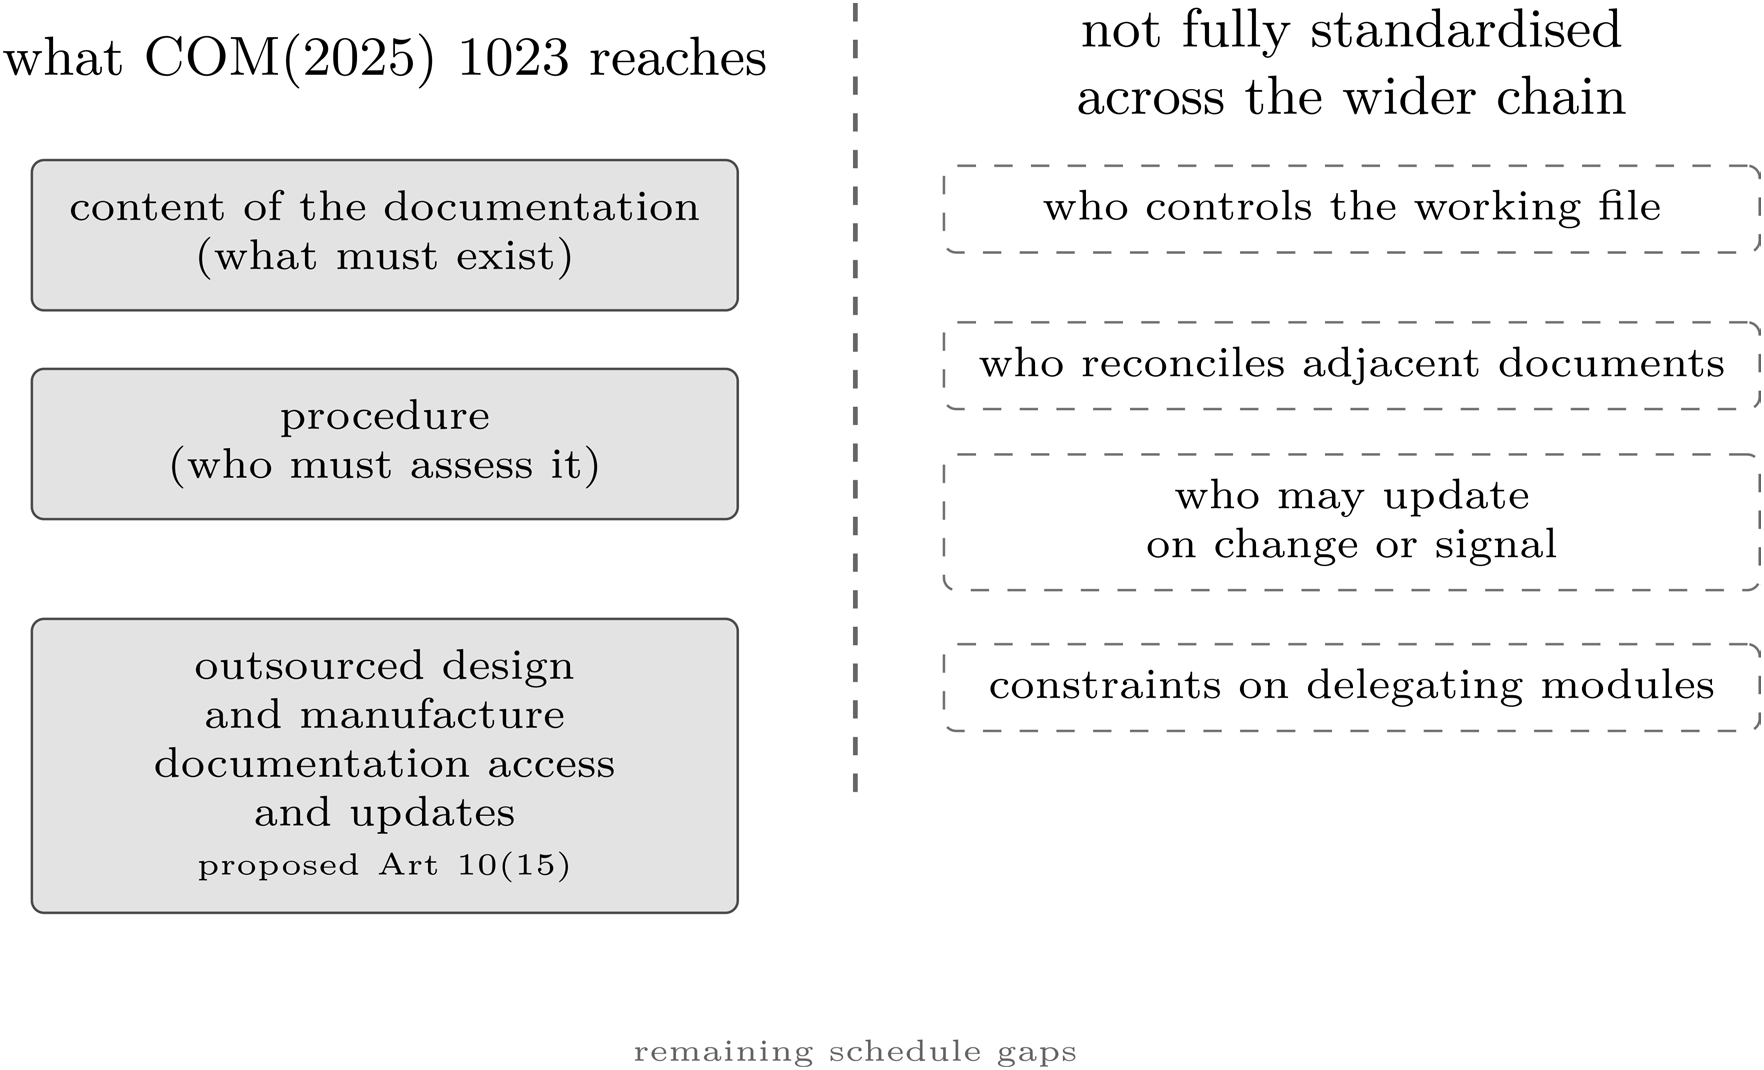
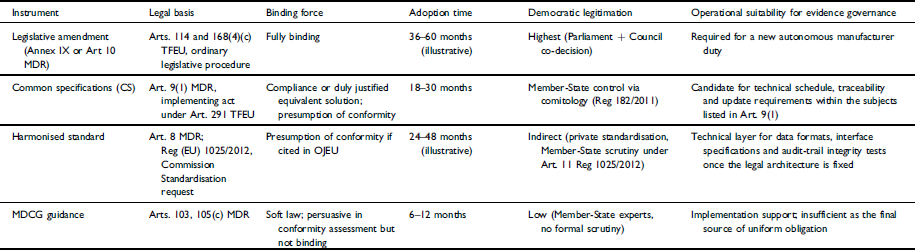
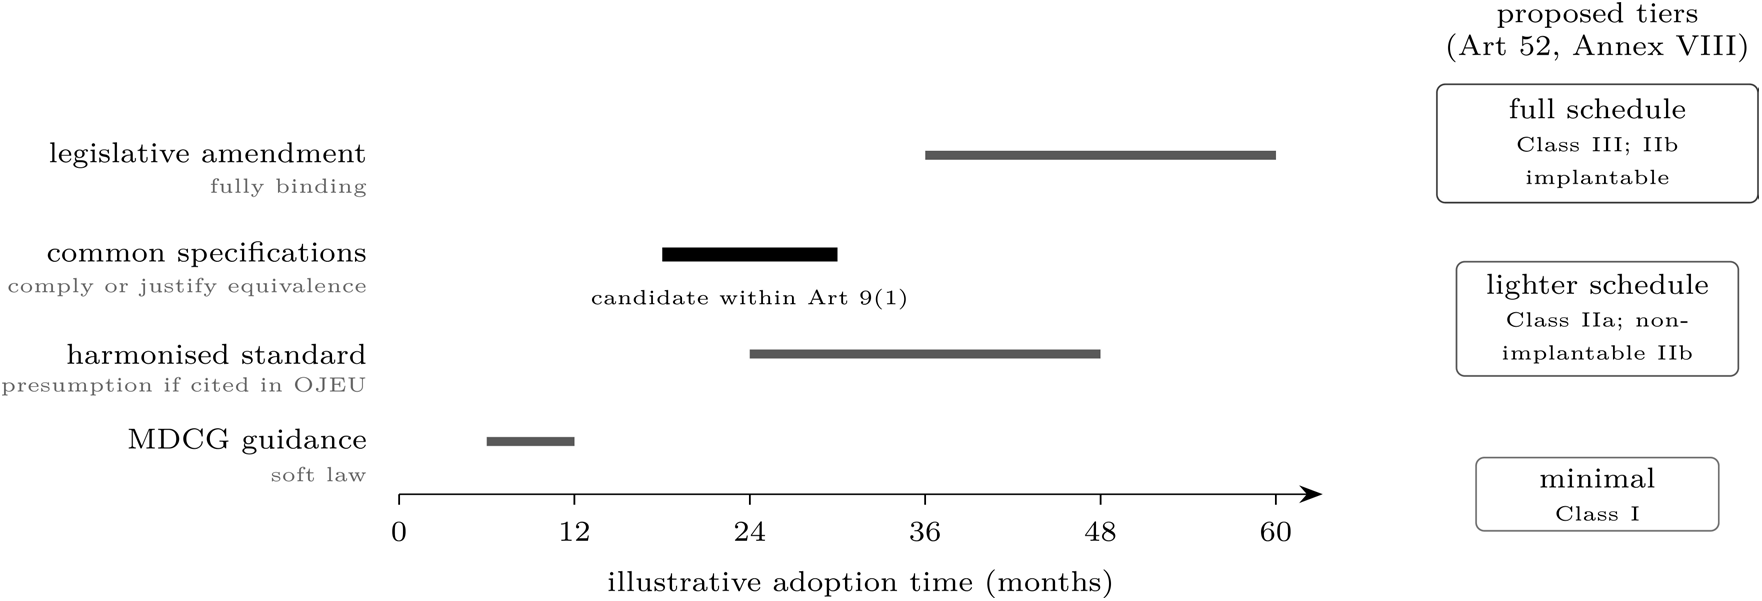


 Open access

