Introduction
A variety of factors such as narrow geographic ranges, small populations and/or greater susceptibility to environmental factors such as climate change, places certain species at elevated risk of extinction (Sousa-Silva et al. Reference Sousa-Silva, Alves, Honrado and Lomba2014). Habitat associations and geographic distributions of rare and threatened species need to be understood in detail for effective conservation and management (Jiang et al. Reference Jiang, Goodale, Yang, Yu, Jiang and Luo2020). However, field surveys to acquire this kind of information may be limited by difficult climatic conditions or because areas are inaccessible due either to topographic, political, or security constraints, as often with transboundary areas (Goodale et al. Reference Goodale, Stern, Margoluis, Lanfer and Fladeland2003).
The Giant Nuthatch Sitta magna is a globally ‘Endangered’ bird species restricted to lower montane forests, with elevation records ranging between 1,192 m and 3,400 m, in southern China, eastern Myanmar (especially Shan State), and northern Thailand (BirdLife International 2001). Its habitat associations are only partly understood, mostly from data collected in Thailand, where it is suggested to be resident in mixed coniferous and broad-leaved evergreen forests composed of large and mature trees of pine and Fagaceae species (Round Reference Round1983, BirdLife International 2001, Charonthong and Sritasuwan Reference Charonthong and Sritasuwan2009). In China, Giant Nuthatches were observed to spend more than 90% of foraging time in larger pines (Deng et al. Reference Deng, Han, Yan and Li2012). More broadly, the first quantitative landscape-level surveys in Thailand found that the abundance of the Giant Nuthatch increased with increasing proportion of hill evergreen forest, increasing elevation, and greater distance from villages (Techachoochert et al. Reference Techachoochert, Gale, Khudamrongsawat and Round2018).
The Giant Nuthatch was uplisted from ‘Vulnerable’ (VU) to ‘Endangered’ (EN) in 2012 due to presumed declines and fragmentation of likely habitat (BirdLife International 2016). The global population was very roughly estimated at 1,500–3,800 individuals (BirdLife International 2016), while its population in China was estimated at 800–2,000 individuals (Deng et al. Reference Deng, Han, Yan and Li2012, BirdLife International 2016). Its current status in Thailand has been investigated at most well-known sites (Round Reference Round1983, Techachoochert et al. Reference Techachoochert, Gale, Khudamrongsawat and Round2018, Techachoochert et al. in review) and its population estimated at about 964 individuals based on an extrapolation from sample points at 12 localities. In contrast, its population status in Myanmar is completely unknown due to a lack of both recent verified records and habitat surveys, caused by low observer coverage, poor accessibility, and ongoing sporadic insurgent activity within its range. Most of the remaining habitat in Shan State, where most historical observations were made, falls in areas under the complete or partial control of various armed ethnic groups. This, in addition to budgetary constraints, has greatly limited the central government’s ability to establish and maintain national protected areas (Myanmar Center for Responsible Business 2018).
Historical records suggest that the Giant Nuthatch’s distribution within Myanmar covers nearly one-third of its global range, south from the Mogok Hills, Mandalay Region, east from the Menetaung Range and Kalaw, Shan State, to Mt. Nattaung, in Northern Karen State (Smythies Reference Smythies1953, BirdLife International 2016, Harrap Reference Harrap, del Hoyo, Elliott, Sargatal, Christie and de Juana2018). Only three post-1950 records were listed for Myanmar in the Bird Red Data Book (BirdLife International 2001), while recent surveys in Shan State were unsuccessful in locating the species (BirdLife International 2016). The most recent documented records of Giant Nuthatch were from 1992 (Buck 1992 in BirdLife International 2001) and near Taunggyi, Southern Shan State, in the mid-1980s (BirdLife International 2001). However, it has probably been locally extirpated from near Taunggyi and from other historical locations since watershed areas have been subjected to forest clearance and burning for several decades (Htwe et al. Reference Htwe, Kywe, Buerkert and Brinkmann2015). At Kalaw, where sightings were reported in 2008 (Ko Pan Kalaw pers. comm. 2017), the coniferous forests have since been extensively cleared and burned, and Giant Nuthatch is now thought to have been locally extirpated (Bezuijen et al. Reference Bezuijen, Eaton, Gidean and Rheindt2010). More broadly, the annual deforestation rate of Shan State was high (0.93%) during the past decade, with the net forest loss between 2001 and 2010 (~5,648 km2) being regionally the largest in Myanmar (Wang et al. Reference Wang and Myint2016). Forest clearance in Shan State is driven by multiple factors including agricultural expansion, shifting cultivation, overexploitation of timber, fuelwood consumption (including for charcoal), infrastructure development, mining, and fire (Myint Reference Myint2018).
The ongoing change in land use practices, especially the transformation of forest to agricultural land in conjunction with rapid development, is likely to be having a substantial impact on this species in Myanmar (Cosset et al. Reference Cosset, Gilroy and Edwards2019). Since the remaining Giant Nuthatch habitat in Myanmar is almost entirely outside the current protected area system and might lack proper management in the future due to political constraints, there is an urgent need to assess the current status of the population and habitat there and begin the process of identifying and managing remaining habitat for the species. Here we provide observational and micro-scale habitat use data to understand Giant Nuthatch habitat associations focusing on one relatively small site, Mt Ashae Myin Anauk Myin (AMAM) in the southern Shan State. We also conducted a brief quantitative assessment of tree use, and foraging behaviour, as this basic information on habitat use is limited.
Methods
Selection of potential study areas and preliminary image classification
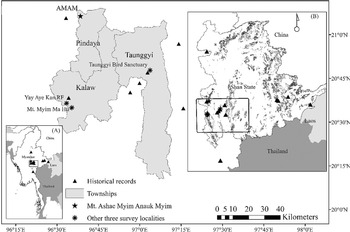
Our study areas focused primarily on 13 historical locations (Figure 1) of Giant Nuthatch (BirdLife International 2001), most of which were near or around Kalaw and Taunggyi and therefore relatively accessible compared with more remote border areas. However, we could not pinpoint exact historical locations, most of which were >70 years old, and mentioned in the literature only broadly by referring to geographically distinct features such as the nearest rivers or towns. Moreover, we also reviewed additional potential sites near or around Kalaw and Taunggyi, especially those suggested by birdwatching tour guides.
Map showing the localities of historical records and the four forest patches that were selected for initial surveys (including Mt. Ashae Myim Anauk Myim [AMAM]) for the presence/absence of Giant Nuthatch. The dark areas in inset Map (B) show approximately 3,660 potential forest habitat patches greater than 30 ha in Shan State resulting from our preliminary image classification.

To assess the remaining habitat of Giant Nuthatch and to identify the most promising areas to survey, supervised classification of 13 Landsat 8 OLI/TIRS Collection 1 Level-1 images (taken during the dry season between February and March 2018) were conducted. Training areas were manually selected from satellite images with different band combinations (5-6-4 and 5-4-3) and Google Earth images to create signature files. Then a maximum likelihood approach was used to classify the images into two land cover types (forest and non-forest) using ArcGIS 10.3. All forest areas in the classified map were assumed to be evergreen forests because the acquisition dates of the classified satellite images were between January and March, a period that most deciduous trees shed their leaves (Dong et al. Reference Dong, Xiao, Chen, Torbick, Jin, Zhang and Biradar2013). The accuracy of the classified map was assessed with 200 sample points: 100 points in forest areas and 100 points in non-forest areas. The sample points were randomly sampled from the classified map of which their true land cover types were determined visually from Google Earth (accessed on February 2018). The overall accuracy for our image classification was 90.4%.
Based on the historical records of the Giant Nuthatch in Myanmar (BirdLife International 2001), only pine and broad-leaved evergreen forests within an elevation range of 1,200–1,800 m were identified as suitable habitat. Moreover, as the home range size of Giant Nuthatch was roughly estimated at 12.2 ha (Techachoochert et al. in review), we used 30 ha as a minimum patch size to initially search for Giant Nuthatch sites. Based on the above approach, the classified land cover map was converted to a shapefile. Only forest areas were extracted and clipped with the Shan State boundary and the elevation layers (ranging from 1,200 to 1,800 m). Both Satellite images and elevation maps were acquired from the United States Geological Survey (USGS) website (www.earthexplorer.usgs.gov). Path and row numbers of each satellite image with their acquisition date are given in Table S1 in the online supplementary material. A DEM (digital elevation model) SRTM (Shuttle Radar Topographic Mission) layer was used for elevation maps. In total, there were over 300,000 polygons of evergreen forests within an elevation range of 1,200–1,800 m with a total area of approximately 16,344 km2 covering about 10.5% of the entire Shan State. However, among these, there were just over 3,660 patches larger than 30 ha covering nearly 14,000 km2 (Figure 1 – inset map B).
We selected four forest patches located in southern Shan State that we considered to have the highest potential to support Giant Nuthatch based on their proximity to historical records compiled from BirdLife International (2001), the presence of forest in the appropriate elevational zone identified from land cover map (see above), and information received during interviews of local bird guides. The four localities were (1) Mt Ashae Myin Anauk Myin (AMAM) (Pindaya Township), (2) Yay Aye Kan Reserve Forest (Kalaw Township), (3) Taunggyi Bird Sanctuary (Taunggyi Township) and (4) Mt Myin Ma Hti (Kalaw Township) (Figure 1).
Study areas
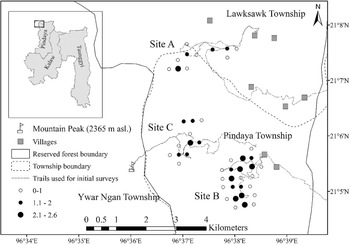
Mt Ashae Myin Anauk Myin (AMAM) is located in Zaw Gyi Reserve Forest in Pindaya and Ywaksauk Townships, at 21°05'32"N and 96°36'02"E. The estimated area of the forested portion of AMAM was approximately 18 km2 (Htike Reference Htike2019). The highest point of the area (the second highest peak in Shan State) is 2,257 m above sea level and is part of the Shan plateau. The vegetation is characterized by the presence of both broad-leaved forest and coniferous forest (Kurz Reference Kurz1877). While Pinus kesiya is dominant in the coniferous forest, various Fagaceae species are widely found in both forest types. Rhododendron forest and mountain grassland cover the highest elevations with deciduous forest at lower elevations (Kress et al. Reference Kress, DeFilipps, Farr and Kyi2003). Cattle ranching and the cultivation of garden peas occur along the mountain ridges. Orchid collection by local people from the villages around the reserve forest occurs during the winter as an alternative livelihood. An exclusion zone of approximately 40 ha inside the reserve forest, set aside for village land, comprised both tea and orange plantations. A single Giant Nuthatch was photographed in 2016 during a bird watching trip to AMAM (Ko Pan Kalaw, Tin Ko Oo and S. Gidean pers. comm. 2017). Our study area was situated in the eastern part of AMAM where we selected three separate sites (sites A, B and C) near the 2016 detection point for field survey (Figure 2).
Map illustrating abundance estimates predicted from the best model with lowest AIC at the 46 sampling points across three separate sites (A, B and C) within Mt. Ashae Myin Anauk Myin (AMAM) (22 points with detections and 24 without). The three separate sites represent the locations of sample points resulting from adaptive cluster sampling, where sample points were clustered around initial detection locations. The size of the dots (representing the locations of the sample points) corresponds to the estimated abundance at each point.

Yay Aye Kan Reserve Forest, is located 2 km south-west of Kalaw city and was established in 1912 to preserve the watershed of Yay Aye Reservoir. It has an area of about 7.90 km2. Evergreen broad-leaved forest is the dominant forest type and patches of secondary growth conifers are dispersed around the reserved forest (Kurz Reference Kurz1877). This broad-leaved forest encloses two reservoirs and many streamlets, making this reserve forest wetter than our other three study areas. Coniferous forest around the reserve forest was cleared for resin production during the Japanese occupation in WW2 (Ko Pan Kalaw pers. comm. 2017). Fuelwood collection occurs frequently inside the reserve forest while secondary growth pine trees are hacked for resin extraction. Mt Myin Ma Hti, a locality of cultural importance, is located approximately 10 km south-east of Kalaw City. Coniferous forest mixed with broad-leaved trees covers a small, isolated patch of 39 ha of Myinmati Mountain.
Taunggyi Bird Sanctuary was the locality of one of the most recent published records of Giant Nuthatch from the mid-1980s (BirdLife International 2001). First established in 1906 as the Taunggyi Wildlife Reserve, it was re-designated as a bird sanctuary in 1989 (Beffasti and Galanti Reference Beffasti and Galanti2011). Approximately 8 km2 of the sanctuary is covered with coniferous forest and evergreen broad-leaved forests. Frequent fires, logging and turpentine oil extraction are the main threats, while proximity to urban areas causes additional disturbance to wildlife (Beffasti and Galanti Reference Beffasti and Galanti2011).
Data Collection
Preliminary locality surveys: We started searching for Giant Nuthatch on 23 November 2018, spending about one month visiting our four study areas. Nesting is known to occur from February to April (Livesey Reference Livesey1933, Round Reference Round1983, Techachoochert Reference Techachoochert2018) and the species was thought to be most detectable in the few months prior to nesting (Techachoochert et al. Reference Techachoochert, Gale, Khudamrongsawat and Round2018). We walked and biked common trails used by locals and tourists for collecting forest products, bird watching and hiking. Approximately 40 km of trails/track were walked or surveyed by motorcycle. We searched for Giant Nuthatch using playback of vocalizations, both songs and calls. We played the songs and calls for about one minute and waited the response for five minutes. If there was no detection, we moved approximately 300 m and repeated the playback. We implemented the surveys to cover the whole of each selected site and stopped searching after covering nearly the entire area of each forest patch. No Giant Nuthatches were detected in Yay Aye Kan Reserve Forest, Mt. Myin Ma Hti and Taunggyi Bird Sanctuary. We found Giant Nuthatch in only one locality, AMAM (Figure 2), locating our first individual on 24 December 2018 after 11 days of searching there. We then conducted more intensive quantitative surveys in AMAM (see below).
Point count surveys in AMAM: Adaptive cluster sampling was used for setting up the sample points, in which four adjacent points were established around the primary starting points — each survey point was 300 m apart in cardinal directions where possible. When adjacent points could not be established due to steep slopes, impenetrable undergrowth or unsuitable non-forest habitat like tea plantations, plots were set at greater distances in the same direction. We established a total of 46 sample points (10 primary starting points and 36 adjacent points) (Figure 2) in three separate sections of AMAM (sites A, B, & C as noted above). To estimate detection probability and abundance, repeated surveys were conducted at each of the 46 points. We sampled 43 points five times and, due to logistical constraints, three points two to three times.
Point count surveys were conducted from January 2019 to March 2019. We conducted point-count surveys by using playback of vocalizations of Giant Nuthatch to increase the probability of detection (Bibby et al. Reference Bibby, Burgess, Hill and Mustoe2000) as our experience suggested it calls relatively infrequently. Recordings of calls and songs were obtained from the xeno-canto database (www.xeno-canto.org). During the surveys, the Giant Nuthatch contact call was played for 30 seconds, followed by five minutes of observation. If there was no response, the Giant Nuthatch territorial song was played instead, for 30 seconds, followed by observations for a further five minutes (following Techachoochert et al. Reference Techachoochert, Gale, Khudamrongsawat and Round2018). Each session therefore lasted about 11 minutes. The surveys were conducted from sunrise until noon. The presence of the bird was recorded by either sighting or aural detection of vocalizations within an estimated 150 m radius from the centre of each survey point. When the bird was detected, we measured the distance to the bird with a tape measure and recorded the direction to the bird (degrees), and location of the bird within a tree or other substrate (they occasionally fed on the ground or on fallen trees).
Habitat sampling in AMAM: Micro-site variables and vegetation characteristics were sampled at each point count location (also marked with a GPS). At the centre of each point, one circular plot (12.6 m in radius, 0.05 ha) was established to sample the elevation, slope, aspect and plant community. We used a 12.6 m rope to determine the radius from the centre and to measure the vegetation characteristics. Canopy openness was estimated with an ocular tube at five distance intervals (approximately 2.5 m apart) in each of four cardinal directions (Bunnell and Vales Reference Bunnell and Vales1990). All trees (>10 cm DBH [diameter at breast height]) within the sample plots were assessed, including number of stems, tree species and DBH (Sutherland Reference Sutherland2006). Slope in degrees from the horizontal and its aspect were measured by using a SUUNTO clinometer.
Foraging substrate and foraging behaviour in AMAM: Foraging observations were conducted in the three target sites within AMAM to encompass the range of microhabitats within the study area. We searched for birds without playback. When evaluating foraging substrate, we recorded the trees on which Giant Nuthatch was foraging, together with 2–3 available trees (> 10 cm DBH) nearest to each used tree to assess the characteristics of used versus available trees (McCallum et al. Reference McCallum and Gehlbach1988). We recorded the time spent on each tree species and its DBH.
Detailed observations of foraging behaviour were collected during 5–15-second behavioural samples (Adams and Morrison Reference Adams and Morrison1993). Sequential observations were used to reduce biases related to foraging strategies (Morrison Reference Morrison1984). To minimize possible effects of initial observer disturbance, no data were recorded for the first 10 seconds after a bird was sighted (Adams and Morrison Reference Adams and Morrison1993). Surveys were conducted throughout daylight hours during March–April 2019.
For foraging behaviour, we recorded substrate and foraging mode used by focal birds including the duration that the bird spent on each substrate and each mode of foraging. Substrate categories included trunk, large branch (> 15 cm diameter), medium branch (5–15 cm), small branch (1–5 cm), twig (< 1 cm), fallen log, fallen branches and the ground (following Adams and Morrison Reference Adams and Morrison1993). We defined mode of foraging as (1) gleaning, removal of stationary prey from the surface of a substrate while perched; (2) probing, insertion of bill into bark crevices or depressions in substrates in search of prey (an action which usually created little or no audible sound); (3) pecking, striking substrate forcefully with the bill to obtain prey beneath the surface (usually creating a clearly audible sound); and (4) flaking, in which loose particles of substrate surface were chipped away by the bill (following Adams and Morrison, Reference Adams and Morrison1993). The time spent travelling along the bark surface, flying and remaining stationary were also recorded.
Data analysis
Abundance models: Data analysis was conducted only for the 46 points surveyed at AMAM. N-mixture models (Royle Reference Royle2004) were used to estimate the abundance of Giant Nuthatches because N-mixture models provide unbiased estimates and require only counts of individuals without the need and the risks of capturing animals (Ficetola et al. Reference Ficetola, Barzaghi, Melotto, Muraro, Lunghi, Canedoli, Parrino, Nanni, Silva-Rocha, Urso and Carretero2018). Since two GLMs (generalized linear models) are included in N-mixture models (Poisson regression for the spatial variation in abundance and a binomial regression for the variation of the observed counts at specific sites), this enables modelling for both parameters (abundance and detection probability) simultaneously (Kéry and Royle Reference Kéry and Royle2015).
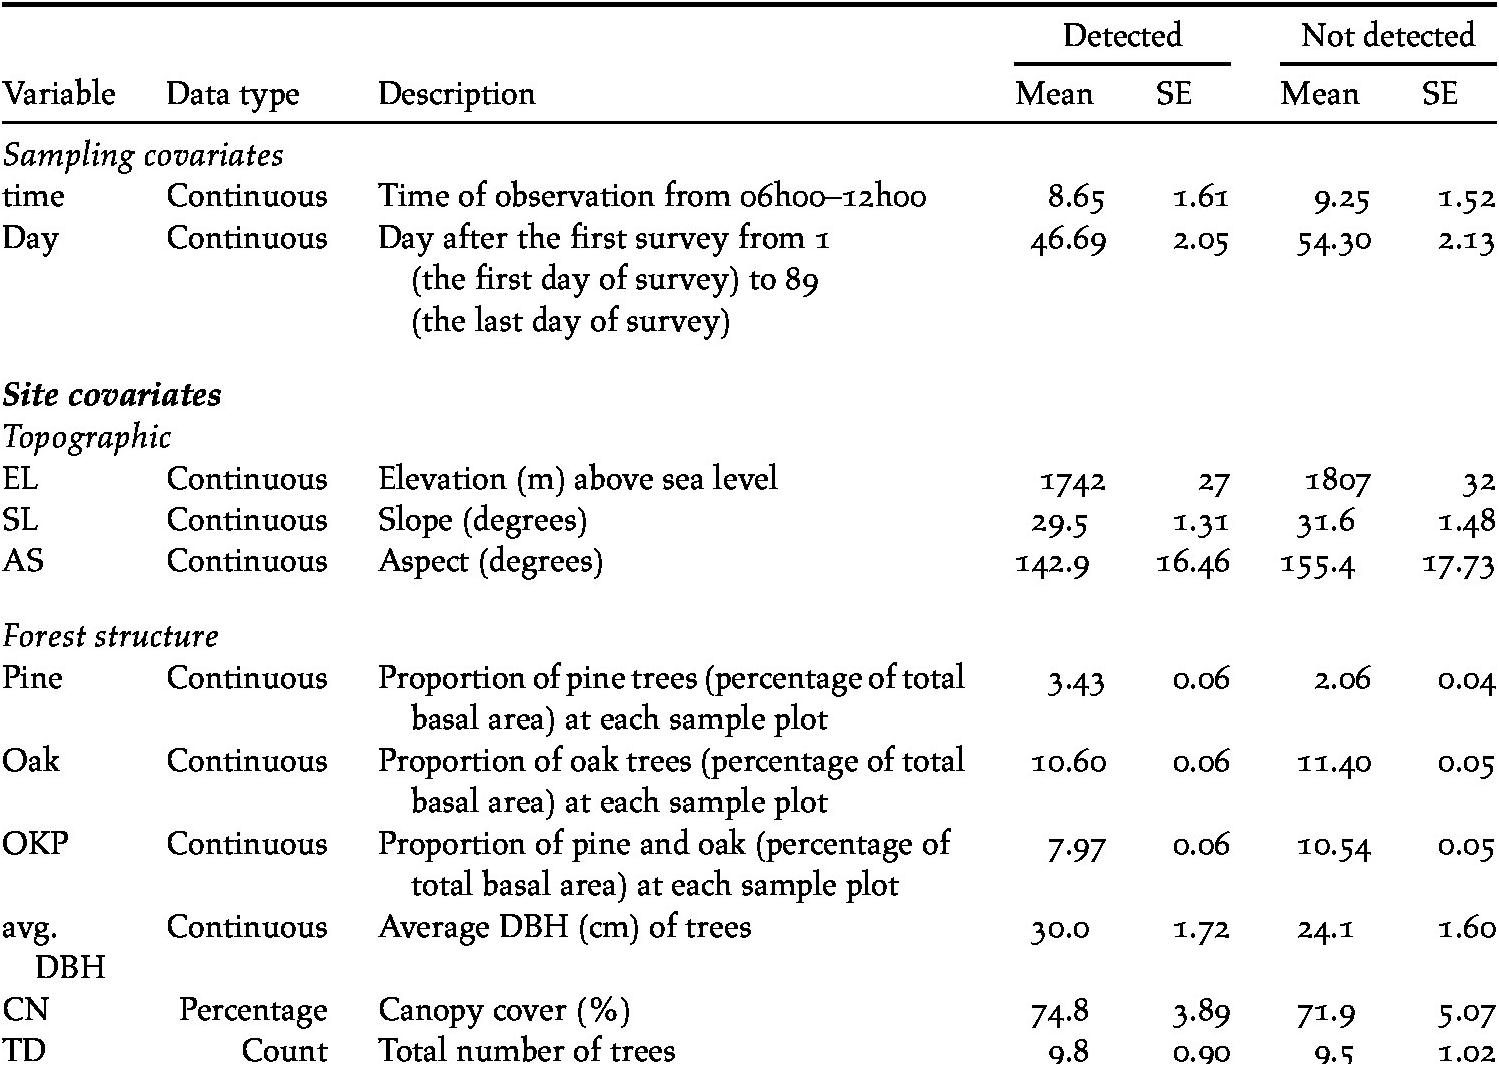
The time of day and survey date were included as sampling covariates. Forest structure covariates included average tree diameter at breast height (DBH), number of trees and canopy cover, proportion of pines based on total basal area, proportion of oaks based on total basal area and proportion of both pines and oaks combined at each sample plot based on their total basal area. Topographic covariates (slope, aspect, and elevation) were also included as site covariates (Table 1). Both site and sampling covariates were firstly centred to have a zero mean and scaled unit variance (one standard deviation) by subtracting the mean then dividing by one standard deviation, using the ‘scale’ function in program R (Crawley Reference Crawley2005). All variables were tested for multicollinearity using a pairwise-correlation matrix (Spearman rho, ρ) and one of each pair where the correlation coefficient was ≥ 0.6 was removed (Zuur et al. Reference Zuur, Ieno and Elphick2010). Only one pair of covariates, proportion of oaks and proportion of both pines and oaks combined was found to be correlated (ρ = 0.6), and not included in the same model.
Descriptions, means, and standard errors ‘SE’ of sampling, sites and topographic variables at 46 sample points where Giant Nuthatch Sitta magna was detected and not detected.

For N-mixture models, parameter estimation can be biased by the K-value, which is the upper limit of the unobserved population size for any site that the model is set to allow (Kéry Reference Kéry2018). Therefore, to ensure that the latent abundance was larger than the observation counts, we tested three different values of K (100, 200, and 300) following Couturier et al. (Reference Couturier, Cheylan, Bertolero, Astruc and Besnard2013) based on Royle (Reference Royle2004) to find the value of K with the minimum bias. A K-value of 100 was found to have sufficiently low bias for building the models. The global model is considered the best candidate for assessing fit statistics such as overdispersion (Burnham and Anderson Reference Burnham and Anderson2002, Harrison et al. Reference Harrison, Donaldson, Correa-Cano, Evans, Fisher, Goodwin, Robinson, Hodgson and Inger2018) and it was then tested for goodness of fit by means of a Pearson chi-square test (MacKenzie and Bailey Reference MacKenzie and Bailey2004) using parametric bootstrap resampling (1,000 resamplings). A bootstrap chi-squared goodness-of-fit test suggested that the global model performed well in fitting the data (bootstrapped P value = 0.295).
A two-step modelling approach was used to assess the variables that affected detection probability and abundance (e.g. Adams et al. Reference Adams, Chelgren, Reinitz, Cole, Rachowicz, Galvan, McCreary, Pearl, Bailey, Bettaso and Bull2010, Harihar and Pandav Reference Harihar and Pandav2012, Robinson et al. Reference Robinson, Bustos and Roemer2014, Kamjing et al. Reference Kamjing, Ngoprasert, Steinmetz, Chutipong, Savini and Gale2017). In the first step, we built three models to test if our two sampling covariates (time of day and date after the first survey) affected detection probability or not. We then selected the most supported model of the sampling covariates that affected detection probability and included these sampling covariates in generating the abundance models in the second step of our modelling approach.
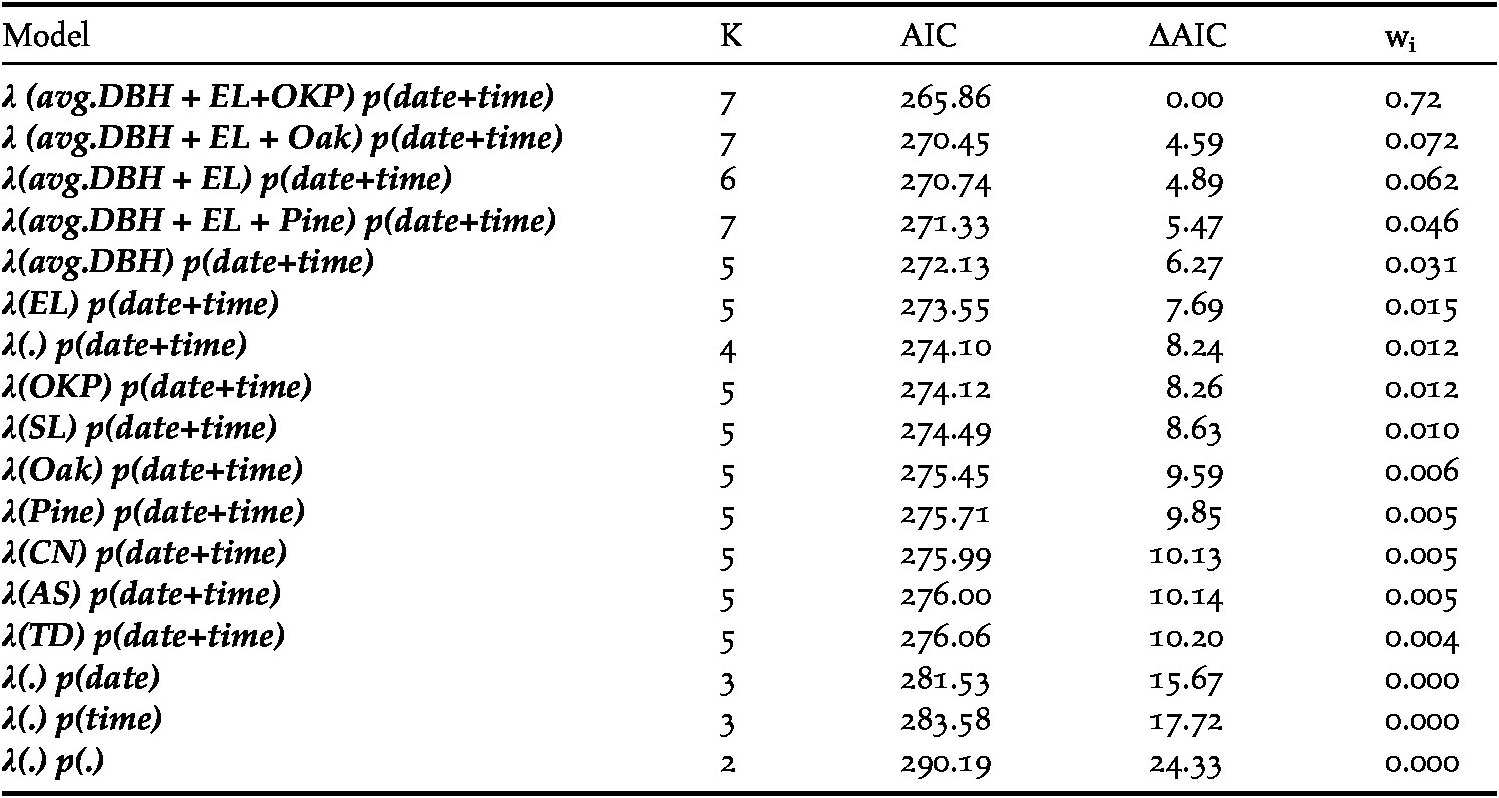
In the second step, we tested 12 single variable models and five models comprised of combinations of five variables (average DBH, elevation, proportion of pines, proportion of oaks and proportion of both pines and oaks combined) that were considered to be influential on the habitat preference of Giant Nuthatch based on our knowledge of its ecology and relevant literature. These 17 models were used to test variables associated with the probability of nuthatch abundance (λ) and the probability of nuthatch detection (p) (Table 2). We compared the constant model (intercept-only-model), to models containing variables of interest. Differences in Akaike’s Information Criterion (∆AIC) and AIC weights (wi) were used to compare the models (Burnham and Anderson Reference Burnham and Anderson2002).
Model selection of Giant Nuthatch Sitta magna abundance in relation to site variables. Variables considered in models included forest structure covariates at each sample point including average DBH (avg.DBH) of trees in cm, canopy cover (CN) in percent, total number of trees (TD), proportion of pine (Pine) in m2 calculated based on its total basal area, proportion of oak (Oak) in m2 calculated based on its total basal area, proportion of both pine and oak combined in m2 that was calculated based on their summed total basal area (OKP) and topographic covariates including elevation (EL) in m, slope (SL) in degrees, aspect (AS) in degrees, and date (date) and time of day (time) as sampling covariates.
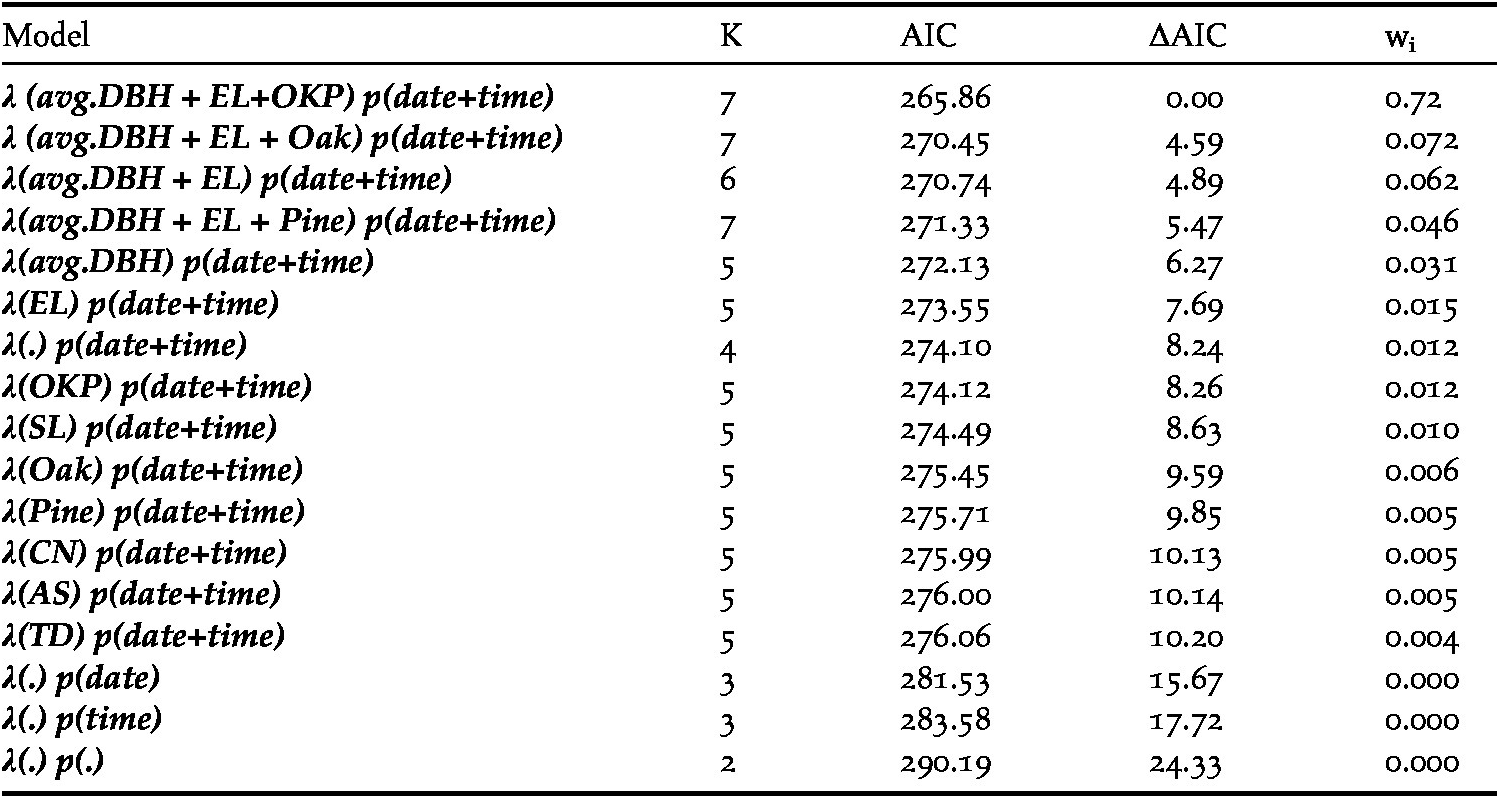
“K” represents the number of parameters, “AIC” for Akaike Information Criterion, “ΔAIC” for difference in AIC and “wi” for AIC weight. “λ” represents the function of abundance estimate, “p” for the function of detection probability and “λ(.) p(.)” is the null model without any covariates.
We undertook model averaging focusing on the top models that represented a cumulative weight of 95% of the AIC weights following Burnham and Anderson (Reference Burnham and Anderson2002) to obtain averaged estimates of beta coefficients and prediction. Confidence intervals of 85% were used to recognize variables with weighty influence on the abundance estimate: 85% confidence intervals provide model selection and parameter-evaluation criteria more congruent than narrower interval widths (Arnold Reference Arnold2010). We conducted the analysis in R version 3.5.0 (R Development Core Team 2013), using N-mixture models with the “unmarked” package (Fiske and Chandler Reference Fiske and Chandler2011) and model averaging with the “AICcmodavg” package (Mazerolle Reference Mazerolle2013).
Foraging data analysis: The percentage of time spent on a particular tree species, substrate and foraging mode were compared. The data were expressed as a percentage of total observation time per individual (where each day was a sample period) and transformed into continuous variables (Adams and Morrison Reference Adams and Morrison1993). Arcsine transformation was used to transform the percentages for the proportional data (Zar Reference Zar1999). Since the transformed data did not meet the assumptions of an analysis of variance (ANOVA), Kruskal-Wallis nonparametric one-way ANOVA was used to test the differences in percentage of time spent on each substrate and foraging activity (Morrison Reference Morrison1984, Zar Reference Zar1999). Chi-squared tests were used to analyse the relationship between proportional use and proportional tree abundance, based on relative basal area of tree species surveyed during our vegetation sampling. Tree preference was analysed using a Mann-Whitney U Test to test between the DBH of used and available neighbouring trees.
Results
Detection probability and abundance
At AMAM, there were detections of Giant Nuthatch at 22 points (47.8%) and no detections at 24 points (52.2%). The elevation range of detections was 1,523–2,098 m above sea level. At the points with detections, there was a total of 63 detections during 223 replicate surveys and no more than two birds were ever detected at a point on any single sampling occasion. At nine of the points, two birds were detected during a single count, and at the other 13 points there were only detections of single individuals.
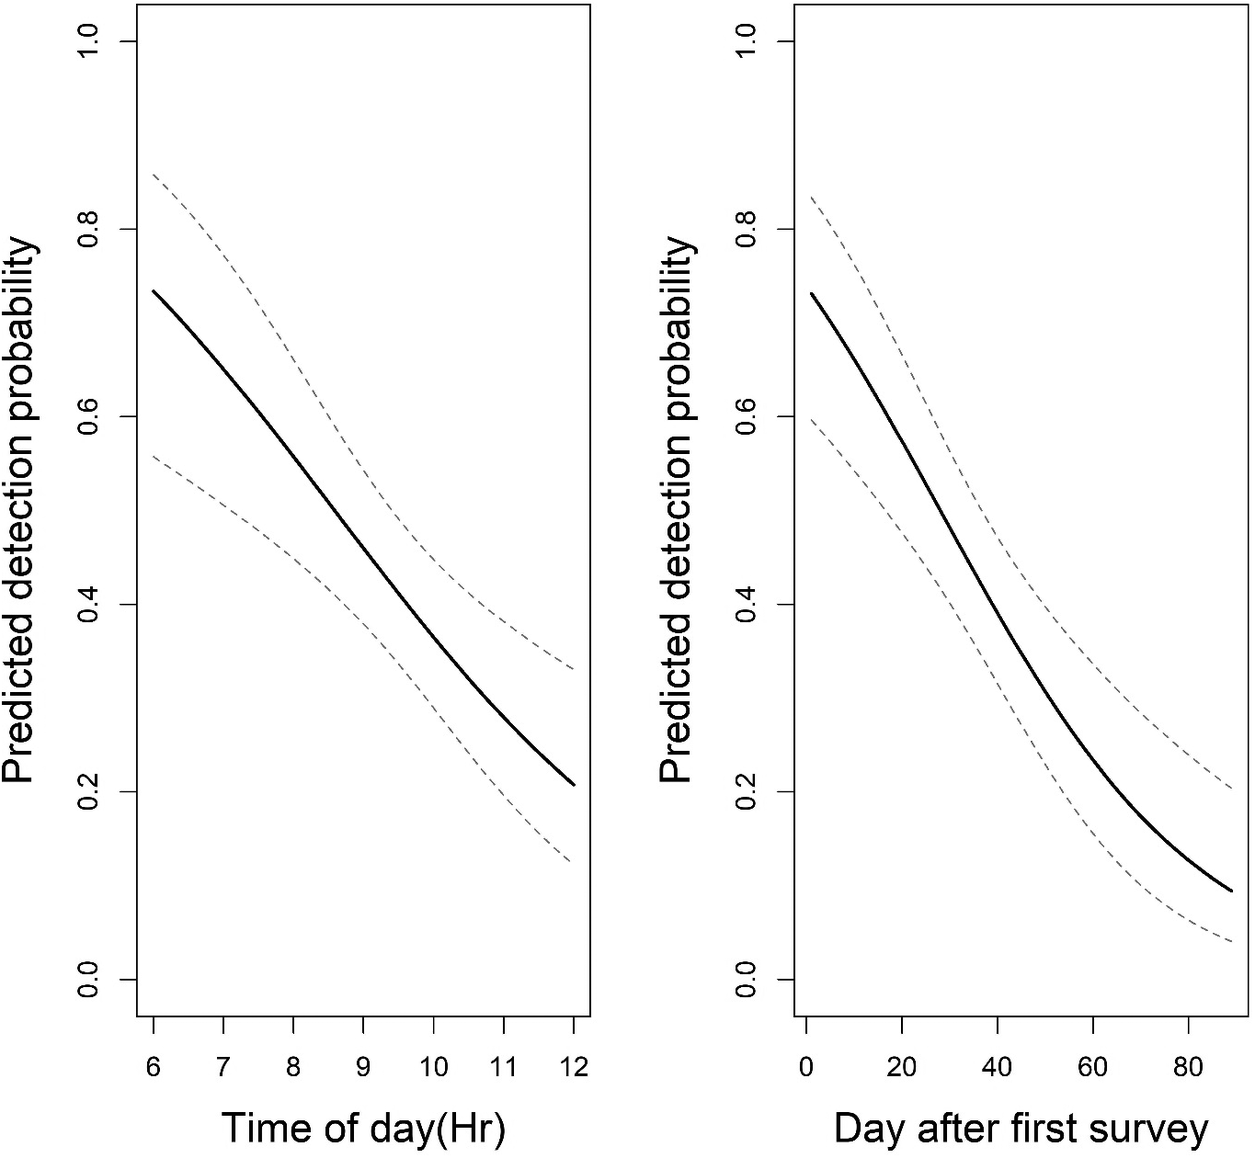
Survey time and survey date likely affected detection probability, as indicated by the AICwi of 96% and relative support over the null model, ΔAIC > 16. As expected, the detection probability was greatest in the early hours of daylight and decreased throughout the morning (βaveraged = -0.51, 85% CI -0.78– -0.23; Figure 3). Similarly, the detection probability was higher in the early period of the survey season than the later period (βaveraged = -0.74, 85% CI -1.05– -0.43; Figure 3). Thus, as mentioned above, we used models with time of day and date for assessing how site covariables potentially affected abundance (Table 2).
Relationship between predicted detection probability and time of day surveys (Left) Relationship between predicted detection probability and day after the first survey (Right) [surveys were conducted from 4 January to 30 March 2019]. Solid lines represent predicted detection probability as a function of time of day (06h00–12h00) and the date relative to the first survey (0-89). Dashed lines represent lower and upper 85% confidence intervals.

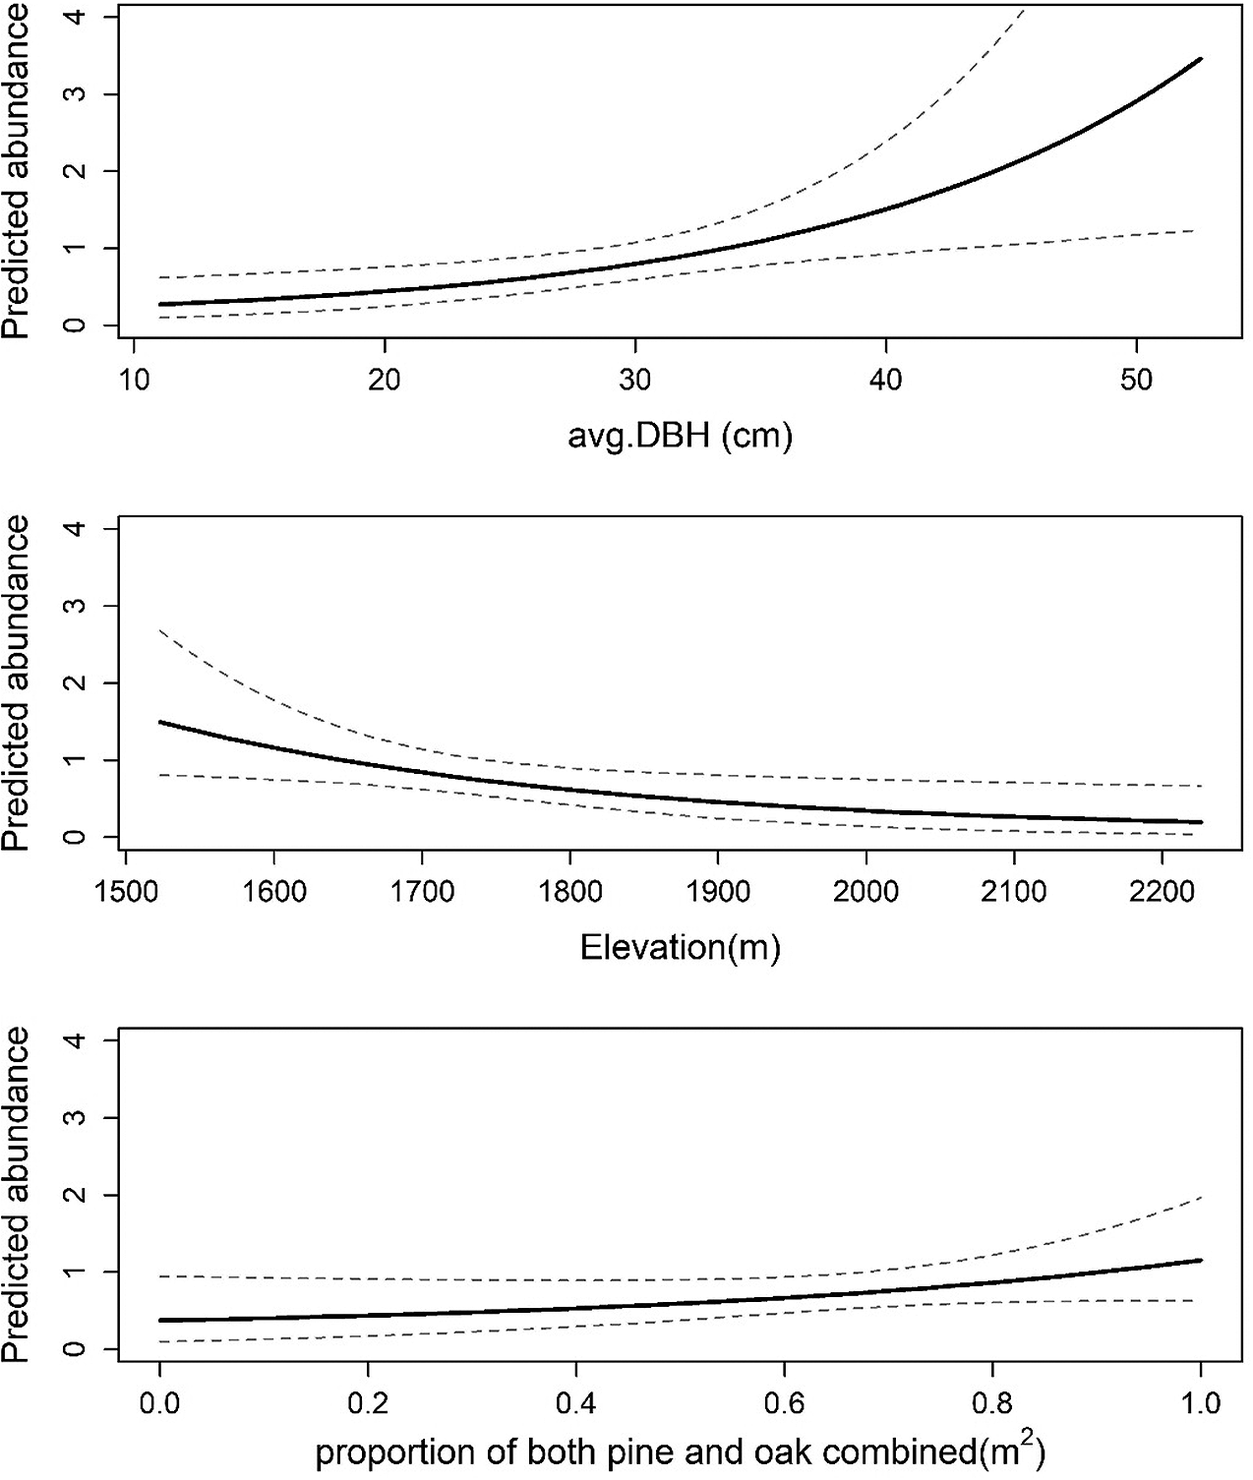
Among our 17 models, the model which included average DBH, elevation, and proportion of both pines and oaks was found to be the most supported, with a ΔAIC > 4 compared to the second-most supported model. This model in conjunction with the next six most supported models, accounted for > 95% of the cumulative AIC weights (Table 2). These top seven models were averaged to estimate the coefficients of the tested variables. The abundance of the nuthatch was associated with increasing average DBH (βaveraged = 0.55; 85% CI: 0.23–0.87, decreasing elevation (βaveraged = -0.51; 85% CI: -0.86– -0.15) and increasing proportion of both pines and oaks (βaveraged = 0.51; 85% CI: 0.22–0.80) (Figure 4). The sizes of the coefficients suggested that the effect sizes for each of these three variables were highly supported and similar in magnitude. The predicted mean abundance per point was 1.23 individuals (95% CI: 0.55–2.78) with a detection probability of 0.37 (95% CI: 0.26–0.51). The total population of the nuthatch in AMAM within the sampled area of 3.25 km2 was estimated to be 56 individuals (95% CI: 25–128) equivalent to 17.23 individuals/ km2 (95% CI 7.69–39.38).
Relationship between the predicted mean abundance and average diameter at breast height (DBH) of trees (Upper). Relationship between the predicted mean abundance per sample point and elevation (Middle). Relationship between the predicted mean abundance per sample point and proportion (based on basal area) of both pine and oak combined (Lower). Solid line represents predicted mean density estimate and dashed lines represent lower and upper 85% confidence intervals.

Foraging behaviour
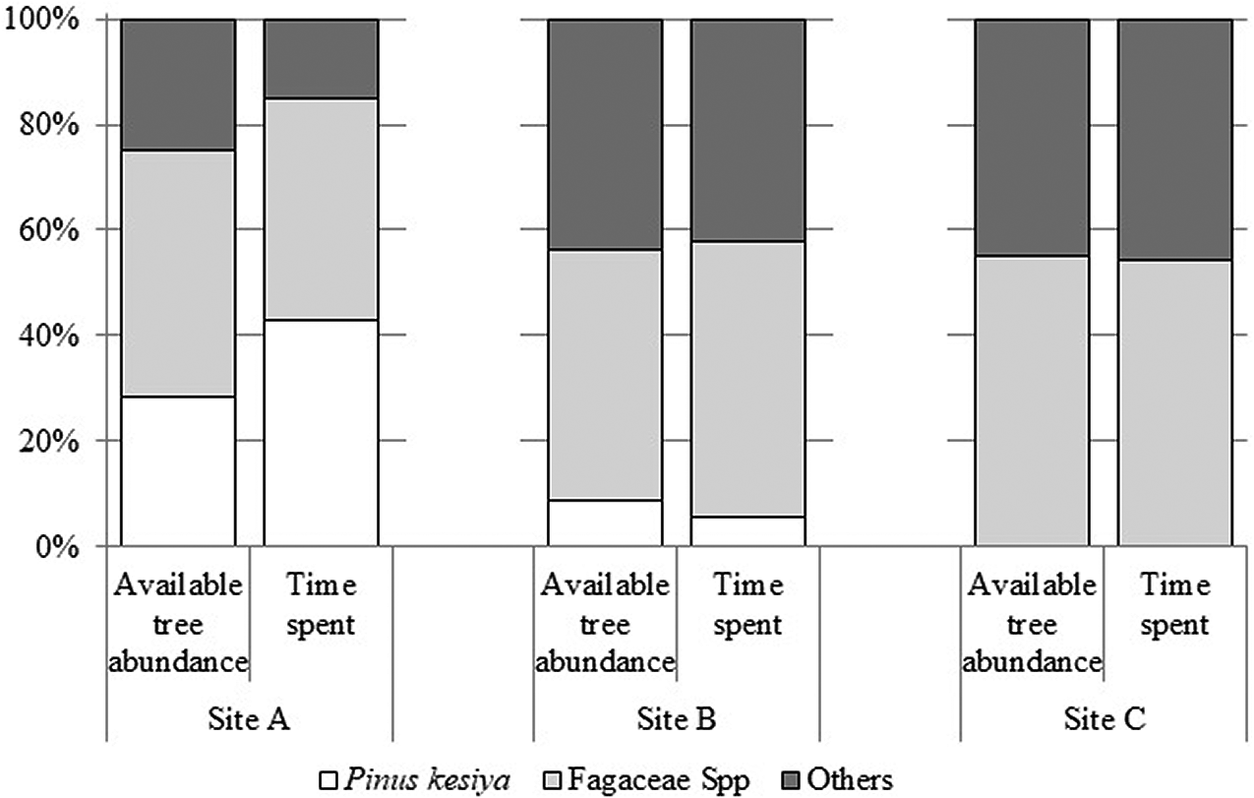
A total of 30 unique observation events totaling 41 minutes of behaviours were recorded during 19 observation days. In total, 14, 10 and 6 observation events were recorded in Sites A, B and C, respectively, with 21, 12 and 8 minutes of observations, respectively. Our analysis found that there was no significant difference in the time spent on any specific tree species relative to the proportional tree abundance in any of the three sites within AMAM (Site A, χ2 = 5.95, P = 0.51) (Site B, χ2 = 0.19, P = 0.91) (Site C, χ2 = 0.74, P = 0.69) (Figure 5). Our sample sizes per site were small, however, and although the difference was not significant, it was noted that Giant Nuthatch appeared to spend proportionally more time (42%) on pine compared with the available basal area of pine (28%) in Site A. The time spent on pine (6%) was roughly proportional to the pine abundance (9%) in Site B (P > 0.05) while there was no pine at Site C. There was no significant difference in the foraging time spent on Fagaceae compared with other broadleaved tree species (Figure 5), although as already noted above the sample sizes were small.
Available tree abundance and proportional use of tree species by Giant Nuthatches in Mt Ashae Myin Anauk Myin (AMAM) during the breeding season, 1 March 2019–30 April 2019. A total of 30 unique observation events totalling 41 minutes of behaviours were recorded during 19 observation days. 14, 10 and 6 observation events were sampled in Sites A, B and C totalling 21, 12 and 8 minutes, respectively.

Giant Nuthatches spent most time feeding by pecking, and travelling along trunks, and the least amount of time on gleaning (Kruskal-Wallis, P < 0.01). Overall, the nuthatches spent 43% of time pecking, another 33% travelling, 10% flaking, 6% stationary, 5% probing, 3% flying and 1% gleaning. Giant Nuthatches spent the most time foraging on tree trunks, least amount of time on small branches, and no time on twigs (Kruskal-Wallis, P < 0.01). Overall, nuthatches spent 50% of the time on trunks, 28% on large branches, 21% on medium-sized branches and 1% on small branches. The diameter of the trees used for foraging (average DBH = 41.2 cm, n = 39) was significantly larger compared to the available sample of trees (average DBH = 31.5 cm, n = 90) (Mann-Whitney U Test, P < 0.001).
Discussion
Current distribution status
We detected Giant Nuthatch only in AMAM, while no detections were recorded at the other three study areas. Although the extent of our survey cannot entirely confirm the absence of the species from two historical locations, we suspect its likely extirpation at both sites due to habitat loss, since both were previously part of larger patches of broad-leaved and coniferous forests which are now fragmented by urbanisation, and from which the large pine trees have been lost (Bezuijen et al. Reference Bezuijen, Eaton, Gidean and Rheindt2010). Although we did not assess the forest composition in detail, the denser, closed canopy moist environment of Yay Aye Kan reserved forest might not have been the preferred habitat of the Giant Nuthatch because the vegetation type of the reserved forest appeared to be notably wetter (more closed canopy with multiple streamlets and reservoirs) than current Giant Nuthatch sites in both AMAM and Thailand (Round Reference Round1983, Matthysen Reference Matthysen1998, Techachoochert et al. Reference Techachoochert, Gale, Khudamrongsawat and Round2018). The lack of detections in Taunggyi Bird Sanctuary is most likely the result of habitat changes, although again more extensive surveys are needed to confirm the absence of the species.
There were no published, or even known, records of Giant Nuthatch in Myanmar since 1992 until our survey and while it is most likely that the species occurs in other localities in the country, our surveys at AMAM generated the only confirmed recent records in Myanmar. We conducted surveys in a total area of 34.3 km2 covering the four sites of our study, perhaps representing only 0.2% of the total possible habitat of Giant Nuthatch in Shan State. This indicates the urgency of the need for further surveys elsewhere in sites with potentially suitable habitat.
Our estimated population in AMAM comprises approximately 1–3% of the global population based on current estimates (BirdLife International 2016), and therefore AMAM should be considered a globally important locality for Giant Nuthatch (IUCN 2016). While the range of Giant Nuthatch in Myanmar potentially represents about 30% of its global range, the distribution and population of Giant Nuthatch in Myanmar remains unknown. As noted above, the annual deforestation rate of its habitat in Myanmar (primarily Shan State) is so high that remaining birds, whether many or few, are almost certainly at immediate risk (Wang et al. Reference Wang and Myint2016).
Our surveys and habitat samples indicate that Giant Nuthatch was patchily distributed in more open and drier mixed coniferous forest and avoided denser and wetter broad-leaved evergreen forests. Although AMAM (18 km2) was comparatively larger than our other three study areas, it probably held only a relatively small Giant Nuthatch population (see below). Given that we do not have any demographic data to estimate a minimum viable population (MVP) size for the species, borrowing from recent data from Thailand, the largest suitable patch surveyed for Giant Nuthatch was approximately 63 km2 containing an estimated 233 individuals, about 3.7 birds/km2 (Khamcha et al. unpublished). In the absence of more detailed estimates, we suggest forest patches greater than 60 km2 be considered as an initial minimum target size for searching for possible Giant Nuthatch strongholds remaining in Myanmar. Our preliminary image classification identified 34 such potential strongholds (>60 km2) mostly in the northern and eastern parts of Shan State (Figure 1- inset map B); these patches warrant urgent investigation. Finally, the highest elevation at which we recorded Giant Nuthatch here, approximately 2,100 m, was a new elevational record for its range within Myanmar and should be taken into account when searching for potential habitat.
Detection probability and abundance in AMAM
Detection probability decreased with date during the period of our survey (January–March), with higher detection rates during January to the end of February suggesting that detection and response to playback was higher prior to nesting, as seen with other breeding birds (Amrhein et al. Reference Amrhein, Kunc and Naguib2004, Strebel et al. Reference Strebel, Kéry, Schaub and Schmid2014). The negative correlation in singing rates with time of day observed here was also consistent with previous observations of multiple species (e.g. Amrhein et al. Reference Amrhein, Kunc and Naguib2004).
The abundance of Giant Nuthatch increased with increasing DBH of trees, increasing proportion of both pines and oaks, and decreasing elevation within the altitudinal range of 1,523 to 2,225 m above sea level. However, forest below 1,523 m has largely been replaced by agriculture, thus we could not realistically identify the lower elevational limit of the species. The positive correlation with tree DBH may be because larger, more mature trees offer a greater area of substrate for foraging especially as we observed them spending most of their time on trunks and large branches. Further, since Giant Nuthatches are secondary hole-nesting species, large trees might provide more natural holes for nesting (Paillet et al. Reference Paillet, Archaux, Boulanger, Debaive, Fuhr, Gilg, Gosselin and Guilbert2017).
The positive relationship between abundance and the proportion of pines and oaks is consistent with the findings in China and Thailand (Deng et al. Reference Deng, Han, Yan and Li2012, Charonthong and Sritasuwan Reference Charonthong and Sritasuwan2009) and that a mix of both oaks and pines may be preferred over pure stands of pines for example.
The negative correlation with elevation was opposite of the findings of Techachoochert et al. Reference Techachoochert, Gale, Khudamrongsawat and Round2018, and while the altitudinal range of our study overlapped that of Techachochert et al. 2018, ours encompassed a notably higher range (1,523–2,225 m) than the Thai surveys (1,000–1,830 m). The negative association with elevation in our study may be in part because the higher elevations are less likely to support P. keysia (mostly found between 1,000 and 1,800 m; Pousujja et al. Reference Pousujja, Granhof, Willan and Graudal1986). However, this relationship is by no means universal, and pine was found up to 2,000 m in one site of AMAM. The highest elevation of our detection 2,098 m was also clearly above previous historical records for Myanmar (~ 1,800 m) for Giant Nuthatch possibly suggesting that the highest points we surveyed were in marginal habitat for this part of their range. Because the range of elevations sampled were notably different between our study and that of Techachoochert et al. Reference Techachoochert, Gale, Khudamrongsawat and Round2018, it is difficult to compare the influence of elevation. Overall, however, the elevational range of the nuthatch’s preferred habitat association in both Thailand and Myanmar appears to be relatively narrow —certainly more so than in China (BirdLife International 2001, Techachoochert et al. Reference Techachoochert, Gale, Khudamrongsawat and Round2018).
The population estimate of 56 Giant Nuthatch individuals in AMAM in 3.25 km2 of survey coverage was equivalent to 17.23 individuals/ km2. Our estimate is notably higher than the landscape estimates of Techachoochert et al. Reference Techachoochert, Gale, Khudamrongsawat and Round2018 (~ two individuals / km2); Khamcha et al. unpubl. (3.7 individuals/ km2) in Thailand; and Deng et al. (Reference Deng, Han, Yan and Li2012) (~ two individuals / km2) in China. This may be because our estimate was restricted to only one forest patch with detections, while their research was conducted over broader areas with a mix of habitats and more secondary forest. For example, Techachoochert et al. (Reference Techachoochert, Gale, Khudamrongsawat and Round2018) detected Giant Nuthatch at only 12 of 42 survey points (roughly 29%) compared to 22 of 46 (~ 48%) in our study. A recent single-site study in Thailand had somewhat higher densities (1.55–6.33 birds / km2; Techachoochert et al. in review). The home range size for a pair of Giant Nuthatches during the breeding season, determined by radio-telemetry, was approximately 12.2 ha (Techachoochert et al. in review), indicating a plausible density of up to 16 birds (8 pairs)/km2 in entirely saturated habitat. Taken together, these recent findings suggest that our estimates are credible but should be interpreted cautiously given the wide confidence interval and the relatively short distances between our sample points. The lower limit of our abundance estimate (25 individuals), equivalent to 7.69 birds /km2, approaches the recent single-site density estimate from Thailand, further suggesting that the true abundance of Giant Nuthatch at AMAM is more likely closer to the lower bounds of our confidence limit.
Foraging site selection and foraging behaviour
Our very limited data suggested that the nuthatches spent more time on pine than other broadleaved species relative to their availability and this is similar to findings in Thailand (Charonthong and Sritasuwan Reference Charonthong and Sritasuwan2009). Giant Nuthatches foraged on a variety of broad-leaved tree species but appeared to prefer those with larger DBH, where they apportioned most of their foraging time on trunks and large branches. This finding was similar to that in Corsican Nuthatch Sitta whiteheadi, a pine-specialist nuthatch which preferred older stands with tall, large Corsican pines Pinus nigra laricio (Thibault et al. Reference Thibault, Prodon, Villard and Seguin2006). Giant Nuthatches would seem to forage on trunks and large branches because trunks are typically coarser than small branches and may support higher densities of arthropods (Mariani and Manuwal Reference Mariani and Manuwal1990). Giant Nuthatches’ apparent preference for foraging on trunks and large branches was also similar to other nuthatch species including Brown-headed Nuthatch Sitta pusilla (Morse Reference Morse1967) and Eurasian Nuthatch Sitta europaea (Adamík and Kornan). Although Giant Nuthatches appear to have a broad diet, the relatively large percentage of time spent on pecking on trunks and branches versus other foraging strategies may suggest they prefer arthropods to nuts and berries during their breeding season.
Conservation implications
In Myanmar, 132 terrestrial and coastal key biodiversity areas (KBAs) were identified in 2012 based on the criteria of Langhammer et al. (Reference Langhammer, Bakarr, Bennun, Brooks and Clay2007). These cover 65,304 km2 or about 10% of the land area, but only 35 KBAs (25% of the area of all KBAs combined) are in, or partly included within, protected areas (Forest Department, Myanmar 2015, WCS 2013). AMAM is currently not a protected area under the Myanmar Protection of Biodiversity and Protected Area Law (2018) and instead is managed as a reserve forest under Myanmar Forest Law (2018) by the Myanmar Forest Department. Greater protection for priority hill evergreen forest patches such as AMAM is essential because as we have suggested, Giant Nuthatch has probably already been lost from two historical locations surveyed during this study, almost certainly due to degradation and fragmentation of its preferred habitat (see also Techachoochert et al. Reference Techachoochert, Gale, Khudamrongsawat and Round2018).
The remaining population of Giant Nuthatch in AMAM potentially represents 1–3% of the global population and is therefore a globally important locality for the conservation of the species (Donald et al. Reference Donald, Fishpool, Ajagbe, Bennun, Bunting, Burfield, Butchart, Capellan, Crosby, Dias, Diaz, Evans, Grimmett, Heath, Jones, Lascelles, Merriman, O´Brien, Ramirez, Waliczky and and Wege2019). The threats to this remaining forest patch should be assessed. Although human disturbance might not directly affect Giant Nuthatch, the main livelihood in AMAM is tea production which is directly correlated with the destruction and degradation of forests. Thus, there is an urgent need for a risk assessment regarding the remaining Giant Nuthatch habitat in AMAM.
Supplementary Material
To view supplementary material for this article, please visit https://doi.org/10.1017/S0959270920000672.
Acknowledgements
The authors would like to thank Kyaw Zar Linn, Township Officer of Pindaya Forest Department and all forestry officials and rangers from Taunggyi District Forest Department for accommodation and their help in the logistics of fieldwork. The authors are grateful to Ko Pan Kalaw and S. Gidean for kindly sharing information about the occurrence of Giant Nuthatch in Southern Shan State. The authors would also like to thank Tin Ko Oo, Lamin Ko Ko and Khant Min Maw for help with data collection. Thanks to Lunn Maung, Maung Ngwe and Maung Aye from Khan Taung Village for being kind hosts and assistance during fieldwork. The authors are also grateful to Supatchaya Techachoochert for kindly sharing information from her studies of Giant Nuthatch and also for her suggestions for the project. The authors would also like to thank Wyatt Petersen and Anucha Kamjing who helped with data analysis. Thanks also to Wanlop Chutipong and Zin Myo Thu for their support for this project implementation. We also thank Niti Sukumal, Daphawan Khamcha, Nay Myo Swe and Ngwe Lwin for their various suggestions for the project. This research was supported by the Rufford Foundation (Application ID: 26118-1).