1. Introduction
The explosive dispersal of granular media, driven by the detonation of a central high explosive (HE) or the sudden release of pressurised gases, transforms densely packed particle assemblies into dilute particle clouds. This phenomenon spans diverse natural and engineering systems. For instance, in volcanic eruptions, the explosive expansion of pressurised gases expels mixtures of gas and pyroclastic fragments through volcanic conduits (Narbona-Reina et al. Reference Narbona-Reina, Bresch, Burgisser and Collombet2024). In engineered systems, such as explosively dispersed dry-powder fire extinguishers (Haoyang & Du Reference Haoyang and Du2024), thermobaric weapons (Ritzel et al. Reference Ritzel, Ripley, Murray and Anderson1888; Türker Reference Türker2016) and fuel-air bombs (Zhang et al. Reference Zhang, Ripley, Yoshinaka, Findlay, Anderson and von Rosen2015; Bai et al. Reference Bai, Wang, Xue and Wang2018; Chen, Wang & Liu Reference Chen, Wang and Liu2020), the dispersal efficiency of granular media and subsequent mixing kinetics with ambient air are critical for reliable performance. Emergent structures, such as particle jets or clusters, govern mass and momentum transfer between particles and gases, ultimately determining the spatial distribution and concentration of the resulting aerosol cloud (Gregoire Reference Gregoire2012; Frost et al. Reference Frost, Grégoire, Petel, Goroshin and Zhang2012; Frost Reference Frost2018). Moreover, the formation of such structures signifies the emergence of multiphase flow instabilities. However, the governing mechanisms are not fully understood and are a subject of ongoing research (Milne et al. Reference Milne, Floyd, Longbottom and Taylor2014; Ripley & Zhang Reference Ripley and Zhang2014; Frost et al. Reference Frost, Loiseau, Goroshin, Fan, Milne and Longbottom2017; Koneru et al. Reference Koneru, Rollin, Durant, Ouellet and Balachandar2020; Miao, Li & Xue Reference Miao, Li and Xue2024). For instance, in strong blast regimes, studies have demonstrated that the jetting observed on a short time scale cannot be attributed to classical hydrodynamic instabilities, like the Richtmyer–Meshkov or Rayleigh–Taylor instability, which develop over longer periods (Milne et al. Reference Milne, Floyd, Longbottom and Taylor2014).
It has been widely observed that particle clusters or aggregates with characteristic dimensions orders of magnitude larger than individual particles are propelled outward during explosive dispersal in both strong blast loadings (Milne et al. Reference Milne, Floyd, Longbottom and Taylor2014; Frost et al. Reference Frost, Loiseau, Goroshin, Fan, Milne and Longbottom2017; Loiseau et al. Reference Loiseau, Pontalier, Milne, Goroshin and Frost2018; Pontalier et al. Reference Pontalier, Loiseau, Goroshin and Frost2018) induced by HEs as well as in the weak-shock impingement generated by the sudden release of central pressurised gases (Rodriguez et al. Reference Rodriguez, Saurel, Jourdan and Houas2013, Reference Rodriguez, Saurel, Jourdan and Houas2014, Reference Rodriguez, Saurel, Jourdan and Houas2017; Xue et al. Reference Xue, Du, Shi, Gan and Bai2018; Yoo, Kim & Kim Reference Yoo, Kim and Kim2025). In the strong blast scenario, the loading is sufficiently high that blast-compacted ductile powders, such as aluminium, can attain densities approaching that of solid aluminium (Borg & Vogler Reference Borg and Vogler2008; Borg & Vogler Reference Borg and Vogler2013). High-speed radiography (Frost et al. Reference Frost, Loiseau, Goroshin, Fan, Milne and Longbottom2017) reveals that jet initiation coincides with crack propagation within the compacted layer, initiated by the reflected tensile waves from the outer surface. This shell fragmentation theory also applies to brittle particulate systems like glass beads, which consolidate into compacts after undergoing severe blast-induced pulverisation and transiently behave as cohesive shells (Milne et al. Reference Milne, Floyd, Longbottom and Taylor2014). Notably, blast dispersal experiments often involve the detonation of an electric detonator, which produces extremely high local pressures and highly directional jets of detonation products that may well account for the observed particle jets (Ripley & Zhang Reference Ripley and Zhang2014).
By contrast, the explosive dispersal of particle rings confined in a horizontal Hele-Shaw cell and subjected to the sudden release of central pressurised gases constitutes a quasi-two-dimensional and axisymmetric configuration. This set-up excludes particle deformation, fracture and potential solidification due to markedly lower pressures (∼100–101 bar). Consequently, the dispersal structures arising from weak-shock impingement have been the focus of recent works. Rodriguez et al. reported both internal and external particle jets with distinct morphologies and wavelengths, finding that the number of internal jets increases with the shock wave Mach number. The evolution of this dual jetting was also quantified by Xue et al. (Reference Xue, Du, Shi, Gan and Bai2018), who proposed a quadratic growth law for external jets. Yoo et al. (Reference Yoo, Kim and Kim2025) further revealed the non-trivial role of particle cohesion and size on the morphology of the finger structure at the inner boundary.
For thin particle rings, internal jetting dominates the dispersal pattern, while external jetting defines the pattern for thick rings (Yoo et al. Reference Yoo, Kim and Kim2025). The finger-like internal jetting is often attributed to the Saffman–Taylor instability. As for the external particle jetting, many researchers (Balakrishnan Reference Balakrishnan2014; Osnes, Vartdal & BA Reference Osnes, Vartdal and Pettersson Reif2018; Chiapolino & Saurel Reference Chiapolino and Saurel2020; Koneru et al. Reference Koneru, Rollin, Durant, Ouellet and Balachandar2020) attribute this phenomenon to a shock-driven multiphase instability (SDMI) (Vorobieff et al. Reference Vorobieff, Anderson, Conroy, White, Truman and Kumar2011), analogous to the classical Richtmyer–Meshkov instability. In this framework, as the post-shock gases flow through particles, the reduction of gas velocity caused by particle–gas momentum exchange serves as the primary driver of SDMI. For sustained instability growth, the gas–particle velocity equilibration time scale (t
v
) must be smaller than or comparable to the characteristic hydrodynamic time scale (Duke-Walker et al. Reference Duke-Walker, Maxon, Almuhna and McFarland2021; Ouellet et al. Reference Ouellet, Rollin, Durant, Koneru and Balachandar2022). In dilute gas–particle flows, t
v
scales as the square of particle diameter multiplied by particle density, t
v
∝
 $d_{p}^{2}$
ρ
p
, implying that SDMI develops prominently only in systems laden with micron- or submicron-sized lightweight particles (Daniel & Wagner Reference Daniel and Wagner2022). Larger or denser particles lag significantly behind the carrier gas, thereby suppressing the instability’s growth. Furthermore, the predominance of dense gas–particle mixtures during the initial jet development phase precludes instantaneous momentum equilibrium (Demauro et al. Reference Demauro, Wagner, Dechant, Beresh and Turpin2019; Bajpai et al. Reference Bajpai, Wangikar, Tewari and Kumar2025), thereby limiting the applicability of the SDMI in the weak-shock regime.
Despite recent advances, the fundamental physics governing the formation of particle jets in explosive dispersal remains unclear. A particular challenge is predicting how the diversity of jetting patterns relates to the structural parameters of the dispersal system, especially under weak-shock conditions. To address this, we conduct a systematic numerical investigation across a broad parametric space. This work extends the framework of our prior studies (Xue et al. Reference Xue, Miu, Li, Bai and Tian2023; Miao et al. Reference Miao, Li and Xue2024), employing the same coarse-grained computational fluid dynamics–discrete parcel method (CFD-DPM) framework (Tian et al. Reference Tian, Zeng, Meng, Chen, Guo and Xue2020) and a prototypical annular particle shell configuration. This methodological consistency ensures the comparability of results and a reliable analysis of parametric effects.
While our previous research identified distinct global dispersal modes governed by multiscale gas–particle coupling, it did not resolve the internal structure of the dispersal cloud. Here, we shift focus to the underlying jetting morphology. We demonstrate that jet initiation and evolution are governed by a hierarchical interplay across the micro-, meso- and macro-scales. This insight allows us to establish physical criteria for jetting and introduce new dimensionless parameters that consolidate these cross-scale dynamics. These parameters enable the construction of a phase diagram for the jetting morphology in the weak-shock regime. Furthermore, we show that these critical parameters can be derived from a refined continuum model, enabling the a priori prediction of jetting patterns.
The paper is organised as follows: Section 2 details the numerical methods. Sections 3 and 4 analyse the transitions of jetting morphology, the governing dynamics, the proposed criteria and the predictive model. Section 5 concludes with a summary and broader implications.
2. Numerical method
2.1. Governing equations and numerical algorithm
Numerical simulations employ CCFD-DPM, a coarse-grained Euler–Lagrange numerical approach suitable for gas–particle flows in laboratory-scale systems (Tian et al. Reference Tian, Zeng, Meng, Chen, Guo and Xue2020). This method explicitly resolves parcel–parcel contact forces, where each computational parcel represents an ensemble of physical particles sharing identical physical and kinematic properties. The number of real particles per parcel is quantified by the super-particle loading factor, χ, determined by the particle volume fraction and computational constraints. For particle–gas systems, the reported χ in previous literature ranges from O(101) to O(103)(Osnes et al. Reference Osnes, Vartdal and Pettersson Reif2018; Koneru et al. Reference Koneru, Rollin, Durant, Ouellet and Balachandar2020). In the present work, χ is of the order of O(101).
The gas-phase dynamics is governed by volume-averaged Eulerian equations (2.1)–(2.3), derived from a simplified five-equation transport model based on the Baer–Nunziato (BN) model (Baer & Nunziato Reference Baer and Nunziato1986). This formulation extends the BN model to simulate compressible multiphase flows across dilute-to-dense gas–particle regimes
 \begin{align} &\qquad\qquad\qquad\frac{\partial \left(\phi _{\!f}\left\langle \rho _{\!f}\right\rangle \right)}{\partial t}+\boldsymbol{\nabla }\boldsymbol{\cdot }\left(\phi _{\!f}\left\langle \rho _{\!f}\right\rangle \tilde{\boldsymbol{u}}_{\!f}\right)=0 , \end{align}
 \begin{align} &\qquad\frac{\partial \left(\phi _{\!f}\tilde{\boldsymbol{u}}_{\!f}\left\langle \rho _{\!f}\right\rangle \right)}{\partial t}+\boldsymbol{\nabla }\boldsymbol{\cdot }\left(\phi _{\!f}\left\langle \rho _{\!f}\right\rangle \tilde{\boldsymbol{u}}_{\!f}\tilde{\boldsymbol{u}}_{\!f}+\phi _{\!f}\left\langle P_{\!f}\right\rangle \right) \nonumber\\&\qquad\quad =\left\langle P_{\!f}\right\rangle \boldsymbol{\nabla }\phi _{\!f} +\sum _{i}\left\{\phi _{p,i}\rho _{p,i}D_{p,i}\left(\tilde{\boldsymbol{u}}_{p,i}-\left(\tilde{\boldsymbol{u}}_{\!f}\right)_{i}\right)\right\} , \end{align}
 \begin{align} &\frac{\partial \left(\phi _{\!f}\left\langle \rho _{\!f}\right\rangle \tilde{E}_{\!f}\right)}{\partial t}+\boldsymbol{\nabla }\boldsymbol{\cdot }\left(\phi _{\!f}\left\langle \rho _{\!f}\right\rangle \tilde{E}_{\!f}\tilde{\boldsymbol{u}}_{\!f}+\phi _{\!f}\left\langle p_{\!f}\right\rangle \tilde{\boldsymbol{u}}_{\!f}\right) \nonumber\\&\quad =\left\langle P_{\!f}\right\rangle \boldsymbol{\nabla }\phi _{\!f}\boldsymbol{\cdot }\tilde{\boldsymbol{u}}_{p}+\sum _{i}\left\{\phi _{p,i}\rho _{p,i}D_{p,i}\left(\boldsymbol{u}_{{\kern-1pt}p,i}-\left(\tilde{\boldsymbol{u}}_{\!f}\right)_{i}\right)\boldsymbol{\cdot }\tilde{\boldsymbol{u}}_{p,i}\right\}. \end{align}
The gas-phase variables include the volume fraction (
 $\phi$
f
), density (ρ
f
), velocity (
u
f
), pressure (P
f
) and the total energy (E
f
), where E
f
= ρ
f
·e
f
+ 0.5 ρ
f
·
 $\boldsymbol{u}_{\mathit{f}}^{2}$
. In (2.1)–(2.3),
 $\langle \rangle$
and
 $\tilde{\,}$
denote phase-averaged and mass-averaged variables, respectively. For the particle phase, ρ
p.i
and
u
p,i
represent the density and velocity of parcel i, while D
p,i
is the drag force coefficient. The contribution of parcel i to the weighted particle volume fraction is defined as
 $\phi$
p.i
=
 $w$
i,f
V
p,i
/V
f
, where
 $w$
i,f
is the distributed weight of parcel i in fluid cell f, and V
p,i
and V
f
are the volumes of parcel and the fluid cell, respectively.
The drag coefficient D
p
is computed using the Di Felice model coupled with Ergun’s equation ((2.4)–(2.6)) (Di Felice Reference Di Felice1994), which accounts for the particle Reynold number (Re
p
) and the particle-phase volume fraction (
 $\phi$
p
) and has been widely used in particle-laden multiphase flows
 \begin{equation} D_{p}=0.75C_{d}{\textit{Re}}_{p}\phi _{\!f}^{1-\beta } ,\end{equation}
where C d is the drag coefficient proposed by Dallavalle
 \begin{equation} C_{d}=\left(0.63+\frac{4.8}{\sqrt{\phi _{\boldsymbol{f}}{\textit{Re}}_{p}}}\right)^{2} .\end{equation}
The exponent in (2.4) is not constant but a function of Re p
 \begin{equation}\beta =3.7-0.65\mathit{\exp } \left(-\frac{(1.5-\mathit{\lg } (\phi _{\!f}{\textit{Re}}_{p} ))^{2}}{2}\right)\!.\end{equation}
The continuous formulation of the Di Felice (Reference Di Felice1994) drag model ensures numerical stability across the wide range of solid volume fractions encountered during the transition from dense compaction to dilute dispersal. While more recent models derived from particle-resolved simulations offer refined correlations for specific configurations (Beetstra, Hoef & Kuipers Reference Beetstra, Hoef and Kuipers2007; Tenneti, Garg & Subramaniam Reference Tenneti, Garg and Subramaniam2011) and some incorporate finite Mach number effects and unsteady forces (Parmar, Haselbacher & Balachandar Reference Parmar, Haselbacher and Balachandar2009; Ling, Parmar & Balachandar Reference Ling, Parmar and Balachandar2013), they are, of necessity, regime-dependent. For the present weak-shock conditions, characterised by subsonic interstitial flows where Mach number corrections are negligible (Duke-Walker et al. Reference Duke-Walker, Maxon, Almuhna and McFarland2021) and there are high particle Reynolds numbers in the post-transient phase, the Di Felice model provides a well-established and physically sound representation of the quasi-steady drag force. This force is the dominant component governing the momentum exchange central to the jetting dynamics under investigation (Mehta et al. Reference Mehta, Neal, Salari, Jackson, Balachandar and Thakur2018; Osnes et al. Reference Osnes, Vartdal, Omang and Reif2020).
To ensure the applicability of the three-dimensional drag correlation in our two-dimensional simulation, the local two-dimensional porosity calculated from the disk assembly is converted to an equivalent three-dimensional porosity using an established geometric mapping (Zhang et al. Reference Zhang, Majmudar, Tordesillas and Behringer2010). This conversion is based on a linear interpolation between the theoretical maximum and minimum packing densities for mono-sized disks and spheres. The equivalent three-dimensional (3-D) porosity, φ 3-D, is calculated as follows:
 \begin{equation}\phi _{3-\text{D}}=0.2595+\frac{\phi _{2-\text{D}}-0.0931}{0.2146-0.0931}(0.4760-0.2595),\end{equation}
where the numerical constants correspond to the extreme packing states in two and three dimensions. This equivalent f 3-D is then used as the input for the Di Felice drag model. All particle-scale properties, such as mass and contact stiffness, are defined with consistent 2-D units.
The particle phase is modelled as discrete parcels governed by Newton’s second law ((2.8) and (2.9))
 \begin{align} \frac{\mathrm{d}u_{{\kern-1pt}p,i}}{\mathrm{d}t}&=D_{p,i}\left(\boldsymbol{u}_{\!f}-\boldsymbol{u}_{{\kern-1pt}p,i}\right)-\frac{1}{\rho _{p}}\boldsymbol{\nabla }\left\langle P_{\!f}\right\rangle +\frac{1}{m_{p}}\sum _{j}\boldsymbol{F}_{{\kern-1pt}C,\textit{ij}}, \end{align}
 \begin{align} \frac{\mathrm{d}x_{p,i}}{\mathrm{d}t}&=\boldsymbol{u}_{{\kern-1pt}p,i}, \end{align}
where u p,i and x p,i are the velocity and displacement of parcel i, respectively, and F C,ij represents the collision force between parcels i and j.
A four-way coupling scheme integrates the momentum and energy exchange between the gas and particle phases. The gas-phase momentum and energy equations include source terms from the particle drag force and the associated work. Conversely, parcels are influenced by the gas-phase pressure gradients, drag forces and inter-parcel collisions ((2.8)). Collision forces F C,ij are modelled using a linear-spring dashpot model, comprising a repulsive spring force and a velocity-proportional damping force
 \begin{equation}\boldsymbol{F}_{{\kern-1pt}C,\textit{ij}}=k_{n,p}\delta _{n}-\gamma _{n,p}\boldsymbol{u}_{n,\textit{ij}},\end{equation}
where k n,p and γ n,p are the stiffness and damping coefficients of the parcels, δ n is the overlap between colliding parcels and u n,ij is their relative normal velocity. The normal contact stiffness, k n,p , is not an arbitrary parameter but scales with the equivalent Young’s modulus, E*, under a plane-strain assumption
 \begin{equation}k_{n,p}=\frac{\pi }{4}E^{*}L,\end{equation}
where L is the thickness of the disks, taken as unity in our 2-D simulation. For two identical discs with Young’s modulus Y and Poisson’s ratio v, the equivalent Young’s modulus is given by
 $E^{\ast }={Y}/{1-v^{2}}$
. For the soda-lime glass spheres primarily simulated, we calculated k
n,p
based on Young’s modulus (78 GPa) and Poisson’s ratio (0.22).
The damping coefficient γ n,p is derived from the restitution coefficient ε p of the parcels
 \begin{equation}\gamma _{n,p}=-\frac{2\mathit{\ln } \varepsilon _{p}}{\sqrt{\pi ^{2}+\mathit{\ln } \varepsilon _{p}}}\sqrt{m_{p}k_{n,p}}.\end{equation}
The restitution coefficient, ε p , which governs energy dissipation during collisions, was set to 0.95. This value was calibrated to match the particle dispersion velocities predicted by the Gurney model and reference direct numerical simulation data (Zhang, Feng & Xue Reference Zhang, Feng and Xue2023).
The normal stiffness k n,p and restitution coefficient ε p are critical parameters governing the inter-particle momentum transfer and the resulting force-chain network. While the present study employs values calibrated for the specific materials under investigation, these micromechanical properties are known to significantly influence the macroscopic response, such as the propagation speed of the compaction front and the heterogeneity of the force network. The potential coupling between these contact properties and the observed jetting morphologies thus remains a compelling aspect for further exploration.
In the present simulations, the characteristic length of the fluid cells was maintained within a range of 1.5–2 times the particle diameter across all cases. This grid resolution has been demonstrated to be sufficient for capturing the dominant gas–particle coupling dynamics in similar dense, shock-driven flows (Miao et al. Reference Miao, Li and Xue2024; Han & Xue Reference Han and Xue2025).
The gas-phase governing equations are solved using weighted essentially no oscillatory scheme for spatial reconstruction of flow variables. Intercell fluxes are computed via the Harten–Lax–van Leer Riemann solver, and time integration is performed with a third-order Runge–Kutta method. Parcel trajectories are advanced using the velocity-Verlet algorithm, while bilinear or trilinear interpolation maps particle volume fractions, source terms and fluid variables between Eulerian grids and Lagrangian parcels (Liu, Osher & Chan Reference Liu, Osher and Chan1994). Further numerical details of the CCFD-DPM framework can be found in our prior works (Tian et al. Reference Tian, Zeng, Meng, Chen, Guo and Xue2020).
The CCFD-DPM framework has been rigorously validated against benchmark experiments involving shock-driven particle-laden flows (Tian et al. Reference Tian, Zeng, Meng, Chen, Guo and Xue2020), including shock dissipation through particle curtains (Rogue’s experiments) (Rogue et al. Reference Rogue, Rodriguez, Haas and Saurel1998), gas- and solid-phase pressure dynamics in shock-impinged particle columns (experiments performed by Britan and Ben-Dor) (Britan & Ben-Dor Reference Britan and Ben-Dor2006), shock-induced dispersion of thin particle curtains (shock tube experiments performed by Wagner et al.) (Wagner et al. Reference Wagner, Beresh, Kearney, Trott, Castaneda, Pruett and Baer2012; Han & Xue Reference Han and Xue2025) and the shock-induced interfacial instability of granular media (Xue et al. Reference Xue, Du, Shi, Gan and Bai2018). Notably the CCFD-DPM simulations reproduce the characteristic expanding velocity and finger-like jetting structures observed during explosive dispersal of granular materials (Xue et al. Reference Xue, Miu, Li, Bai and Tian2023), corroborating its capability to resolve multiphase interaction in high-speed, dense regimes.
2.2. Numerical set-up
The 2-D numerical configuration is illustrated in figure 1(a). A high-pressure gas pocket (initial pressure P 0, radius R gas ) is enclosed by a densely packed annular particle ring with initial inner and outer radii R in ,0 and R out ,0, respectively. The particle ring is populated with computational parcels generated via a radius expansion algorithm. Regions outside the particle ring and inter-particle pores (excluding the central gas pocket) are initialised with ambient air. To construct the particle assembly, an initial population of parcels with artificially reduced radii (to prevent overlap) is randomly distributed. These parcels are iteratively expanded until the target size distribution and packing fraction (φ 0) are achieved. Real particles have a diameter d p , while computational parcel diameters are uniformly distributed between 0.75 d p and 1.25 d p to suppress crystallisation during shock compaction. Parcels are arranged randomly yet homogeneously, as shown in the zoomed-in inset of figure 1(a), where colours represent the local Voronoi-based packing fraction (φ p,voro ). Each parcel retains the material density (ρ p ) of real particles.
(a) Two-dimensional numerical configuration of explosive dispersal of particle ring. (b)–(c) Distribution of numerical cases across the (E gas , M/C) (b) and (d p , r p ) (c) parameter spaces. Symbol sizes in (b) and (c) scale with the occurrence frequency of each (d p , r p ) combination across all numerical cases, key numerical cases are marked with star symbols, which correspond to the representative examples presented in detail within figures 3 and 4.

Prior studies indicate that macro- and microscale parameters jointly influence dispersal behaviour, albeit with varying significance (Miao et al. Reference Miao, Li and Xue2024). To decouple their effects on jetting morphology, over 140 numerical cases were simulated, spanning wide ranges of macro- and microscale parameters. Macroscale parameters include the gas pocket explosion energy E gas , approximated by using the Brode equation (Crowl Reference Crowl2003)
 \begin{equation}E_{\textit{gas}}=\frac{\left(P_{0}-P_{\textit{amb}}\right)V_{\textit{gas}}}{\gamma -1}=\frac{\pi \left(P_{0}-P_{\textit{amb}}\right)R_{\textit{gas}}^{2}}{\gamma -1},\end{equation}
where V gas is the gas pocket volume, P amb is the ambient pressure and γ is the specific heat ratio. The mass-to-charge ratio, M/C, is defined as
 \begin{equation}\frac{M}{C}=\frac{\pi\!\left(R_{out,0}^{2}-R_{in,0}^{2}\right)\phi _{0}\rho _{p}}{\pi R_{\textit{gas}}^{2}\rho _{\!f}}=\frac{\left(R_{out,0}^{2}-R_{in,0}^{2}\right)\phi _{0}\rho _{p}RT_{0}}{R_{\textit{gas}}^{2}P_{0}},\end{equation}
where ρ f is the gas density. Microscale parameters encompass particle diameter d p and material density ρ p . The distribution of cases across the (E gas , M/C) and (d p , ρ p ) parameter spaces is shown in figures 1(b) and 1(c), respectively. Symbol sizes in figures 1(b) and 1(c) scale with the occurrence frequency of each (d p , ρ p ) combination across all numerical cases.
As indicated in figure 1(b), M/C spans five orders of magnitude, from O(100) to O(104). Particle diameter d
p
ranges from O(101) to O(102) μm, while ρ
p
varies over two decades between minimum and maximum values. This broad parameter space enables systematic exploration of dispersal behaviour variability, which is challenging to achieve experimentally. Structural parameters for all cases are tabulated in table 1 (Appendix A. For clarity, each case is labeled as, M/C, -
 $\phi_{0}$
, -
 $d_{\!p}$
(in units of
 ${\unicode{x03BC}}$
m), -
 $\rho_{\!p}$
(in units of kg m−3)).
3. Results
3.1. Diverse jetting morphologies
Numerical simulations illustrate the complex dependence of jetting morphology on system parameters. Figure 2(a)–( f) shows a progressive transition across cases. Well-defined, thick branched jets dominate in case 1035-0.6-50-1828 (figure 2 a), transitioning to slender spikes with fuzzy tips in case 1035-0.6-100-2500 (figure 2 b) and further evolving into flimsy ligaments in case 1035-0.6-400-1828 (figure 2 c). Non-jetting patterns emerge in cases 1035-0.6-800-1828, 287-0.5-900-4167, 1014-0.5-400-1828 (figure 2 d–f), where dispersed particles form diffuse or cellular layers. This morphological transition manifests how the multiscale interplay of M/C, volume fraction (φ 0), ρ p and d p vary in the jetting dynamics.
Contours of jetting morphologies in different numerical cases: (a) 1035-0.6-50-1828, (b) 1035-0.6-100-2500, (c) 1035-0.6-400-1828, (d) 1035-0.6-800-1828, (e) 287-0.5-900-4167, ( f) 1014-0.5-400-1828.

Simulated r–t diagrams of φ p (r,t) in cases 1035-0.6-50-1828 (a), 1035-0.6-100-2500 (b), 1035-0.6-400-1828 (c), 1035-0.6-800-1828 (d), 287-0.5-900-4167 (e), 1014-0.5-400-1828 ( f). The superimposed trajectories are (from left to right): the inner surface of the cloud (R in ), inner and outer surfaces of the densely packed ring (R in,dense , R dense ) and outer surface of the cloud (R out ). The evaluating time for jetting, t eva , is marked by white circle symbols in R dense trajectories.

The simulated r–t diagrams of the circumferentially averaged particle volume fraction, φ p (r,t), reveal the dispersion process and jetting evolution, as illustrated in figure 3(a)–( f). Here, the inner and outer surfaces of particle clouds are defined by radii of R in and R out , respectively, such that only 5 % of particles reside inside R in or outside R out . The inner and outer boundaries of a densely packed annular region (φ p > 0.3) are identified by radii R in,dense and R dense , respectively. Beyond R out,dense particles either form jets or diffuse. The jet length is defined as l jet = R out - R dense . Temporal variations in R in , R out , R in,dense and R dense are overlaid on the φ p (r–t) diagrams.
Figure 3(a)–( f) exhibits a diverse dynamics of the particle ring, ranging from consistent expansion (figure 3 e), to retention following an initial expansion (figure 3 c,d, f) and persistent expansion–implosion cycles (figure 3 a,b). Notably, cases 1035-0.6-50-1828, 1035-0.6-100-2500 (figures 3 a and 3 b), which correspond to systems with the most prominent jetting patterns (see figures 2 a and 2 b), display strong cyclic behaviour. In contrast, jetting is significantly suppressed in case 1035-0.6-400-1828 (figure 2 c), where structures are reduced to flimsy filaments. Figure 3(d–f) corresponds to non-jetting systems characterised by monotonic expansion or an expansion–retention dynamics.
Notably, the parameter combination, rather than a single parameter, varies from case to case in figures 2 and 3. This choice is made to manifest the combined influences of the multitude of parameters, which collectively govern the multiscale gas–particle coupling processes that will be elaborated upon in § 3.5. To systematically discern the effect of individual parameters, a comparative analysis of cases where only one parameter is varied while others are held constant is provided in Appendix A.
Critically, the evolution of jetting patterns is not consistent with a monotonic progression in the particle dynamics. While correlations exist – such as enhanced jetting in systems with cyclic expansion–implosion – no explicit relationship is observed. For instance, jet suppression in case 1035-0.6-400-1828 (figure 2 c) occurs despite similarities in the particle retention dynamics to jetting systems (figure 3 c). This implies that jet formation depends on additional factors beyond bulk ring behaviour, such as microscale particle dynamics and mesoscale gas–particle coupling.
The growth of normalised jet length,
 $\hat{\mathit{l}}$
jet
,
 $\hat{\mathit{l}}$
jet
(t) = l
jet
(t)/R
dense
(t), for jetting systems 1035-0.6-50-1828 (a), 1035-0.6-100-2500 (b), 1035-0.6-400-1828 (c), alongside the normalised expansion velocity of densely packing ring
 $\hat{\mathit{V}}$
dense
(t),
 $\hat{\mathit{V}}$
dense
(t) = V
dense
(t)/ V
Gurney
, is shown in figure 4(a–c). It is worth noting that
 $\hat{\mathit{l}}$
jet
undergoes accelerated growth as
 $\hat{\mathit{V}}$
dense
decreases. The most prominent growth occurs during the implosion of the densely packed ring marked by
 $\hat{\mathit{V}}$
dense
< 0. Here,
 $\hat{\mathit{l}}$
jet
continues to grow until the ring collapses to its minimum radius with
 $\hat{\mathit{V}}$
dense
∼ 0. Subsequently,
 $\hat{\mathit{l}}$
jet
either exhibits semi-linear growth (if the dense ring stagnates, V
dense
∼ 0) (figure 4
c) or begins to slightly decay (if the ring undergoes a second expansion,
 $\hat{\mathit{V}}$
dense
> 0) (figure 4
b).
Temporal evolution of the normalised jet length,
 $\hat{\mathit{l}}$
jet
= l
jet
(t) / R
dense
(t), and normalised expansion velocity,
 $\hat{\mathit{V}}$
dense
= V
dense
(t)/ V
Gurney
for cases 1035-0.6-50-1828 (a), 1035-0.6-100-2500 (b), 1035-0.6-400-1828 (c). The
 $\hat{\mathit{l}}$
jet
(t) and
 $\hat{\mathit{V}}$
peak
(t) curves in (a) are annotated with two symbols marking the onset of decrease of
 $\hat{\mathit{V}}$
dense
and the initiation of ring implosion.

3.2. Characterisation of jetting intensity
To systematically evaluate jetting patterns across diverse explosive dispersal systems within a universal framework, a robust method for characterising jetting intensity is necessary. In this section, we propose a descriptor to quantify the significance of circumferential particle clustering relative to the entire dispersed particle population. Due to the rapid morphological evolution of the particle cloud, selecting an appropriate measurement time is critical. As shown in figure 2, dispersed particles exhibit three distinct states: (i) compacted in the densely packed ring; (ii) diffusing inside the cavity bounded by a dense ring; (iii) ejected as jets or diffuse structures. Particles in the third category – hereafter termed jetting particles – are defined as those occupying regions between radii of R dense and R out .
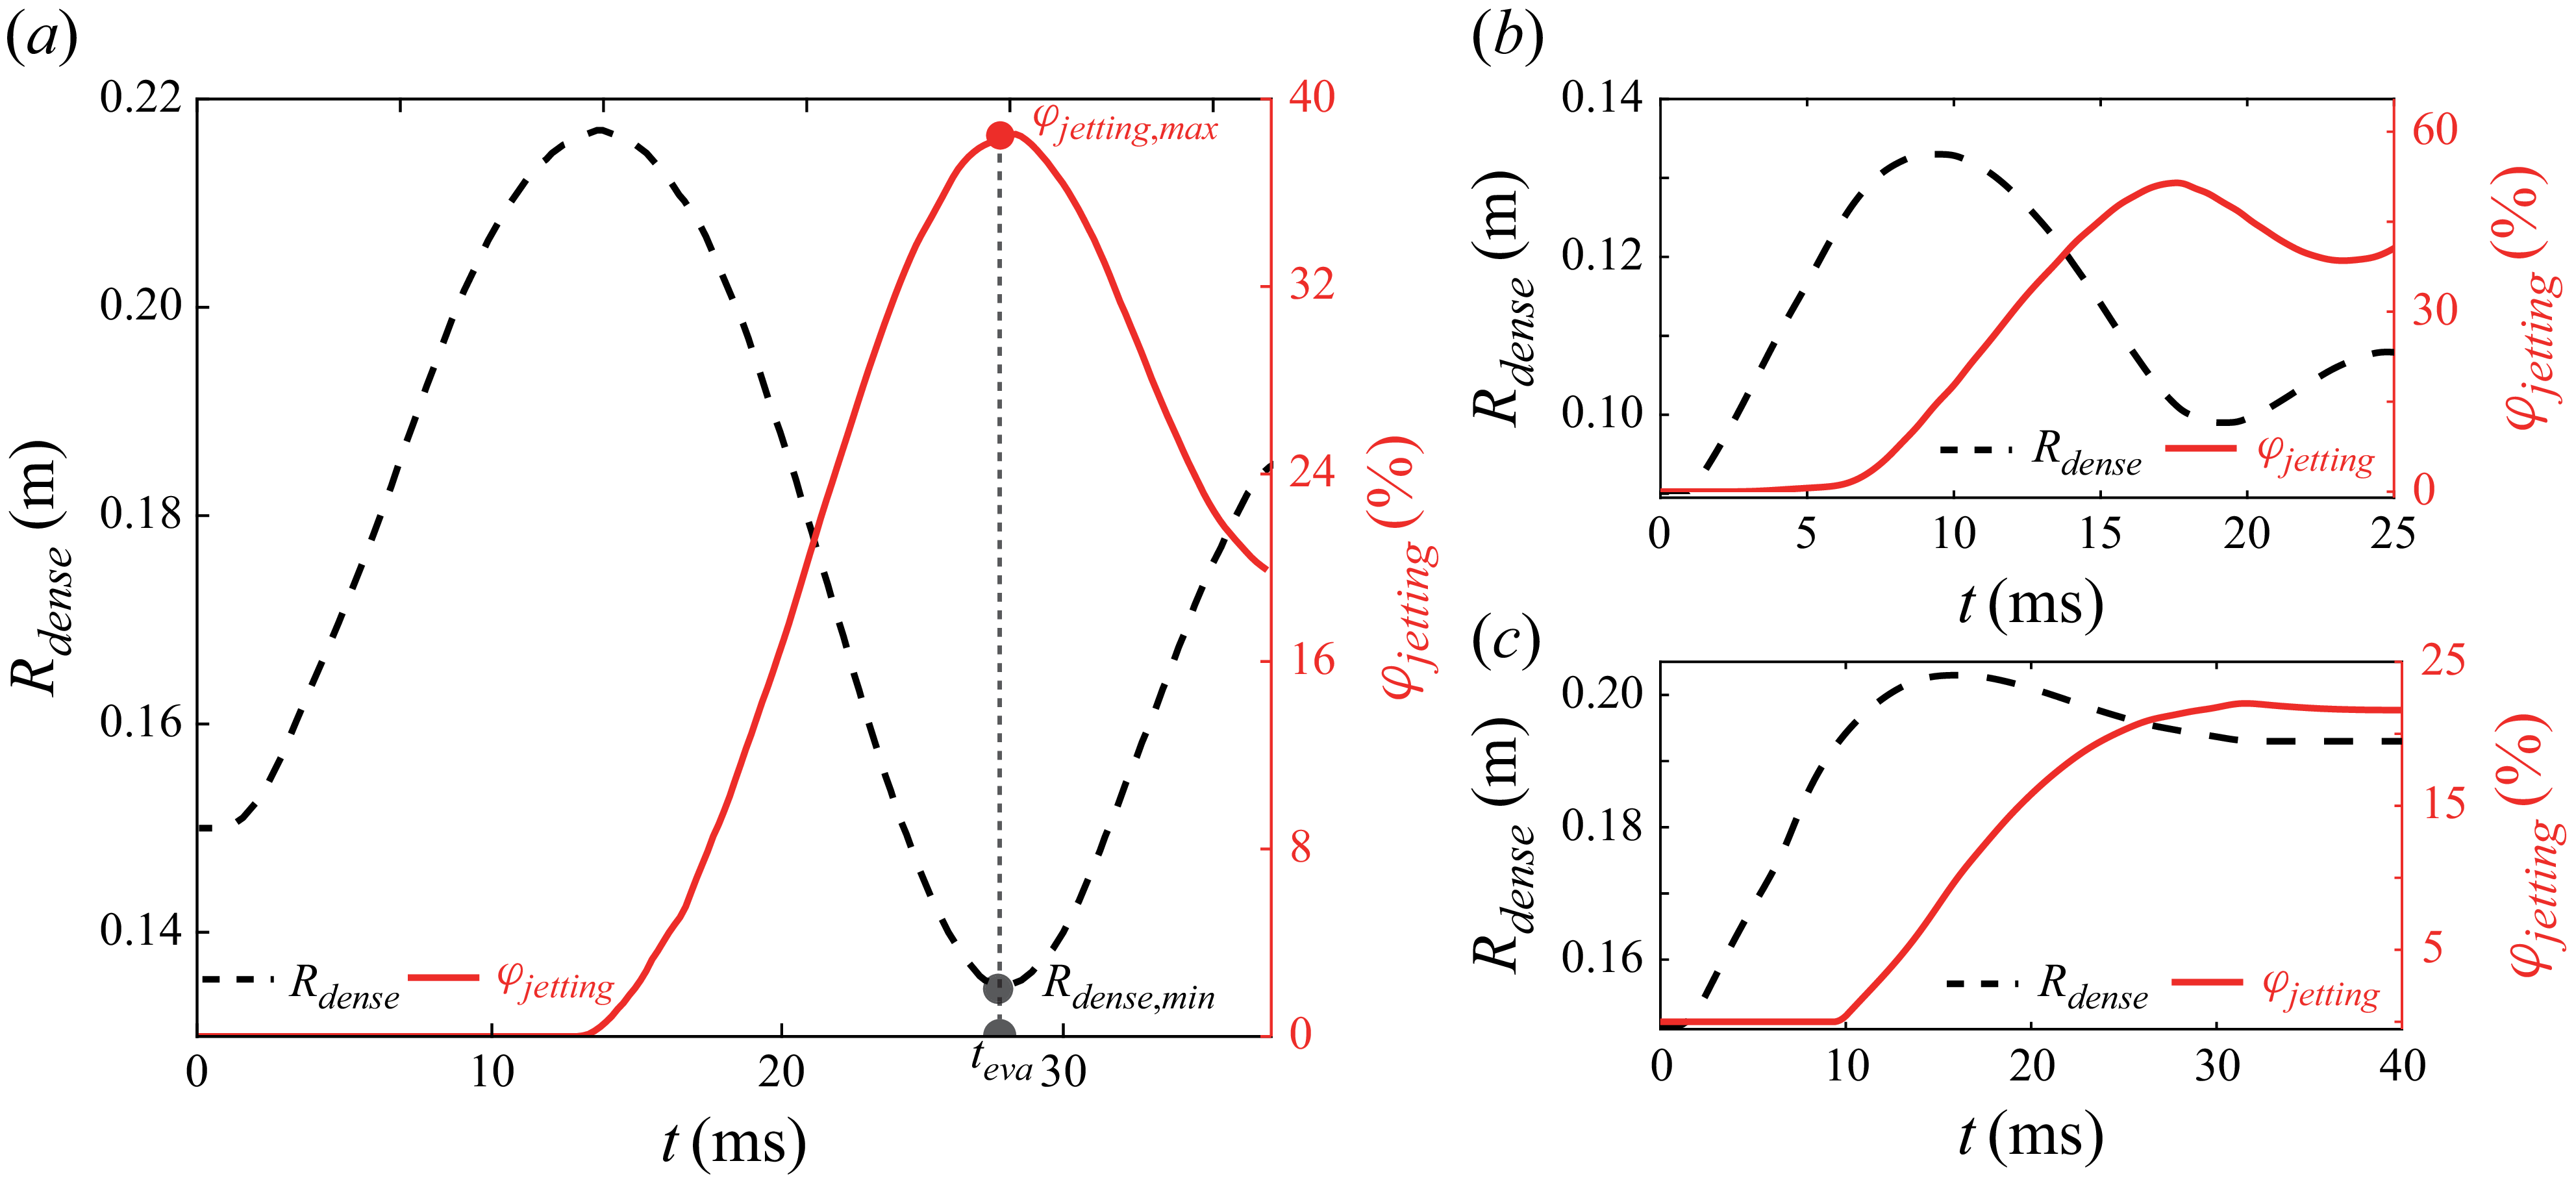
For systems where the particle ring undergoes ring retention following an initial expansion (cases1035-0.6-400-1828, 1035-0.6-800-1828, 1014-0.5-400-1828) or persistent expansion–implosion cycles (cases 1035-0.6-50-1828 and 1035-0.6-100-2500), the evaluation time teva is defined as the moment when the proportion of jetting particles, φ jettng , reaches its maximum. Figure 5 illustrates the relationship between φ jettng and R dense for cases 1035-0.6-50-1828 (a), 1035-0.6-100-2500 (b), 1035-0.6-400-1828 (c), where the densely packed rings persist. Here, φ jettng peaks when the rings collapse to their minimum radii. Subsequently, φ jettng stabilises if the ring stagnates (figure 5 c) or fluctuates synchronously with pulsations of the dense ring (figures 5 a and 5 b). Consequently, t eva corresponds to the time when R dense reaches its minimum after the initial expansion. For systems where the particle ring undergoes persistent expansion (case 287-0.5-900-4167), t eva is selected as the time when the ring expands to ten times its initial radius, R dense = 10 R out,0 . The selected t eva values are annotated in figure 3.
Temporal evolutions of φ jettng and R dense for cases 1035-0.6-50-1828 (a), 1035-0.6-100-2500 (b), 1035-0.6-400-1828 (c). The corresponding φ jettng,max and R dense,min are marked in (a).

Spatial distributions of φ p,voro of jetting particles within a one-eighth azimuthal sector (0 < a < π/4): (a) 1035-0.6-50-1828, (b) 1035-0.6-400-1828, (c)1035-0.6-800-1828; Horizontal dashed lines mark the outer boundary of densely packed rings (R dense ) in simulations.

To quantify particle clustering in the jetting region, we analyse Voronoi volume fractions (φ p,voro ) from simulations. Figure 6(a)–(c) displays the spatial distributions of φ p,voro for numerical cases (a) 1035–0.6-50–1828, (b) 1035–0.6-400–1828, (c) 1035–0.6-800–1828) of jetting particles within a one-eighth azimuthal sector (0 < a < π/4). Particles in jet stems exhibit elevated φ p,voro whereas those in diffuse inter-jet regions show significantly lower values.
Based on φ p,voro , the jetting intensity descriptor, ω jet , can be defined as
 \begin{equation} \omega _{jet}=\frac{\sqrt{\sum _{i=1}^{n}\left(\phi _{p,voro}^{i}-\phi _{p,\textit{min} }\right)^{2}/n}}{\phi _{p,\textit{min} }}\boldsymbol{\cdot }\varphi _{\textit{jetting}}\,\,\text{for simulations} ,\end{equation}
where
 $\mathit{\phi }_{\mathit{p}\mathit{,}\textit{voro}}^{\mathit{i}}$
represents the Voronoi volume fraction of the ith particle among n jetting particles for numerical cases The minima φ
p,min
correspond to particle-sparse gaps between jets. The first term in (3.1) quantifies the deviation of local packing density from gap regions, while the second term weights the significance of jetting particles relative to the entire dispersed population. It is important to note that ω
jet
is not designed to quantify the transient number or amplitude of individual jets. Instead, it integration over the jetting region characterises the fully realised jetting morphology, distinguishing systems where jetting is a dominant feature from those where it is suppressed or absent. The jetting intensity descriptor, ω
jet
, provides a holistic measure of the significance of circumferential clustering in the dispersed cloud.
Consistent with (3.1) the jetting intensity descriptor ω jet exhibits systematic trends across regimes. The value of ω jet declines from 8.8 (case 1035-0.6-50-1828) and 3.9 (case 1035-0.6-100-2500) in jetting-dominated systems to 2.0 (case 1035-0.6-400-1828) in transitional states, and ultimately to 0.24 (case 1035-0.6-800-1828), 0.02 (case 287-0.5-900-4167) and 0.015 (case 1014-0.5-400-1828) in non-jetting configurations.
A three orders of magnitude difference in ω jet distinguishes jetting (∼O(100)) from non-jetting (∼O(10−2)) systems, corroborating ω jet robustness in quantifying jetting intensity and discriminating dispersed structures. Full numerical results for ω jet are tabulated in table 1 in Appendix A.
The r–t diagrams of circumferentially averaged volume fraction φ p (a, c) and gas pressure P f , (b, d) in cases 1035-0.6-50-1828 (a, b) and 1035-0.5-400-1828 (c, d). Trajectories of the CF and PF are overlaid, which intersect with the outer surface of the ring at t CF and t PF .

3.3. Jet initiation: micro particle dynamics and meso-scale gas–particle coupling
As illustrated in figure 4, the pronounced growth of l jet in jetting systems correlates temporally with the onset of deceleration in the expanding particle ring, as quantified by R dense (t), thereby defining the jet initiation time t ini . This section examines the incubation phase preceding jet initiation, with the objective of identifying the governing mechanisms and the influence of structural parameters. A critical focus is on accounting for the absence of jet initiation in certain explosive dispersal systems.
Figures 7(a) and 7(b) display the r–t diagrams of circumferentially averaged volume fraction φ
p
and gas pressure P
f
, respectively, for a typical jetting system (case 1035-0.6-50-1828). Corresponding results for a non-jetting system (case 1035-0.5-400-1828) are shown in figures 7(c) and 7(d). Following the sudden release of high-pressure gases from the central cavity, a strong incident shock impinges on the inner surface of the particle ring, generating a radially outward-propagating compaction front (CF). This front delineates the compacted region (φ
p
=
 $f_{comp}$
) from the initially uncompacted region (φ
p
=
 $f_0$
). Concurrently, a diffusive pressure field develops, driven by the favourable radial pressure gradient (
 $\boldsymbol{\nabla} _{r}$
P
f
< 0) and advances outward, accompanied by progressively intensified gas filtration. The trajectory of the pressure front (PF) can be traced by the flow pressure field in systems where the gaseous velocity becomes non-zero after the arrival of the CF. Conversely, in systems where the gaseous velocity becomes non-zero before the CF arrives, the gaseous velocity field is used for this purpose. Further details are available in our previous work (Miao et al. Reference Miao, Li and Xue2024).
In case 1035-0.6-50-1828, the PF lags significantly behind the CF. The CF reflects from the ring’s outer surface at time t CF , generating an inward-propagating rarefaction wave (RW). In contrast, in case 1035-0.5-400-1828, the PF precedes the CF and reaches the outer surface much earlier. Here, interstitial gas flow behind the PF accelerates particles beyond the CF, resulting in particle velocities exceeding those in the compacted region. Consequently, the CF fails to reach the outer surface, t CF ∼ ∞, and an outer layer of entirely uncompacted particles detaches from the bulk compacted region (figure 3 f). Under these conditions, no RW forms.
Instead of exploring the particle shape effects on force-chain heterogeneity, here, we focus on the mitigating role of gas filtration. When gas filtration dominates, momentum is primarily imparted via interstitial gas flow rather than force chains. Circumferentially uniform gas flows, despite radial flow gradients, produce weaker and spatially sparse force chains, as shown in figure 8(b). The disparity in contact force statistics is evident from the histograms of
F
C
magnitudes (
 $| \boldsymbol{F}_{\kern-1pt\mathit{C}}|$
) for case 1035-0.6-100-2500 at t = t
CF
(figure 8
c) and case 1035-0.5-400-1828 at t = t
PF
(figure 8
d). Here,
 $| \boldsymbol{F}_{\mathit{C}}|$
denotes the magnitude of contact force per unit mass in order to account for amplifying effects arising from increased particle size. Although both distributions of
 $| \boldsymbol{F}_{\mathit{C}}|$
exhibit a left skewed unimodal peak spanning O(104) to O(106) in a log–linear coordinate, the number of effective contacts, n
p
, in case 1035-0.6-100-2500 is one order higher than that in case 1035-0.5-400-1828. Specifically, the mean magnitude of
F
C per particle, defined as |
 $\overline{\boldsymbol{F}}$
C
| =
 $\sum _{i=1}^{N}|\boldsymbol{F}_{{\kern-1pt}C,i}|/N_{p}$
(where N
p
is the total particle number), is |
 $\overline{\boldsymbol{F}}$
C
| = 3.5 × 10³ N kg−1 for case 1035-0.5-400-1828, two orders of magnitude smaller than that in case 1035-0.6-100-2500 (|
 $\overline{\boldsymbol{F}}$
C
| = 1.8 × 10⁵ N kg−1), manifesting the dominance of gas-mediated momentum transfer over force-chain networks.
(a), (b) Networks of force chains comprising inter-particle lines whose thickness scales with the absolute value of normalised contact forces
 $\hat{F}$
C
,
 $\hat{F}$
C
= (|F
C
|- |F
C,min
|)/(|F
C,max
| - |F
C,min
|): (a) case 1035-0.6-100-2500, (b) case 1035-0.5-400-1828. (c), (d) Histograms of contact force per unit mass
 $| \mathit{F}_{\mathit{C}}|$
for case 1035-0.6-100-2500 at t = t
CF
(c) and case 1035-0.5-400-1828 at t = t
PF
(d).

Particle velocity fields, u p (r,α), in one quarter sector of case 1035-0.6-100-2500 before (a) and after (b) the refection of the CF from the ring’s outer surface, and in 1035-0.5-400-1828 before (c) and after (b) the full development of gas filtration.

Circumferential variations in u p of jetting particles swept by the RW (a) and the corresponding Voronoi-based packing fraction (φ p,voro ) at initiation time (t ini ) (b) and at a later stage when jetting patterns are well developed (c) for case 1035-0.6-100-2500. Scatter points are coloured according to the respective radial coordinates.

The particle velocity fields, u p (r,α), exhibit spatial heterogeneities inherited from those of the force-chain networks. During the compaction phase in 1035-0.6-100-2500, the contour plot of u p (r,α) reveals pronounced mesoscale heterogeneity, characterised by localised clusters of particles with exceptionally high velocities (see figure 9 a). These heterogeneities persist and further amplify during the propagation of RW, evolving into coarser and stronger structures (see figure 9 b). Ejection of these high-velocity clusters from the outermost layers destabilises the ring’s outer surface, forming irregularities which act as jet precursors. In contrast, case 1035-0.5-400-1828 shows no significant circumferential heterogeneities in the u p (r,α) contour during compaction (see figure 9 c). A corrugated structure emerges only after full development of gas filtration (figure 9 d), most likely caused by the burst of localised high-pressure gas pockets generated at loosely packed regions (Sugiyama et al. Reference Sugiyama, Ando, Shimura and Matsuo2019).
The particle velocity fields (u p (r, α)) produce distinct dispersal structures which bear the imprints of their heterogeneity or homogeneity. Figure 10 compares circumferential variations in u p of jetting particles swept by the RW (figure 10 a) and the corresponding Voronoi-based packing fraction (φ p,voro ) at initiation time (t ini ) (figure 10 b) and at a later stage when jetting patterns are well developed (figure 10 c). Fluctuations in u p (α) exhibit strong alignment with φ p,voro (α) at two instants, with phase correlation coefficients of 0.93 (at t ini ) and 0.92 (at later stages). Hence, these mesoscale velocity field heterogeneities serve as precursors for subsequent jet formation.
Our prior study derived the propagation velocities of the CF (V CF ) and PF (V PF ) (Sugiyama et al. Reference Sugiyama, Ando, Shimura and Matsuo2019; Miao et al. Reference Miao, Li and Xue2024). For densely packed particle layers under steady upstream (P UI ) and downstream (P DI ) pressures, V CF is governed by
 \begin{equation}V_{\textit{CF}}=\sqrt{\frac{P_{\textit{UI}}-P_{\textit{DI}}}{\rho _{p}}\frac{\phi _{\textit{comp}}}{\left(\phi _{\textit{comp}}-\phi _{0}\right)\phi _{0}}},\end{equation}
where φ comp is the packing fraction in the compacted region. In our simulations, P DI = P amb (ambient pressure), and P UI = P f (gas pocket pressure). Equation (3.2) indicates that V CF increases with large ΔP = P f – P amb , lower ρ p and denser initial packing (larger φ 0 ).
The PF velocity V PF is expressed as
 \begin{equation}V_{\textit{PF}}=\frac{d_{p}^{2}}{150}\frac{\left(1-\phi _{0}\right)^{2}}{\mu \phi _{0}^{2}}\frac{P_{\!f}-P_{\textit{amb}}}{h_{\textit{ring}}},\end{equation}
where μ is the dynamic viscosity of interstitial gases, h
ring
= R
out,0
– R
in,0
is the initial ring thickness. Similar to V
CF
, V
PF
increases with larger pressure gradients. Unlike V
CF
, V
PF
increases with looser initial packing (smaller φ
0
), is independent of ρ
p
and scales with
 $\mathit{d}_{\mathit{p}}^{2}$
. For the cases 1035-0.6-50-1828 and 1035-0.5-400-1828, P
f
, ρ
p
and h
ring
are identical, but d
p
is eightfold larger in case 1035-0.5-400-1828, dramatically enhancing V
PF
. Substituting parameters into (3.2) and (3.3), we calculate V
CF
and V
PF
for both cases. For the case 1035-0.6-50-1828, V
CF
= 64.8 m s−1, exceeds V
PF
(V
PF
= 9.8 m s−1). Conversely, for the case 1035-0.5-400-1828, V
PF
= 92.6 m s−1 surpasses V
CF
(V
CF
= 13 m s−1). These theoretical predictions of V
CF
and V
PF
as a function of structural parameters successfully resolve the competition between shock compaction and gas filtration observed in the case 1035-0.6-50-1828 (compaction dominated) and 1035-0.5-400-1828 (filtration dominated).
3.4. Jet growth: macro-scale gas–particle coupling
During the jet growth phase, initial irregularities at the outer perimeter of the ring, first observed at t ini , evolve into well-defined jets. These jets exhibit substantial longitudinal growth and undergo frequent annihilation and coalescence during the early development phase, as illustrated by the structural evolution of jetting patterns shown in figure 11, where particles are coloured by corresponding Voronoi-based packing fraction φ p,voro (figure 11 a), radial component of the particle velocity u p,r (figure 11 b) and azimuthal component of the particle velocity u p,α (figure 11 c). Several fine jets coalesce into a coarser one at t = 12.9 ms.
Structural evolution of jetting patterns in one-eighth sector in case 1035-0.6-100-2500 where particles are coloured according to the Voronoi-based packing fraction φ p,voro (a), radial component of particle velocity u p,r (b) and azimuthal component of particle velocity u p,α (c). The solid curves delineate the jet boundaries and are defined such that particles outside have φ p,voro < 0.3.

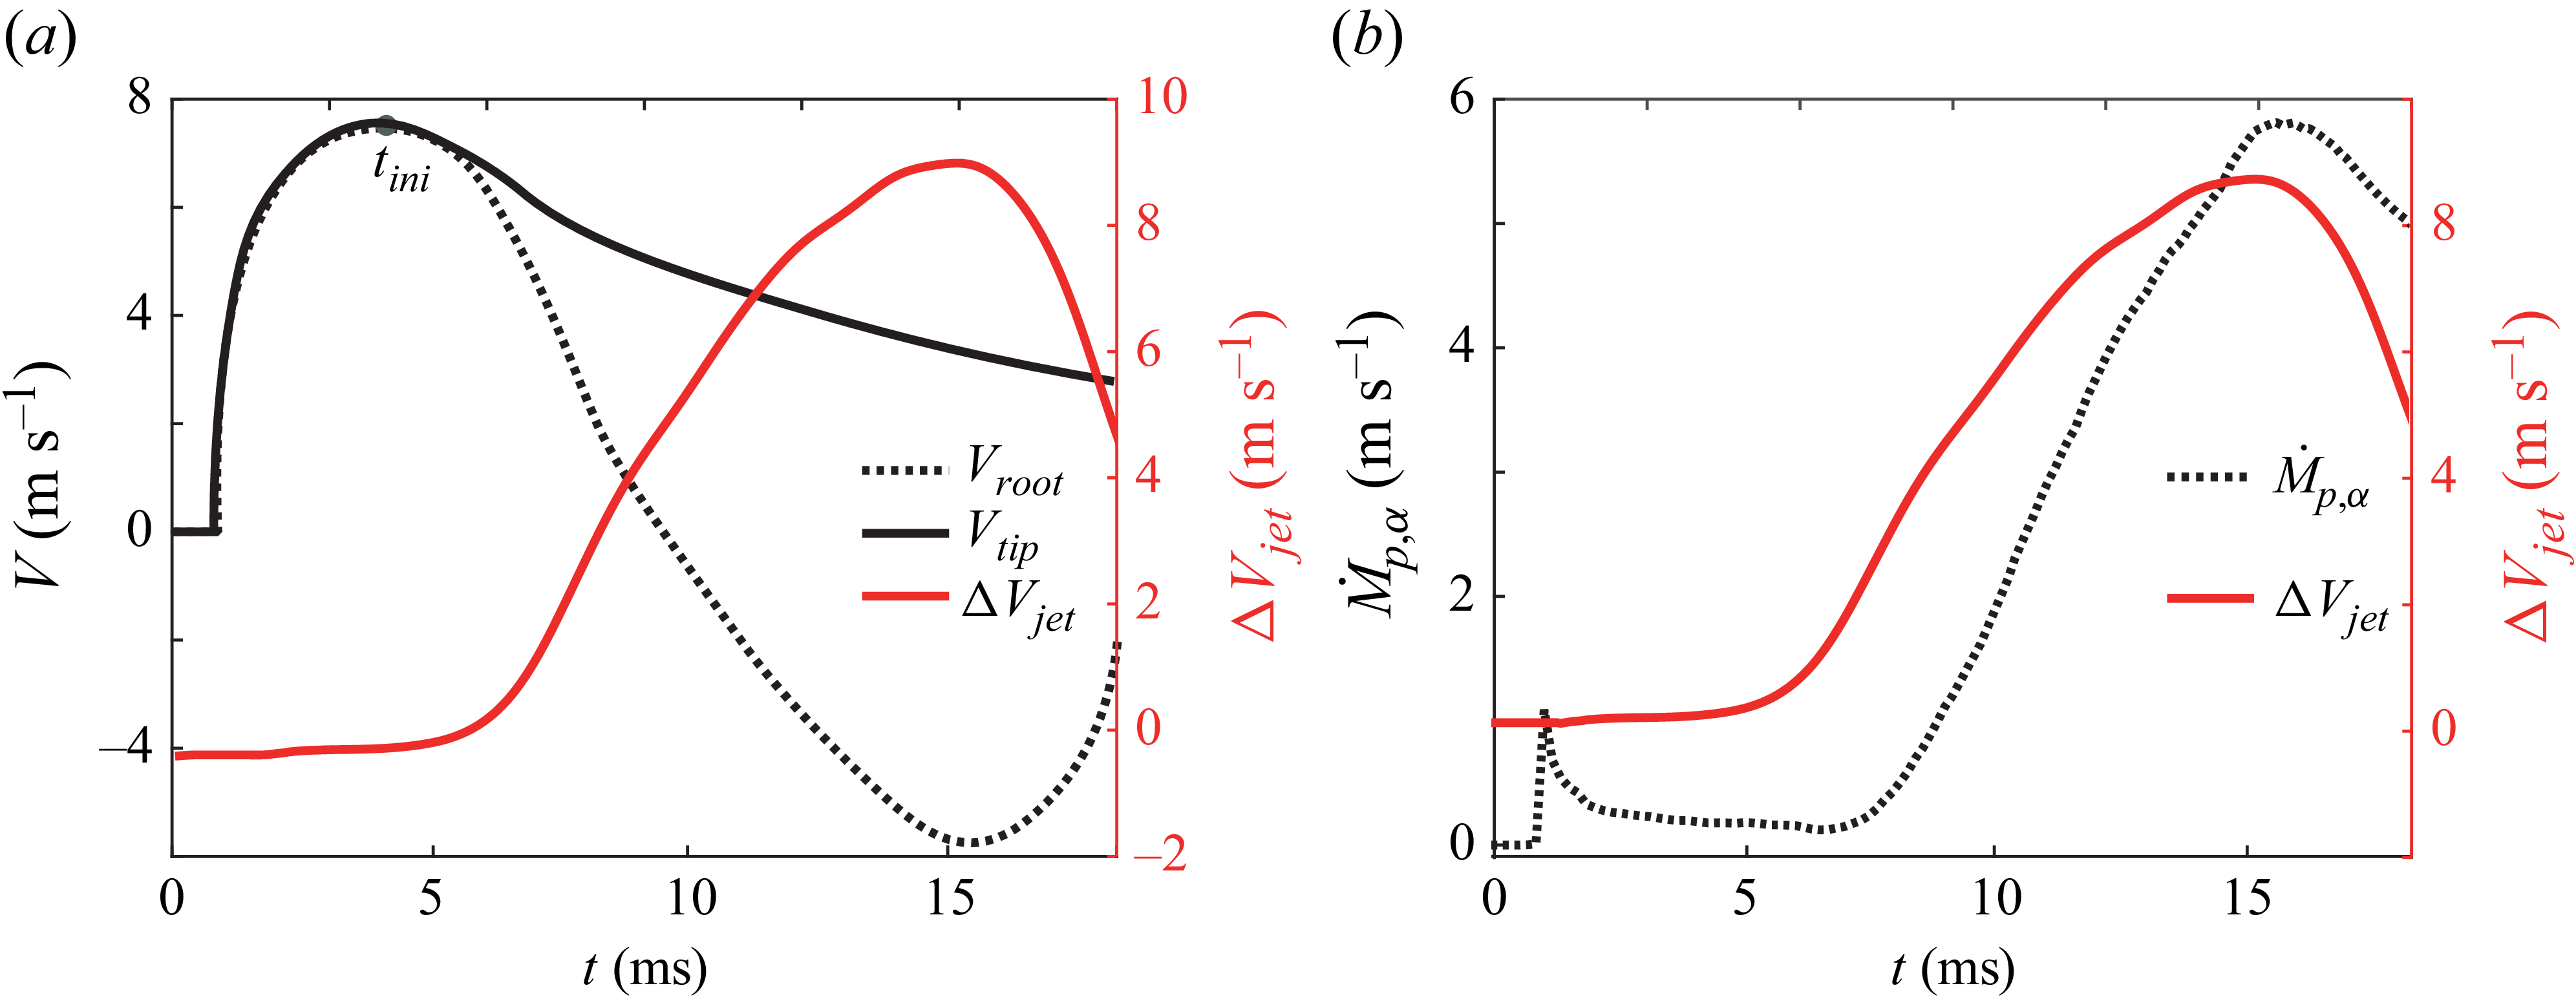
The longitudinal growth is driven by the velocity difference between the jet root (R root ∼ R dense ) and the jet tip (R tip ∼ R outer ). Defining V root and V tip as the average particle velocities at all jet roots and tips, respectively, the velocity difference ΔV jet = V tip - V root governs the elongation dynamics. Figure 12(a) illustrates the temporal evolution of V root and V tip , and ΔV jet for the case 1035-0.6-100-2500. Notably, V root decelerates starting at t = t ini , eventually reversing direction (becoming negative) due to inward suction forces generated during the ring’s implosion. In contrast V tip shows only gradual deceleration after t = t ini , remaining positive as it is slowed by drag from surrounding gases.
(a) Temporal variations in V
root
and V
tip
, and ΔV
jet
for the case 1035-0.6-100-2500. (b) Evolutions of cumulative circumferential particle mass flux (
 $\dot{\mathit{M}}_{\mathit{p}\mathit{,}\mathit{\alpha }}$
) and ΔV
jet
for the case 1035-0.6-100-2500.

Contours of radial and azimuthal components of gaseous pressure gradients,
 $\boldsymbol{\nabla} _{\mathit{r}}$
P
f
(a) and
 $\boldsymbol{\nabla} _{\alpha }$
P
f
(d), and radial and azimuthal components of particle velocities, u
p,r
(b) and u
p,α
(e). (c) Radial gas velocity (u
f,r
) contours spanning two adjacent jets at t = 6.2 ms (top) and 14.9 ms (bottom). Solid curves represent the jet boundaries. Dashed boxes in (d) and (e) indicate strong pressure gradient polarity and the resulting particle vortex formed in the ligament region between two adjacent jets. Dotted boxes in (d) and (e) indicate pressure gradient polarity and the resulting particle vortex spanning multiple fine jets, which are responsible for the jet coalescence or annihilation.

This divergence in behaviour originates from the spatially non-uniform distribution of the radial pressure gradient
 $\boldsymbol{\nabla} _{\mathit{r}}$
P
f
, as shown in figure 13(
a). Jet roots, embedded in the dense ring, experience strong adverse pressure gradients (
 $\boldsymbol{\nabla} _{\mathit{r}}$
P
f
> 0) when the internal pressure drops below the ambient external pressure. These gradients counter outward motion and drive deceleration of the jet roots. Conversely, the jet tips, characterised by a low packing fraction (figure 11
a), are exposed to negligible pressure gradients (
 $\boldsymbol{\nabla} _{\mathit{r}}$
P
f
∼ 0), resulting in minimal direct influence from pressure imbalance. Consequently, jet roots are highly sensitive to the time-varying pressure difference during the ring’s explosion–implosion cycles, while the outgoing tips remain largely decoupled from the bulk ring dynamics and are instead governed by drag forces from external gases.
Circumferential variations in the radial pressure gradient
 $\boldsymbol{\nabla} _{r}$
P
f
further modulate ΔV
jet
. As depicted in figure 13(a), ligamental regions (the areas between neighbouring jet roots) exhibit higher
 $\boldsymbol{\nabla} _{r}$
P
f
due to their thinner layers, driving stronger negative particle radial velocities (u
p,r
) (figure 13
b) that lead to concave morphologies. This results in an undulating dense ring structure, where thinner ligamental regions interconnect jet roots.
These spatially non-uniform pressure gradients also generate circumferential variations in gas flows. The radial gas velocity (u
f,r
) contours which display two adjacent jets (figure 13
c) reveal outward flow (u
f,r
> 0) under favourable pressure gradients until t
ini
, after which adverse pressure gradients become dominant. Gas flows near ligamental regions decelerate faster and reverse earlier due to intensified adverse
 $\boldsymbol{\nabla} _{r}$
P
f
, while flows through jets persist outward (bottom panel in figure 13
c), creating spatially dependent drag forces proportional to the local gas–particle velocity differences, Δu
p-f
= u
f
– u
p
. Particles in ligamental regions hence experience larger inward drag forces than those in jets, further amplifying ΔV
jet
.
The undulating ring perimeter induces circumferential pressure gradient
 $\boldsymbol{\nabla} _{\alpha }$
P
f
(figure 13
d). The opposing
 $\boldsymbol{\nabla} _{\alpha }$
P
f
polarities flanking coarse jet roots (dashed box in Figure13d) drive particles from adjacent ligamental regions toward jets, forming paired particle vortices. These vortices are visualised via the contour of the azimuthal component of particle velocities (u
p,α
) (figure 13
e). Regions spanning multiple fine jet roots (dotted box in figure 13
d) exhibit inverted
 $\boldsymbol{\nabla} _{\alpha }$
P
f
polarities, directing particle migration toward coarser jets and enabling jet coalescence or annihilation.
Post-coalescence, mature jets develop with intensified paired vortices at their roots (figure 11
c). As ligamental particles are entrained into jet roots, concavity deepens, further enhancing
 $\boldsymbol{\nabla} _{\alpha }$
P
f
and the particle vortex intensities (figure 11
c). Vortex intensity, quantified by the circumferential particle mass flux,
 $\dot{m}_{\mathit{p}\mathit{,}\mathit{\alpha }}$
(defined in Appendix B), has a cumulative value (
 $\dot{\mathit{M}}_{\mathit{p}\mathit{,}\mathit{\alpha }}$
) that correlates with ΔV
jet
, as shown in figure 12(b). Circumferential migration self-sustains until ring implosion halts and favourable pressure gradients resume.
The interplay between ring morphology, pressure gradients and gas flows initiates with the transition from favourable to adverse pressure gradients, triggering ring deceleration and implosion. In systems where rings expand until disintegration (the case 287-0.5-900-4167), adverse pressure gradients negligibly influence the ring, suppressing jet development despite precursor instabilities being abundant. Systems with early ring stagnation (e.g. cases 1035-0.6-400-1828, 1035-0.6-800-1828) exhibit muted jet patterns induced by diminished V root and limited particle migration.
3.5. Phase diagram of jetting morphology
Sections 3.3 and 3.4 present the multiscale physics governing the initiation and evolution of explosion-induced particle jets. Jet precursors originate from velocity heterogeneities in shock-compacted particles, mediated by momentum transfer through inter-particle contacts and interstitial gas flows. The mesoscale interplay between particle compaction and gas filtration determines the resultant particle velocity field. Compaction within the granular skeleton generates heterogeneous force-chain networks that drive spatial velocity variations, while interstitial gas flows propagating via diffusive pressure gradients impose homogeneous pressure gradient and drag forces that attenuate velocity fluctuations.
The relative dominance of particle compaction versus gas filtration is quantified by the ratio τ meso = t CF / t PF , where t CF (CF arrival time) and t PF (PF arrival time) characterise the respective time scales for mechanical and gas-dynamic processes to reach the ring’s outer surface, respectively. Smaller t CF amplifies localised heterogeneities as discussed in § 3.3, with τ meso in non-jetting systems exceeding jetting systems by several orders of magnitude.
Macroscale jet development, including longitudinal growth, annihilation and coalescence, emerges from the dynamic interaction between the evolving particle ring morphology, localised pressure gradients and gas flows. This mechanism activates only when adverse pressure gradients sufficiently decelerate and implode the ring. To quantify this coupling, we analyse the dense ring’s dynamics. The jet tip velocity V
tip
, approximated by the ring’s outer surface expansion velocity V
out
at t
ini
, inversely scales with the ring’s maximum radius R
dense,max
(marked with a yellow circle in figure 3
b). Jet elongation persists over the growth duration Δt
jet
, proportional to the implosion phase duration Δt
imp
, itself governed by the implosion amplitude Δ
 $\hat{\mathit{R}}$
imp
= (R
dense,max
-R
dense,min
)/ R
dense,max
, where R
dense,min
is the ring’s post-implosion minimum radius, R
dense,min
= R
dense
(t
eva
). Circumferential particle migration further enhances jetting, with a thicker compacted ring (thickness h
ring,comp
, the distance between R
dense
and R
in,dense
when R
dense
= R
dense,max
, marked with the yellow solid line in figure 3
b) sustaining stronger particle migration. Integrating these effects, we propose the dimensionless parameter, ξ
macro
, to characterise macroscale gas-particle coupling intensity
 \begin{equation}\xi _{\textit{macro}}=\frac{h_{\textit{ring},\textit{comp}}}{R_{\textit{dense},\textit{max}}}\frac{R_{\textit{dense},\textit{max}}-R_{\textit{dense},\textit{min}}}{R_{\textit{dense},\textit{max}}}.\end{equation}
Continuously expanding rings (R
dense,max
= R
dense,min
) yield Δ
 $\hat{\mathit{R}}$
imp
= 0 and ξ
macro
= 0, while rings stagnating post-implosion (R
dense,min
∼ R
dense,max
) exhibit low ξ
macro
. Calculated ξ
macro
for cases 1035-0.6-50-1828, 1035-0.6-100-2500, 1035-0.6-400-1828, 1035-0.6-800-1828, 287-0.5-900-4167 and 1014-0.5-400-1828, are 1.1 × 10⁻¹, 5.8 × 10⁻², 7.9 × 10⁻⁴, 8.1 × 10⁻⁴, 0, 7.0 × 10⁻⁴, respectively.
Figure 14 maps all numerical cases in the τ
meso
–ξ
macro
parameter space with symbols colour coded according to their ω
jet
values. Systems with τ
meso
≥ O(101) or
 $x_{macro}$
≤ O(10−3) exhibit negligible ω
jet
, classified as non-jetting due to absent precursors or insufficient driving forces. Beyond this regime, ω
jet
increases with decreasing τ
meso
and/or increasing ξ
macro
, peaking at ω
jet
∼ O(101), in regions where τ
meso
∼ O(10−1) and ξ
macro
∼ O(10−1), corresponding to prominent jetting structures. Intermediate systems exhibit suppressed jetting with ω
jet
rising gradually towards the jetting regime. Star symbols denote numerical cases from figures 2 and 3.
Distribution of all numerical cases in the τ meso –ξ macro parameter space with symbols colour coded according to their ω jet values. Star symbols denote numerical cases from figures 3 and 4, from top left to bottom right: 1014-0.5-400-1828, 287-0.5-900-4167, 1035-0.6-800-1828, 1035-0.6-400-1828, 1035-0.6-100-2500, 1035-0.6-50–1828.

This phase diagram consolidates macro- and microscale properties, including the M/C, explosion energy (P f ), geometric parameters (R gas , R in,0 , R out,0 ), initial packing fraction (φ 0 ), particle density (ρ p ) and size (d p ), into the dimensionless parameters τ meso and ξ macro , which encapsulate the multiscale physics of jet formation. Angular particles, however, introduce additional complexities to the jetting phase diagram. Force-chain networks in angular particle packings exhibit greater heterogeneity due to interlocking and friction (Seo et al. Reference Seo, Luscher, Scovel and Daphalapurkar2024), yielding coarser jet structures. Compaction dynamics and gas filtration also diverge from spherical systems, with potential contributions from particle fracture, asperity attrition and plastic deformation. Existing parameters τ meso and ξ macro inadequately account for these effects, necessitating further exploration of microscale processes to refine the jetting phase diagram.
Workflow diagram of the explosive dispersal model, illustrating iterative information exchange between submodels.

4. Discussion
As elaborated in § 3.5, the jetting morphology is governed by two dimensionless parameters, τ meso and ξ macro , which characterise the multiscale physics of jet initiation and growth, respectively. A primary challenge in utilising τ meso and ξ macro arises from their derivation, which requires comprehensive knowledge of coupled particle–gas dynamics spanning meso-, and macro-scales. Such dynamics is typically resolved via computationally intensive multiphase flow simulations, which treat granular phases as continuum/discrete media with resolved/unresolved particles and advanced coupling models (Sundaresan, Ozel & Kolehmainen Reference Sundaresan, Ozel and Kolehmainen2018; Zhao, Zhao & Luding Reference Zhao, Zhao and Luding2023). For 3-D explosive dispersal systems involving millions (or even billions) of particles, these simulations become prohibitively expensive.
To address this, we adopted a continuum-based explosive dispersal model, previously developed to integrate meso- and macro-scale gas–particle couplings (Miao et al. Reference Miao, Li and Xue2024) and updated with an advanced filtration model. This model reproduces critical processes such as shock-induced particle compaction, gas filtration and ring pulsation, enabling theoretical prediction of τ meso and ξ macro at modest computational cost. Consequently, the jetting regime for an arbitrary system can be properly determined.
The explosive dispersal model comprises three interconnected submodels: (i) submodel-1 governs the central gas dynamics and gas filtration through the granular medium; (ii) submodel-2 accounts for the shock-induced particle compaction driven by the diffusional pressure gradients and interphase drag forces; (iii) submodel-3 calculates pulsations of the incompressible compacted particle ring. Within this framework, particle rings are treated as porous media, with the propagation of the CF modelled via the momentum balance equation and jump conditions across the CF. Gases in the central pocket undergo adiabatic evolution, bounded by an expanding or imploding ring, while sustaining persistent gas filtration. The terminal state of submodel-2 (post-shock compaction) provides the initial conditions for submodel-3.
Figure 16 presents the workflow diagram of the explosive dispersal model, illustrating iterative data exchange between submodels. Compared with the original model (Miao et al. Reference Miao, Li and Xue2024), key modifications include a mixed-flow equation governing gas filtration, which incorporates inertial and viscous effects critical for high-speed flows (see Appendices III for governing equations). The model assumes circumferential uniformity in shock-compaction velocity fields, employing 1-D polar coordinates with radial distance as the sole spatial variable. Rarefaction effects, particle ejection and diffusion, as well as bulk breakaway, are neglected, and we focus instead on the densely packed particle ring bounded by radii of R in,dense and R dense .
Comparisons of predicted and simulated trajectories of inner/outer ring radii (ac),
 $\mathit{R}_{\mathit{\textit{in}}}^{\mathit{the}}$
(t) and
 $\mathit{R}_{\mathit{\textit{out}}}^{\mathit{the}}$
(t) vs
 $\mathit{R}_{\mathit{\textit{in}}}^{\mathit{num}}$
(t),
 $\mathit{R}_{\textit{dense}}^{\mathit{num}}$
(t), and compaction/pressure fronts (df),
 $\mathit{R}_{\mathit{\textit{CF}}}^{\mathit{the}}$
(t) and
 $\mathit{R}_{\mathit{\textit{PF}}}^{\mathit{the}}$
(t) vs
 $\mathit{R}_{\mathit{\textit{CF}}}^{\mathit{num}}$
(t) and
 $\mathit{R}_{\mathit{\textit{PF}}}^{\mathit{num}}$
(t). Panels (a) and (d) show case 1035-0.6-50-1828, (c) and (e) show case 287-0.5-900-4167 and (d) and ( f) show case 1035-0.6-400-1828.

Comparisons of predicted and simulated τ
meso
(a),
 $\tau _{\textit{meso}}^{\mathit{the}}$
vs
 $\tau _{\textit{meso}}^{\mathit{num}}$
, and x
macro
(b),
 $\xi _{\textit{macro}}^{\mathit{the}}$
vs
 $\xi _{\textit{macro}}^{\mathit{num}}$
. The coefficients of determination are 0.92 and 0.97, respectively.

Validation against numerical simulations (figure 16) reveals strong agreement for cases with intact particle rings (1035-0.6-50-1828, 1035-0.6-400-1828), where theoretical trajectories of inner/outer ring radii (
 $\mathit{R}_{\mathit{\textit{in}}}^{\mathit{the}}$
(t) and
 $\mathit{R}_{\mathit{\textit{out}}}^{\mathit{the}}$
(t)) and compaction/pressure fronts (
 $\mathit{R}_{\mathit{\textit{CF}}}^{\mathit{the}}$
(t) and
 $\mathit{R}_{\mathit{\textit{PF}}}^{\mathit{the}}$
(t)) agree well with numerical counterparts (
 $\mathit{R}_{\mathit{\textit{in}}}^{\mathit{num}}$
(t),
 $\mathit{R}_{\textit{dense}}^{\mathit{num}}$
(t),
 $\mathit{R}_{\mathit{\textit{CF}}}^{\mathit{num}}$
(t) and
 $\mathit{R}_{\mathit{\textit{PF}}}^{\mathit{num}}$
(t)). For the case 287-0.5-900-4167 involving a quite thin particle ring (h
ring,comp = 44 d
p) under high gas pressure, the model captures shock compaction and gas filtration but fails to predict ring disintegration, instead yielding unphysical high-amplitude pulsations. This discrepancy arises from the momentum-dominated dynamics in thin rings (h
ring,comp
/R
imp
→0), causing ξ
macro
→0, consistent with observed trend in ξ
macro
in systems exhibiting persistent expansion prior to disintegration.
Theoretical and numerical predictions of τ meso and ξ macro show strong consistencies (figures 17 a and 17 b), enabling construction of a jetting phase diagram within the τ meso –ξ macro parameter space. It is crucial to emphasise that this predictive framework is predicated on, and strictly applicable to, the weak-shock regime driven by pressurised gas expansion. This diagram provides a robust predictive framework for jetting morphologies under these specific conditions, integrating multiscale gas–particle couplings. However, the 1-D formulation neglects discrete particle effects, e.g. clustering, breakaway and 3-D phenomena, such as axial gas leakage and traverse particle migration. Experimental observations suggest angular particles amplify jet coarseness, which is most likely associated with enhanced heterogeneous force-chain networks (Seo et al. Reference Seo, Luscher, Scovel and Daphalapurkar2024). Hence, stochastic descriptors of shape and contact mechanics need to be taken into account to enhance fidelity to real granular systems. Future refinements must incorporate 3-D flow physics and validate against large-scale experiments with diverse geometries and confinement conditions, particularly for applications requiring jetting pattern control, such as blast mitigation or fuel–air mixing efficiency.
5. Conclusions
This study elucidates the multiscale physics governing explosion-induced particle jetting in the weak-shock regime through an integrated numerical, and theoretical approach. Our findings reveal that jet precursors emerge from the interplay between mesoscale gas filtration and microscale heterogeneities of force-chain networks formed during shock compaction. Subsequent macroscale ring implosion, driven by adverse pressure gradients, amplifies initial perturbations into coherent jet structures. By unifying the physics of jet initiation and growth, we consolidate the influence of micro- and macroscale parameters into two dimensionless quantities: τ meso , governing precursor formation, and ξ macro , dictating jet amplification. A phase diagram for gas-driven systems constructed in the τ meso –ξ macro space categorises jetting morphologies into three distinct regimes, namely non-jetting, suppressed jetting and prominent jetting. Finally, we propose a modified continuum-based explosive dispersal model that reproduces the critical dynamics while serving as a computationally efficient framework for jetting regime prediction.
Funding
This work was supported by the following funding sources:
-
(i) The National Natural Science Foundation of China (Joint Fund Project, Grant No. U2341243).
-
(ii) The State Key Laboratory of Explosion Science and Technology (Grant No. ZDKT23-01).
-
(iii) The Open Research Project of the National Key Laboratory of Computational Physics, Beijing Institute of Applied Physics and Computational Mathematics (Grant No. JK2024-06).
Declaration of interests
The authors report no conflicts of interest.
Appendix A. Numerical case parameters, parameter analysis and early-time dynamics
A.1. Details of parameters in each numerical case
For caption see next page.

A.2. Comparative analysis of single parameter
Table 1 presents the detailed parameters for each numerical case shown in figures 2(b) and 2(c), including the initial pressure and radius of the central gas pocket (P 0, R gas ), the initial inner radius, outer radius and packing fraction of the particle ring (R in,0 , R out,0 , f 0 ), as well as the particle diameter and density (d p , ρ p ). The combined effects of these parameters are illustrated in figures 3 and 4 and discussed in detail. To investigate the influence of individual parameters, this appendix conducts a comparative analysis by varying only one parameter while keeping the others constant.
Figure 18 shows the jetting morphologies in five cases where only P 0 is varied, while all other parameters remain the same (R gas = 20 mm, R in,0 = 40 mm, R out,0 = 90 mm, φ 0 = 0.6, d p = 100 μm, ρ p = 2500 kg m−3). From figures 18(a) to 18(d), as P 0 decreases from 60 to 20 bar, the number of finger-like protrusions remains nearly constant at approximately 9. However, as P 0 decreases, the mass ratio (M/C) increases from 692 to 2076, nearly tripling, resulting in less energy being imparted per unit mass of particles. As a result, a large portion of particles remains densely packed, and only a minimal fraction disperses outward. Consequently, lower φ jetting leads to a decrease in the jetting intensity indicator ω jet from 6.17 to 3.24. When P 0 is further reduced to 8 bar (figure 18 e), M/C increases to 5190, and the energy delivered to the particle ring becomes insufficient to drive significant ring expansion. Consequently, the amplitude of ring contraction is also significantly reduced, resulting in a very low macroscopic implosion intensity parameter ξ macro . Under these conditions, the initial protrusions neither merge nor elongate substantially, ultimately forming a larger number (14) of finer and shorter protrusions, characterised by a low jetting intensity (ω jet = 2.11).
Similar to the influence of decreasing P 0 , increasing R out,0 seems to contribute to thicker protrusions. Figure 19 shows the jetting morphologies in four cases where only R out,0 is varied, while all other parameters remain the same (P 0 = 20 bar, R gas = 20 mm, R in,0 = 40 mm, φ 0 = 0.6, d p = 100 μm, ρ p = 2500 kg m−3). Similarly, as R out,0 increases from 90 to 121 mm (figures 19 a to 19 c), the mass ratio (M/C) increases from 1035 to 2076, nearly doubling. Consequently, there is an increasing portion of particles staying in the densely packed region and fewer particles forming the particle jet in the jetting region. The number of finger-like protrusions increased marginally, from 9 to 10. As a result, ω jet decreased slightly from 3.99 to 3.79 (figure 19 a–c). However, as R out,0 further increases form 121 to 180 mm (figure 19 c–d), the mass ratio (M/C) increases from 2076 to 4903, in addition to the increasing thicker densely packed region, the number of finger-like protrusions also almost doubles, from 10 to 21. This dramatic change possibly can be attributed to the larger circumference at the particle ring’s outer interface (2π R out,0 ), which provides the physical space for more potential jet `seeds’ to exist.
Contours of jetting morphologies in case 140 (P 0 = 60 bar, M/C = 692) (a), case 138 (P 0 = 40 bar, M/C = 1038) (b), case 137 (P 0 = 27 bar, M/C = 1538) (c), case 112 (P 0 = 20 bar, M/C = 2076) (d), case 102 (P 0 = 8 bar, M/C = 5190) (e). Other parameters in (a)–(e) remain constant: R gas = 20 mm, R in,0 = 40 mm, R out,0 = 90 mm, φ 0 = 0.6, d p = 100 μm, ρ p = 2500 kg m−3.

Contours of jetting morphologies in case 119 (R out,0 = 90 mm, M/C = 1035) (a), case 123 (R out,0 = 106 mm, M/C = 1534) (b), case 112 (R out,0 = 121 mm, M/C = 2076) (c), case 135 (R out,0 = 180 mm, M/C = 4903) (d). Other parameters in (a)–(d) remain constant: P 0 = 20 bar, R gas = 20 mm, R in,0 = 40 mm, φ 0 = 0.6, d p = 100 μm, ρ p = 2500 kg m−3.

Contours of jetting morphologies in case 143 (d p = 50 μm, M/C = 1035) (a), case 100 (d p = 400 μm, M/C = 1035) (b), case 79 (d p = 600 μm, M/C = 1035) (c), case 67 (d p = 800 μm, M/C = 1035) (d). Other parameters in (a)–(d) remain constant: P 0 = 20 bar, R gas = 30 mm, R in,0 = 50 mm, R out,0 = 150 mm, φ 0 = 0.6, ρ p = 1828 kg m−3.

As shown in figures 18 and 19, P
0
and R
out,0
are more likely to alter the thickness, length and number of radial protrusions by influencing the development of jetting seeds development. However, prior to that, the jetting seeds is determined by particle properties, such as particle diameter and density. Figure 20 shows the jetting morphologies in four cases where only d
p
is varied, while all other parameters keep constant (P
0
= 20 bar, R
gas
= 20 mm, R
in,0
= 40 mm, R
out,0
= 150 mm, φ
0
= 0.6, ρ
p
= 2500 kg m−3).With d
p
increasing from 50 μm to
 $400\,\mathrm{mm}$
(figures 20
a to 20
b), jetting morphologies change from thick finger-like protrusions (figure 20
a) to a filamentary pattern (figure 20
b). When d
p
further increases to
 $600\,\mathrm{mm}$
(figure 20
c) and
 $800\,\mathrm{mm}$
(figure 20
d), particle jetting is further weakened, the filamentary structure is replaced by diffuse layers (figure 20
c–d). The value of ω
jet
for cases shown in figure 20(a–d) is 8.8, 2.01, 0.43 and 0.24, respectively.
Figure 21 shows the transition of jetting morphologies with ρ
p
. Cases shown in figure 21(a)–(c) hold ρ
p
at 1503 kg m−3, 2500 kg m−3, 4167 kg m−3, respectively, with other parameters kept the same (P
0
= 60 bar, R
gas
= 20 mm, R
in,0
= 40 mm, R
out,0
= 90 mm, φ
0
= 0.5, d
p
= 100 kg m−3). As shown in figure 21, the jetting morphologies are less sensitive to ρ
p
compared with d
p;
with ρ
p
increasing from 1503 to 2500, then to 4167 (figure 21
a–c), the jetting structure gets slimer, represented by the decrease of
 $\omega _{jet}$
from 1.61 to 1.44 then to 1.21.
Contours of jetting morphologies in case 94 (173-60-0.5-50-100-1503) (a), case 91 (287-60-0.5-50-100-2500) (b), case 90 (479-60-0.5-50-100-4167) (c).

It is noted that the above discussion is only valid under corresponding circumstances, as jetting morphologies are determined by the combined effects of all parameters. For example, a lower P 0 for cases with relatively small M/C ∼ O(101) might increase the amplitude of ring contraction by suppressing the fast expansion and collapsing of the particle ring. In such a situation, lower P 0 will contribute to more prominent particle jetting by increasing ξ macro . In contrast, for cases within relatively high M/C range (103), where the particle ring is able to decelerate and contract, lower P 0 will decrease the amplitude of ring expansion and contraction by lowering the momentum of the particle ring. In that case, lower P 0 will weaken particle jetting by decreasing ξ macro .
Simulated r–t diagrams of φ p (r,t), (a,d,g, j), gas pressure P f , (b,e,h,k) and particle velocity fields u p (r,α), ( f,i,l), in case 113 (a,b,c), case 35 (d,e, f), case 67 (g,h,i), case 12 ( j,k,l). The superimposed pink trajectories are (from left to right) the inner and outer surfaces of densely packed ring (R in,dense , R dense ), The superimposed white and blue trajectories denote, respectively, trajectories of the CF and PF.

A.3. Early-time dynamics of the particle ring
Section 3.3 detailed two distinct early-time dynamics of the particle ring with two cases. Here, the early-time dynamics of particle rings in more cases are presented to further demonstrate the correlation between the early-time dynamics of the particle ring and the competition between shock compaction and gas filtration. Figure 22 displays the spatial and time evolution of circumferentially averaged volume fraction φ p (a,d,g, j) and gas pressure (b,e,h,k) of four cases. For cases with CF faster than PF (case 113, case 35), the particle velocity fields u p (r,α) after the refection of CF from the ring’s outer surface is presented (c, f), while for cases having a CF slower than PF, the particle velocity fields u p (r,α) after the full development of gas filtration is shown (i, l). As shown in figure 22, particle velocity fields of cases where CF precedes PF exhibit prominent spatial heterogeneities inherited from force-chain networks. Such heterogeneities are characterised by localised clusters of high-velocity particles. These high-velocity particle clusters at the outermost layers of the particle ring are jet precursors of jetting structures. For cases where CF lags behind PF significantly (case 67, case 12), particles at the outermost layers are initially driven by the diffusion pressure field instead of inter-particle collision. This gas-mediated momentum transfer leads to particles with relatively uniform and low velocity at outliers.
Appendix B. The definition and calculation of
 $\dot{\boldsymbol{M}}_{\boldsymbol{p}{,}\boldsymbol{\alpha }}$

This appendix provides the formal definition and calculation methodology for the circumferential particle mass flux (
 $\dot{\boldsymbol{M}}_{\boldsymbol{p}{,}\boldsymbol{\alpha }}$
), a quantity that characterises the strength of particle migration in the circumferential direction. As illustrated in figure 23(a), the local circumferential velocity of particles is visualised, where positive velocities (red) denote rightward motion and negative velocities (blue) indicate leftward motion. The presence of opposing velocities across regions spanning multiple fine jets signifies particle migration toward the roots of the jets, a phenomenon that facilitates jet development. The strength of this circumferential migration is directly proportional to both the mass of the migrating particles and their annular velocity.
(a) Particle circumferential velocity fields, u p,α (r, α), and (b) circumferential distribution curve of the particle mass flux in one quarter sector in case 1035-0.6-100-2500. Positive velocities (red) denote rightward motion and negative velocities (blue) indicate leftward motion. From bottom to top, the two dashed lines in (a) denote the positions of the jet root (R root ) and the jet tip (R tip ), respectively.

To compute the circumferential particle mass flux within the jet region (R
root
< r
i
< R
tip
), the particle cloud region is circumferentially divided into N equal wedges with small enough circular thickness da. Every wedge is labelled by its circular coordinate α
i, and the mass flux within wedge α
i
,
 $\dot{\boldsymbol{m}}_{\boldsymbol{\alpha }{,}\boldsymbol{i}}$
, is expressed as
 \begin{equation}\dot{m}_{\alpha, i}=\sum _{i=1}^{n_{i}}m_{i}\left| u_{p,\alpha, i}\right|,\end{equation}
where m
i
is the mass of the ith particle, u
α,i
is the annular velocity of the ith particle. By evaluating the mass flux for each wedge, we obtain the circumferential distribution of the particle mass flux
 $\dot{\mathit{m}}_{\mathit{\alpha }\mathit{,}\mathit{i}}$
(α). Figure 23(b) illustrates the circumferential distribution curve of the particle mass flux for case 1035-0.6-100-2500. To obtain the total circumferential particle mass flux within the jet region,
 $\dot{\boldsymbol{M}}_{\boldsymbol{p}{,}\boldsymbol{\alpha }}$
, the summation is performed circumferentially.
Here,n i is the total number of particles within wedge α i (α i ≤ a < α i + dα, R root < r i < R tip )
 \begin{equation}\dot{M}_{p,\alpha }=\sum _{i=1}^{N}\dot{m}_{\alpha, i}=\sum _{i=1}^{N}\sum _{i=1}^{n_{i}}m_{\alpha, i}\left| u_{p,\alpha, i}\right|.\end{equation}
Appendix C. Full formulations of governing equations for theoretical model
C.1. Gas filtration and central gases’ evolution
The configuration of the archetype, as illustrated in figure 1(a), consists of a circular central gas pocket with an initial radius R in,0 . This pocket is filled with homogeneous static gases characterised by an initial pressure P 0 , temperature T 0 and density ρ centre,0 . These quantities are related through the ideal gas law
 \begin{equation}\rho _{\textit{centre},0}=\frac{P_{0}}{\overline{R}T_{0}},\end{equation}
where the specific gas constant is denoted by
 $\overline{\mathit{R}}$
= 288.7J kg−1 k−1. The enclosing ring, with initial inner and outer radii R
in,0
and R
out,0
, respectively, is composed of a compressible porous medium with an initial porosity ε
0
and solid phase density ρ
solid
.
During the shock compaction and subsequent ring pulsation phases, gases in the central gas pocket are allowed to flow outward (when the central pressure is positive) or inward (when the central pressure is negative) due to inter-pore gas filtration. This process is governed by the Forchheimer equation
 \begin{equation}\frac{\mathrm{d}P_{\textit{gas}}}{\mathrm{d}r}=-\frac{\mu }{k}\varepsilon \left(u_{\textit{gas}}-u_{\textit{solid}}\right)-\beta \rho _{\mathrm{gas}}\left(u_{\textit{gas}}-u_{\textit{solid}}\right)\left| u_{\textit{gas}}-u_{\textit{solid}}\right|.\end{equation}
-
(i) P gas is the gas pressure;
-
(ii) u solid and u gas are the velocities of the solid and gas phases, respectively;
-
(iii) ε is the local porosity;
-
(iv) μ is the dynamic viscosity of the interstitial gases;
-
(v) k is the permeability, which is a function of the local porosity ε and particle radii d p , as described by the Ergun expression
 \begin{equation}k=\frac{1}{150}\frac{\varepsilon ^{3}}{\left(1-\varepsilon \right)^{2}}d_{p}^{2}.\end{equation}
-
(i) The parameter
$\beta$
is the inertial resistance coefficient.

 \begin{equation}\beta =1.8\frac{1-\varepsilon }{\varepsilon }\frac{1}{d_{p}}.\end{equation}
The diffusional pressure field, P gas , is governed by the Morrison equation in polar coordinates
 \begin{equation}\frac{\partial \left(\varepsilon P_{\textit{gas}}\right)}{\partial t}=-\frac{\partial \left[\varepsilon (u_{\textit{gas}}-u_{\textit{solid}})P_{\textit{gas}}r\right]}{r\partial r}.\end{equation}
The boundary conditions for (C5) are set by the pressures on the inner and outer surfaces of the ring: P gas (R in ) = P centre and P gas (R out ) = P amb . Here, P centre is the gas pressure within the central gas pocket.
The mass loss or gain rate of the central gases depends on the gas velocity at the inner surface of the ring relative to the moving inner surface
 \begin{equation}\dot{m}_{\textit{gas}}\left(t\right)=2\pi R_{\textit{in}}\boldsymbol{\cdot }\rho _{\textit{gas}}\left(R_{\textit{in}}\right)\boldsymbol{\cdot }\left[u_{\textit{gas}}\left(R_{\textit{in}}\right)-V_{\textit{in}}\right]\boldsymbol{\cdot }\varepsilon \left(R_{\textit{in}}\right),\end{equation}
where V in is the expansion velocity of the inner surface, V in = u solid (R in ). The instantaneous mass retained inside the central gas pocket is given by
 \begin{equation}m_{\textit{gas}}\left(t\right)=m_{gas,0}-\int _{0}^{t}\dot{m}_{\textit{gas}}\mathrm{d}t,\end{equation}
where m gas,0 = πR 2 in,0 ·ρ centre,0 is the initial mass of the central gases. The cumulative mass flux, combined with the volumetric variation of the central gas pocket due to ring expansion or implosion, leads to the density evolution of the central gases
 \begin{align}\rho _{\textit{centre}}&=\frac{{R^{2}}_{in,0}}{{R^{2}}_{\textit{in}}}\rho _{\textit{centre},0}-\int _{0}^{t}\frac{2\rho _{\textit{gas}}\left(R_{\textit{in}}\right)}{R_{\textit{in}}}\boldsymbol{\cdot }\left[u_{\textit{gas}}\left(R_{\textit{in}}\right)-V_{\textit{in}}\right]\boldsymbol{\cdot }\varepsilon \left(R_{\textit{in}}\right)\mathrm{d}t \nonumber\\& =\frac{{R^{2}}_{in,0}}{{R^{2}}_{\textit{in}}}\rho _{\textit{centre},0}+\int _{0}^{t}\frac{2\rho _{\textit{gas}}\left(R_{\textit{in}}\right)}{R_{\textit{in}}}\boldsymbol{\cdot }\frac{k}{\mu }\boldsymbol{\nabla }P_{{R_{\textit{in}}}}\mathrm{d}t.\end{align}
Assuming an isentropic expansion for the central gases, we obtain
 \begin{equation}\frac{P_{\textit{centre}}}{\rho _{\textit{centre}}^{\gamma }}=\frac{P_{0}}{\rho _{\textit{centre},0}^{\gamma }},\end{equation}
where γ is the specific heat ratio, γ = 1.4. Substituting (C1) and (C8) into (C9) yields the instantaneous central pressure, which also acts as the pressure on the inner surface of the ring: P gas (R in ) = P centre
 \begin{equation}P_{\textit{gas}}\left(R_{\textit{in}}\right)=P_{\textit{centre}}=\frac{\overline{R}^{\gamma }T_{0}^{\gamma }}{P_{0}^{\gamma -1}}\boldsymbol{\cdot }\left[\frac{{R^{2}}_{in,0}}{{R^{2}}_{\textit{in}}}\frac{P_{0}}{\overline{R}T_{0}}+\int _{0}^{t}\frac{2\rho _{\textit{gas}}\left(R_{\textit{in}}\right)}{R_{\textit{in}}}\boldsymbol{\cdot }\frac{k}{\mu }\boldsymbol{\nabla }P_{{R_{\textit{in}}}}\mathrm{d}t\right]^{\gamma }.\end{equation}
As seen in (C10), the P centre depends on both the ring dynamics and gas filtration. The former dictates the volumetric variation of the central gas pocket via R in and ε. while the latter involves dynamic flow parameters such as u gas (R in ) and ρ gas (R in ).
Since the evolutions of the central gases (C10), gas filtration (C2), the diffusional pressure field (C5) and the ring dynamics are coupled, their governing equations must be solved simultaneously.
C.2. Shock-compaction submodel
Upon the release of the pressurised central gases, a diffusional pressure field develops across the ring thickness and propagates outward, as shown in figure 24(a). Simultaneously, interstitial gases begin to flow, driven by the diffusional pressure field. The solid phase of the ring, immersed in this advancing pressure field, is subjected to an outward pressure gradient force
 $\mathit{F}_{{\boldsymbol{\nabla} _{\mathit{P}}}}$
and an associated drag force F
drag
, both of which scale with the local pressure gradient
 \begin{align}&\qquad\qquad F_{\boldsymbol{\nabla }P}=-\frac{{\rm d}P_{\textit{gas}}/{\rm d}r}{\rho _{\textit{solid}}}, \end{align}
 \begin{align}& F_{\textit{drag}}=\frac{\varepsilon }{1-\varepsilon }F_{\boldsymbol{\nabla }P}=-\frac{\varepsilon }{1-\varepsilon }\frac{{\rm d}P_{\textit{gas}}/{\rm d}r}{\rho _{\textit{solid}}}. \end{align}
Schematics of configuration considered in the theoretical model. (a) A CF has a finite thickness of
 $w$
CF
across which the porosity ε and solid velocity u
solid
gradually decrease. (b) Propagation of the CF with a velocity of V
CF
driven by the
 $\mathit{F}_{{\boldsymbol{\nabla} _{\mathit{P}}}}$
and F
drag
. The radial profiles of ε (r), u
solid
(r),
 $\mathit{F}_{{\boldsymbol{\nabla} _{\mathit{P}}}}$
(r) and F
drag
(r) are superimposed in the plots.

These forces compact the solid skeleton into a compacted band with a minimum porosity ε
min
= 0.3. The compacted band extends from the inner surface of the ring to a CF, as illustrated in figure 24(a). Ahead of the CF, a transitional zone with a finite thickness
 $w$
CF
∼ 10d
p
exists, across which 1-ε and u
solid
gradually decrease from 1-ε
min
and u
solid
(R
CF
) to 1-ε
0
and zero, respectively. To approximate the variations in ε and u
solid
within the transitional zone, a Gauss error function is employed
 \begin{align} &\varepsilon \left(r\right)=1-\frac{\varepsilon _{\textit{min} }+\varepsilon _{0}}{2}+\frac{\varepsilon _{\textit{min} }-\varepsilon _{0}}{2}\boldsymbol{\cdot }erf\left(4\frac{r-R_{\textit{CF}}}{w_{\textit{CF}}}\right), R_{\textit{CF}}\leq r\leq R_{\textit{CF}}+w_{\textit{CF}} , \end{align}
 \begin{align} &\quad u_{\textit{solid}}\left(r\right)=\frac{u_{\textit{solid},\textit{CF}}}{2}-\frac{u_{\textit{solid},\textit{CF}}}{2}\boldsymbol{\cdot }erf\left(4\frac{r-R_{\textit{CF}}}{w_{\textit{CF}}}\right),\,R_{\textit{CF}}\leq r\leq R_{\textit{CF}}+w_{\textit{CF}} , \end{align}
 \begin{align} &\qquad \qquad \qquad \qquad \qquad \textit{erf}\left(x\right)=\frac{2}{\sqrt{\pi }}\int _{0}^{x}e^{-{\eta ^{2}}}\mathrm{d}\eta, \end{align}
where u solid,CF = u solid (R CF ). The profiles of ε(r) and u solid (r) described by (C13) and (C14) agree well with numerically derived profiles, as shown in figure 24(a).
The momentum balance of the annular compacted band, as demonstrated in figure 24(b), is given by
 \begin{align} \rho _{\textit{solid}}\left(1-\varepsilon _{\textit{min} }\right)\int _{R_{\textit{in}}}^{R_{\textit{CF}}}\dot{u}_{\textit{solid}}\left(r\right)r{\rm d}r&=-\rho _{\textit{solid}}\left(1-\varepsilon _{0}\right)u_{\textit{solid},\textit{CF}}V_{\textit{CF}}R_{\textit{CF}}\nonumber\\&\quad +\rho _{\textit{solid}}\left(1-\varepsilon _{\textit{min} }\right)\int _{R_{\textit{in}}}^{R_{\textit{CF}}}F_{\boldsymbol{\nabla }P}r{\rm d}r\nonumber\\&\quad +\rho _{\textit{solid}}\left(1-\varepsilon _{\textit{min} }\right)\int _{R_{\textit{in}}}^{R_{\textit{CF}}}F_{\textit{drag}}r{\rm d}r, \end{align}
where
 $\dot{\mathit{u}}_{\textit{solid}}$
denotes the acceleration of the solid phase. The first term on the right-hand side of (C16) accounts for the increase in mass within the compacted band. The second and third terms on the right-hand side represent the total pressure gradient force and the total drag force, respectively, acting on the compacted band per unit cross-sectional area. The mass conservation of the incompressible compacted band requires that u
solid
is proportional to 1/r
 \begin{equation} u_{\textit{solid}}\left(r\right)=\frac{V_{\textit{in}}R_{\textit{in}}}{r},R_{\textit{in}}\leq r\leq R_{\textit{CF}}. \end{equation}
Differentiating (C17) yields the acceleration of the solid phase
 \begin{equation} \dot{u}_{\textit{solid}}\left(r\right)=\frac{\dot{V}_{\textit{in}}R_{\textit{in}}}{r}+\frac{V_{\textit{in}}^{2}}{r}-\frac{\left(V_{\textit{in}}R_{\textit{in}}\right)^{2}}{r^{3}},R_{\textit{in}}\leq r\leq R_{\textit{CF}} .\end{equation}
At the CF, the following conditions hold:
 \begin{align} u_{\textit{solid},\textit{CF}}&=\frac{V_{\textit{in}}R_{\textit{in}}}{R_{\textit{CF}}}, \end{align}
 \begin{align} \dot{u}_{\textit{solid},\textit{CF}}&=\frac{\dot{V}_{\textit{in}}R_{\textit{in}}}{R_{\textit{CF}}}+\frac{V_{\textit{in}}^{2}}{R_{\textit{CF}}}-\frac{\left(V_{\textit{in}}R_{\textit{in}}\right)^{2}}{R_{\textit{CF}}^{3}} . \end{align}
The velocities V CF and V in must satisfy the Rankine–Hugoniot condition
 \begin{equation} V_{\textit{in}}=\frac{V_{\textit{CF}}R_{\textit{CF}}}{R_{\textit{in}}}\left(\frac{\varepsilon _{0}-\varepsilon _{\textit{min}}}{1-\varepsilon _{\textit{min}}}\right)\!. \end{equation}
Equations (C16)–(C21) constitute the complete set of governing equations for the shock compaction of the solid phase, which is coupled to the evolution of interstitial gas flows.
C.3. Ring pulsation submodel
Once the CF reaches the outer surface of the ring, the ring dynamics transitions to the ring pulsation phase, synchronised with the fluctuation of the central pressure. The ring is treated as incompressible, with a constant porosity ε = e min . The momentum balance of the ring as a whole is expressed as
 \begin{align} \rho _{\textit{solid}}\left(1-\varepsilon _{\textit{min}}\right)\int _{R_{\textit{in}}}^{R_{\textit{out}}}r\dot{u}_{\textit{solid}}{\rm d}r &=\rho _{\textit{solid}}\left(1-\varepsilon _{\textit{min}}\right)\int _{R_{\textit{in}}}^{R_{\textit{out}}}F_{\boldsymbol{\nabla }P}\boldsymbol{\cdot }r{\rm d}r \nonumber\\&\quad +\rho _{\textit{solid}}\left(1-\varepsilon _{\textit{min}}\right)\int _{R_{\textit{in}}}^{R_{\textit{out}}}F_{\textit{drag}}\boldsymbol{\cdot }r{\rm d}r . \end{align}
Similar to (C16), the first and second terms on the right-hand side of (C22) represent the total pressure gradient force and the total drag force, respectively, acting on the ring per unit cross-sectional area. The parameters
 $\mathit{F}_{{\boldsymbol{\nabla} _{\mathit{P}}}}$
and F
drag
are described by (C11) and (C12), respectively. Due to the incompressibility of the ring, we have
 \begin{align} u_{\textit{solid}}\left(r\right)&=\frac{V_{\textit{in}}R_{\textit{in}}}{r},R_{\textit{in}}\leq r\leq R_{\textit{out}}, \end{align}
 \begin{align} \dot{u}_{\textit{solid}}\left(r\right)&=\frac{\dot{V}_{\textit{in}}R_{\textit{in}}}{r}+\frac{V_{\textit{in}}^{2}}{r}-\frac{\left(V_{\textit{in}}R_{\textit{in}}\right)^{2}}{r^{3}},R_{\textit{in}}\leq r\leq R_{\textit{out}}. \end{align}
Integrating
 $\dot{\mathit{u}}_{\textit{solid}}$
from the inner to the outer surface of the ring yields
 \begin{align} \int _{R_{\textit{in}}}^{R_{\textit{out}}}\dot{u}_{\textit{solid}}\,r{\rm d}r&=\int _{R_{\textit{in}}}^{R_{\textit{out}}}\left(\dot{V}_{\textit{in}}R_{\textit{in}}+V_{\textit{in}}^{2}-V_{\textit{in}}^{2}\frac{R_{\textit{in}}^{2}}{r^{2}}\right){\rm d}r\nonumber\\&=\dot{V}_{\textit{in}}R_{\textit{in}}\left(R_{\textit{out}}-R_{\textit{in}}\right)+V_{\textit{in}}^{2}\frac{\left(R_{\textit{out}}-R_{\textit{in}}\right)^{2}}{R_{\textit{out}}} .\end{align}
Substituting (C11), (C12) and (C25) into (C22) reduces the momentum balance to
 \begin{align} \left(R_{\textit{out}}-R_{\textit{in}}\right)\rho _{\textit{solid}}\left[\dot{V}_{\textit{in}}R_{\textit{in}}+V_{\textit{in}}^{2}\left(1-\frac{R_{\textit{in}}}{R_{\textit{out}}}\right)\right]=-\frac{1}{1-\varepsilon _{\textit{min}}}\int _{R_{\textit{in}}}^{R_{\textit{out}}}dP_{\textit{gas}}/{\rm d}r\boldsymbol{\cdot }r{\rm d}r .\end{align}
Equations (C23), (C24) and (C26) constitute the key governing equations for the ring dynamics in the ring pulsation submodel. The evolution of the central gases and gas filtration through the ring occur concurrently.