I. INTRODUCTION
Accurate determination of nanoscale material properties is necessary for effective validation of materials simulations, materials design, and nanoelectromechanical systems applications.Reference Tanner, Parson, Corwin, Walraven, Wittwer, Boyce and Winzer1 Nanoindentation as a probe of material properties is a relatively rapid sampling method, providing localized measurements of elastic and plastic properties of materials.Reference Oliver and Pharr2–Reference Fischer-Cripps5 Nanomechanical properties related to plastic deformation (i.e., hardness) of a wide range of materials are reported in the literature, however, while there is consensus on the hardness on this length scale for some materials, significantly differing values are reported for other materials.Reference Dub, Lim and Chaudhri6−Reference Read, Keller, Barbosa and Geiss11 These discrepancies could be due to a number of factors, including fundamental assumptions in the problem formulation, error in measurement of the contact area, surface roughness, creep, strain rate effects, and phenomena not yet well understood.Reference Hay, Bolshakov and Pharr12–Reference Fischer-Cripps16
Indentation hardness is a quantification of the amount of plastic deformation induced in a material for a given applied load. Plasticity results from slip caused by dislocation motion when subject to the applied shear stress from the indenter. During elastic loading, regions of the material experiencing a specific value of stress (stress contours) expand under the indenter as the contact area and mean pressure are increased. If the contour with sufficient resolved shear stress expands to contact a dislocation or defect, yield will occur. In well-annealed materials, the stress immediately below the point of contact can grow great enough to nucleate dislocations before the stress at a nearby preexisting dislocation is sufficient to cause slip. In this situation, the local stress can approach the theoretical shear stress before a nucleation event occurs.Reference Zbib and Bahr17 In both cases, the event is detected on the indentation load versus depth curve as a “pop-in,” also called a strain or displacement burst when operating in load–control. The event is recorded as a sudden drop in load if operating in displacement control. These newly created dislocations are free to move and multiply.
When some dislocations are present in the material prior to indentation, the transition from elastic to plastic deformation is gradual because there are ample dislocations to allow slip and dislocation multiplication. However, ever increasing numbers of dislocations will be created, moved, entangled, and pinned as work hardening occurs. The flow stress increases when dislocation motion is impeded by entanglement with each other or obstacles. One contributor to variation in the reported hardness of the material may be the initial dislocation density. In other words, the probability of sampling many dislocations, few dislocations, or no dislocations (prior to and resulting in nucleation) could affect the repeatability of hardness measurements. Given these sources of variation, it may be useful to characterize nanoscale material properties as a stochastic system rather than a deterministic system.
The statistical nature of some phenomena has been studied with nanoindentation.Reference Trtik, Munch and Lura18–Reference Morris, Bei, Pharr and George21 The most common approach for using a statistical view of nanoindentation data has been in characterizing initial strain bursts at the onset of plasticity.Reference Schuh, Mason and Lund22,Reference Biener, Biener, Hodge and Hamza23 Several recent studies have explored the relationship between point defects and the onset of plasticity in face-centered cubic metals and found that the stochastic behavior in the pop-in load can be attributed to the position or concentration of point defects,Reference Salehinia and Bahr24–Reference Salehinia and Medyanik26 and/or dislocations in the region under and near the indenter tip.Reference Morris, Bei, Pharr and George21,Reference Salehinia and Medyanik26,Reference Barnoush27 It is clear that dislocation position impacts pop-in behavior, and dislocation density impacts the overall hardness of the material. What is unclear is whether the positions and concentrations of defects and dislocations play a role in the variability of the traditional hardness measurement of the material as well. Also, as opposed to examinations of the onset of plastic deformation, the number of defects involved in the entire plastic zone may be significantly greater than the number needed to produce stochastic behavior in the system.
Hardness values are frequently reported in the literature, however, it is not often that the variation is analyzed or considered in relation to defect density. Some works report standard deviation error bars and from these, we can infer trends. While studying Ni–P films, Zhang et al.Reference Zhang, Wang and Zhang28 reported variation in hardness with indentation depth. For their tests between 100- and 800-nm depths, they find a trend of increasing standard deviation of the population with decreasing depth. The standard deviation approximately triples over the range they sampled. Farges and DegoutReference Farges and Degout29 report corrected microhardness measurements in a variety of materials. The standard deviations of their data display a general trend of greater variation for shallower indents. Error bars on hardness data presented by BarnoushReference Barnoush27 for high-purity aluminum exhibit the same trend. Visual interpretation of the data presented by Durst et al.Reference Durst, Franke, Böhner and Göken30 again reveals the same behavior, though the scatter is not quantified. Pharr et al.Reference Pharr, Herbert and Gao31 found nanoindentation hardness for a variety of spherical indenter radii. The smaller spheres produce greater hardness as well as greater standard deviation. Similar to the size effect on variability, Elmustafa et al.Reference Elmustafa, Eastman, Rittner, Weertman and Stone32 report greater uncertainty in the data collected from annealed samples than from work-hardened samples. Though a strong effect is not reported, this suggests that dislocation density plays a role as well. In contrast to the aforementioned works, the findings of Lim and ChaudhriReference Lim and Chaudhri33 for larger scale indentations show that for Vickers microhardness tests on a variety of polycrystalline copper samples, there is no discernable trend in the amount of hardness variation with either indentation depth or dislocation density.
Other works explicitly report the variability of nanomechanical properties. In a round robin experiment published by Read et al.,Reference Read, Keller, Barbosa and Geiss11 twenty-seven participating laboratories tested the hardness of thin-film copper on silicon at 300-nm depth. The average standard deviation of the mean hardness was 4%, and the interlaboratory standard deviation was 15%. The standard deviations of the indentation modulus were similar. The International Organization for Standardization establishes lower bounds on minimum repeatability of testing machines used for indentation testing. A variation of 5% in hardness measured under load has been established as the minimum repeatability for the indentation depth range between 200 and 1000 nm.34 No standard is given for indents shallower than this. Based on this, it would be reasonable to expect a hardness variation of at least 5% when smaller volumes are tested. These results, in summary, suggest that variability in reported hardness is prevalent and tends to increase as the volume of the material decreases, and also when the dislocation density is decreased.
The present work seeks to develop further insight into the mechanisms promoting variation in indentation hardness as well as to provide quantitative evidence for the long-standing assumption that deeper indents yield “better” results. Further, we frame the problem as if one only has a small amount of material to test, asking the question, would many shallow indents, or fewer deep intents be preferred for a standard tip geometry such as the Berkovich indenter? Such a condition is analogous to current computationally intensive dislocation dynamics simulations where length and time scales are by necessity significantly shorter than their experimental counterparts. In the following, we investigate the trends in measured material property variation at depths between 50 and 300 nm under three annealing conditions representing different levels of dislocation density.
II. EXPERIMENT DETAILS
A piece of 99.995% platinum approximately 4 × 13 and 2 mm thick was ground with 600 and subsequently 800 grit SiC, polished with 6, 3, 1, and 0.5 μm diamond compound, then washed. The sample was tested under three annealing conditions: (i) as-polished unannealed, (ii) after annealing in air at 500 °C for 30 min, and (iii) after further annealing at 1000 °C for 30 min. After each heating, the sample was air quenched. Grain sizes were estimated via electron backscatter diffraction using orientation image microscopy from TSL (TSL/EDAX, Draper, UT), attached to an FEI FEG/SFEG scanning electron microscope (FEI Company, Hillsboro, OR). The grain size of the sample in the as-polished condition is approximately 1 μm. After the 500 and 1000 °C annealing treatments, the grain sizes were approximately 600 and 1000 μm, respectively. This substantial change suggests that the as-polished grain size is likely due to subgrain formation during polishing and that for this case, the underlying grain size is larger than the surface grain size. Platinum was chosen for its thin passivating surface oxide and exceptional corrosion resistance in nearly any atmosphere and at high temperatures.Reference Craig and Anderson35 This reduces required material preparation as well as the possibility of measuring the properties of the oxide rather than the base metal. Given the short duration, annealing at 500 and 1000 °C should produce very little additional oxidation that could affect subsequent tests.Reference Powell36 Similarly, all indentations are done after imaging in the SEM, and thin carbonaceous layers can be deposited after imaging. However, the expected layer should be similar between all samples, and it is felt that the layer is thin enough to ignore in any further analysis for this work.
The indentation schedule consisted of 499 indents at each annealing condition for a total of 1497 indents. Indent depths, and subsequently spacing, were chosen to give a good sampling of properties across the range of indentation size effect. The indentation array is likely within one grain, or at a maximum of two grains, only based on the grain size and size of the array for the samples annealed at 500 and 1000 °C; however, it should be noted that because each array is separated by about 2 mm from a prior array, the indentations are in different grains between annealing conditions. Table I shows information about each indent pattern. The indent spacing was at least five times the effective diameter of the projected contact area at maximum depth. Such spacing is required to eliminate effects from neighboring indents.37,Reference Bahr, Morris and Sharpe38 The effective contact radius in Table I is calculated from the fitted area function for the tip, with the triangular contact area being converted to an equivalent circle. The plastic volume assuming a plastic volume radius to contact radius ratio of 2.12 following the analysis of Harvey is given for comparison.Reference Bahr, Morris and Sharpe38,Reference Harvey, Huang, Venkataraman and Gerberich39
Indents performed on the sample at each annealing condition.

The testing regime was designed to sample to various depths within a constrained area of the specimen. As such, each indent pattern was arranged within a grid cell that was 44 μm on a side (1936 μm2). The center of each pattern was coincident with the center of the cell. Constraining each indent pattern to a 44 × 44 μm square ensures that an equivalent area of the sample is tested at each depth. Because of the large grain size, most of the indents should be within a single grain. Further, in keeping with the spirit of constrained material volume available to test, no effort was made to control which or how many grains were indented. This would correspond to the situation of indenting a material with a local variation in chemistry (say, a diffusion experiment) or structure (grain boundary or dislocation gradient). A Hysitron triboindenter (Minneapolis, MN) fitted with a Berkovich indenter tip with an effective radius of 750 nm was used to test the platinum in depth-controlled mode. The radius of the spherical portion of the tip was determined from indenting single crystal tungsten and fitting a conventional Hertzian model of elastic loading to purely elastic loading curves. A tip area function generated by indentation in fused quartz and polycarbonate was used to calculate the contact area at maximum indent depth. The depth of each indent was specified to follow a trapezoidal curve for all indents. For the as-polished and 500 °C annealed conditions, a 15 s hold time at maximum depth was used. For the 1000 °C annealed condition, the hold time was extended to 45 s. The hold time was included purely to explore relaxation behavior and did not impact the hardness calculation. The loading and unloading rates for all tests were fixed at 15 nm/s. Simple quasistatic trapezoidal loading was used instead of the continuous stiffness method because significant material softening has been reported when using this technique.Reference Cordill, Moody and Gerberich40–Reference Sui and Ngan43
Although the details of nanoindentation are given elsewhere, it may be helpful to recall that sometimes nanoindentation hardness is calculated from the load recorded at the beginning of the unloading portion of the depth curve. In general, this is not problematic, however, if the material displays excessive relaxation during a depth-controlled test, this load can be considerably smaller than the maximum load. Consistent with the method from the ISO standards, we calculate the indentation hardness, H IT, using the maximum force rather than the force recorded at the onset of unloading.
III. RESULTS
Figure 1 shows curves of typical indents in the as-polished and 1000 °C annealed conditions. The as-polished condition curves of Fig. 1(a) are relatively smooth, though more and deeper pop-ins are exhibited with further annealing as exhibited in Fig. 1(b). The maximum load achieved in general is considerably larger than the load recorded at the onset of unloading.
(a) Load and displacement versus time curves and load versus depth curves for typical indents in the as-polished Pt and (b) indentation curves for the same sample of Pt annealed at 1000 °C. Staircase yielding as a result of pop-in is visible during the loading portion of the curve in the annealed test.
Since there was no a priori knowledge of the outcomes of the tests at various depths, we must consider whether the sample size was large enough to confidently consider differences in the mean hardness and reduced modulus between depths. In other words, the magnitude of variation in the measurements from the indentations could not be known before they were completed, but by analyzing the results, we can confirm that the sample size is sufficiently large to compare two quantities. Sample size tables derived from power calculations confirm that enough indents were performed to detect differences even for the case of n = 12 at a depth of 300 nm.Reference Van Belle and Martin44Figure 2 is a cumulative fraction plot of these hardness data from indenting the platinum in the as-polished condition. The indentation size effect is displayed, as well as the fact that variability is dependent on depth, with the shallower indents having a greater overall range of values and a broader distribution near the mean. The size-dependent behavior is consistent with the recent literature.Reference Romasco, Friedman, Fang, Meirom, Clark, Polcawich, Pulskamp, Dubey and Muhlstein9,Reference Durst, Franke, Böhner and Göken30 The data also indicate increased variability with additional annealing. The effect can be seen in Fig. 3 comparing as-polished indents to 1000 °C annealed indents. Figures 4 and 5 show mean modulus and mean hardness, respectively, at each contact depth and load. The standard deviation increases after annealing and with decreasing indent depth despite the increasing sample size. Contact depth standard deviations for all sample populations were less than 1 nm and are not shown in the figures.
As-polished hardness cumulative probability. The shallower indents display greater variation in measured hardness.
Hardness cumulative probability for the platinum indented at all three annealing conditions. Compared are 50 and 300 nm depths.
Mean reduced modulus versus contact depth.
Mean hardness versus contact depth.
The measured hardness and modulus follow an approximately Gaussian distribution for all annealing conditions and depths, with the exception of two tests. The modulus values for 120-nm-deep indents in the as-polished sample develop a somewhat bimodal distribution with the most frequent hardness measurements near 145 and 165 GPa. Similarly, the modulus values for the 50-nm indents in the 500 °C sample are again bimodal, but more strongly so with modes at 160 and 175 GPa. This could indicate sampling across a grain boundary.
Although inconsequential to H IT, inspection of the load versus time curves for 50- and 120-nm-deep indents on the 1000 °C annealed sample reveals that significant relaxation occurred in many of the tests. The load drops from the maximum load to some smaller value quickly, typically within 5 s. For most curves, the slope of the load versus time curve is horizontal at the point of unloading, thus the relaxation rate has decreased and is often near zero. Positive or negative creep is observed in other tests. These phenomena also occurred for 50- and 120-nm-deep indents at the 500 °C annealing condition, but to a lesser extent.
Figure 6 is a normal quantile plot for hardness of the 1000 °C annealed condition. With the exception of a few outliers, the values generally exhibit good fit with the normal line. Normal quantile plots for the other annealing conditions exhibited even better fit to the normal line at all depths. This is good evidence of a random process.
Normal quantile plot for 1000 °C depth control data (other annealing conditions similar).
The coefficient of variation of the hardness, shown in Fig. 7, is obtained by dividing the standard deviation by the quantity mean. The hardness coefficient of variation is generally between 0.05 and 0.1. The increasing coefficient of variation of the hardness after annealing and with decreasing indent depth indicates greater relative variability. The standard deviations of the hardness round robin reported in the work of Read et al.Reference Read, Keller, Barbosa and Geiss11 are shown for reference. The high variation for the 500 °C indents is due to these indents having been performed across a grain boundary as previously mentioned. The same effect is likely for the as-polished hardness coefficient of variation, but the effect is lessened by the averaging effect of surface subgrains. Shown in Fig. 8, the coefficient of variation of the modulus is between 0.05 and 0.15 for all depths on the as-polished and 500 °C annealed specimen, but climbs from 0.08 for the deepest indents to nearly 0.28 for the shallowest indents on the 1000 °C annealed condition, outside what would be suggested by prior work.Reference Read, Keller, Barbosa and Geiss11 Similar to the trend of the hardness, the coefficient of variation of modulus increases with decreasing indent depth.
Hardness coefficient of variation for the contact depths studied. Shallower indents have a higher coefficient of variation.
Modulus coefficient of variation.
IV. DISCUSSION
Before determining if variation is indeed tied to a specific structure and can provide insight into fundamental deformation mechanics, other possible sources of variation should be considered. Strain rate and machine error can be dismissed as mechanisms for variation with arguments that any deviations from a true measurement are consistent for all populations. Indentation instruments of the type used in this study are generally accurate to approximately 1 nm. If, for an upper bound, we estimate the error in depth measurement at 2 nm, then the percent change in calculated area and thus change in hardness can be found. This error curve is shown in Fig. 7 and is below the level of variability detected in the hardness measurement. For addressing surface roughness, we refer to the work of Bobji et al.,Reference Bobji, Biswas and Pethica14 who studied the effect of surface roughness on hardness via simulation. They found that surface roughness can significantly impact measured hardness when the indent depth is on the order of the roughness. For the present work, surface roughness should be on the order of single nanometers given the polishing steps taken and preindentation imaging of regions of the sample away from the indentations using the scanning probe microscopy feature of the Hysitron system (which were in the single to subnanometer range). Since the minimum indentation depth in this study is 50 nm and the sample surface was not purposely altered between test conditions, surface roughness effects should be significantly less than the observed variations.
Since the hardness data exhibit the indentation size effect, we compare them to the model of hardness depth dependency developed by Nix and Gao for simplicity, though other more recent treatments of the subject have been undertaken.Reference Nix and Gao45–Reference Danas, Deshpande and Fleck47 Their Eq. (8) and the mean maximum load and depth hardness are displayed in Fig. 5. Good agreement is achieved between the model and H IT at each depth and annealing condition. The infinite depth hardness, H 0, and characteristic length, h*, obtained from the fit are, respectively, 0.57 GPa and 1241 nm for the as-polished specimen, 0.88 GPa and 310 nm for the 500 °C annealed specimen, and 0.62 GPa and 290 nm for the 1000 °C annealed specimen. The hardness of the 1000 °C annealed sample should not cross below the hardness of the 500 °C annealed sample as the fitted equations predict, indicating as always that care should be taken when extrapolating beyond collected data.
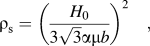
If we estimate the infinite depth hardness for the 1000 °C annealing condition from the fit as 0.6 GPa, we can use the relationship developed by Nix and Gao, Eq. (1), to estimate the statistically stored dislocation density, ρs, as follows:
 $${{\rm{\rho }}_{\rm{s}}} = {\left( {{{{H_0}} \over {3\sqrt 3 {\rm{\alpha \mu }}b}}} \right)^2}\quad ,$$
where b is the Burgers vector, μ is the shear modulus, and α is a constant taken as 0.5. Evaluating Eq. (1) using μ = 61 GPa, b = 0.275 nm results in an average dislocation density of approximately 2 × 10¹⁴ m−2, which gives the lowest average dislocation spacing for the testing herein on the order of 70 nm. Thus, for this tip radius, it is likely that even the smallest sampled volumes could encounter at least one initial dislocation. The dislocations may, however, be pinned and clustered together leaving other areas of the material locally free of dislocations enabling nucleation and burst plasticity to occur.
It should be noted that the shallowest indents were not deep enough to reach the point where the indenter becomes self-similar. Measurements taken with the spherical portion of the tip can underestimate the hardness due to the lower effective strain imposed by the spherical indenter.Reference Ma, Morris, Jennerjohn, Bahr and Levine48 The 50-nm-deep measurements can be considered a lower bound on the hardness for this depth.
As previously mentioned, staircase yielding was exhibited at the 1000 °C annealing condition and to a lesser extent at the 500 °C condition. The staircase and creep behavior affected many of the 50-nm-deep indents and some of the 120-nm-deep indents.
Pop-ins occurred as incrementally more load was applied. During these events, the indenter tip plunged into the sample past the depth specified by the depth curve. The indenter control system attempted to achieve the correct depth despite the excursion. This means that the tip was retracted quickly then continued along the prescribed depth curve. Since pop-in is essentially a random process, there is potential for a pop-in to occur near the target maximum depth. If a pop-in occurred near the target maximum depth, it is possible that the tip penetrated too deeply into the sample. When the indenter recovered, the material may have already been plastically deformed past the target depth. Essentially, the control system was not able to react perfectly to the rapid displacement bursts. As a result, while at the target depth, the tip may not have been making contact with the material or contact could have been occurring, but with the material in an elastically deformed state. In this case, an artificially low load would be recorded and the resulting calculated hardness would too be artificially low. Figure 1(b) shows a typical 50-nm-deep indent performed at the 1000 °C annealed condition. This particular test displays both staircase yielding with pop-in near the target maximum depth and creep relaxation. The elastic moduli measured for indents on the 1000 °C annealed specimen are lower than for the other test conditions. It is possible in this case that because of grain growth, a particularly compliant grain orientation is being sampled. The deviation of the modulus is within the expected range predicted by the literature.Reference Voost and Nix49 A rapid reduction in load is seen as the indenter begins the hold period. It is unclear whether this is mostly due to the indenter reacting to correct from passing the target depth or rapid primary creep. In experiments on polycrystalline gold at 300 K, Bhakhri and KlassenReference Bhakhri and Klassen50 reported rapid initial creep that slows with time. Their work supports the argument for rapid creep here rather than unloading.
Syed Asif and PethicaReference Syed Asif and Pethica51 performed nanoindentation creep experiments on single-crystal tungsten. The samples were loaded beyond pop-in then unloaded and held at various fractions of the maximum load for creep observation. In electropolished samples, they observed positive creep at 10% of the maximum load, no creep at 50% of the maximum load, and negative creep at 70% of the maximum load. Mechanically polished samples showed negative creep at as little as 30% reduction of load. Similar behavior is observed in the test shown in Fig. 1(b), with an approximately 30% reduction in load observed possibly due to indenter correction to pop-in. After the initial drop, the load recorded is constant or slightly increasing with time, potentially indicating negative creep and therefore partial unloading. Upon inspection of other load–depth curves, some are found to exhibit positive creep when there is little reduction in initial load. These findings support the explanation that variations in dislocation density, which lead to sporadic pop-in behavior, could influence the repeatability of hardness measurements. It is difficult to differentiate between indenter correction and rapid creep. As a result, future work should focus on separating these two effects and if necessary, developing strategies for reducing indenter correction.
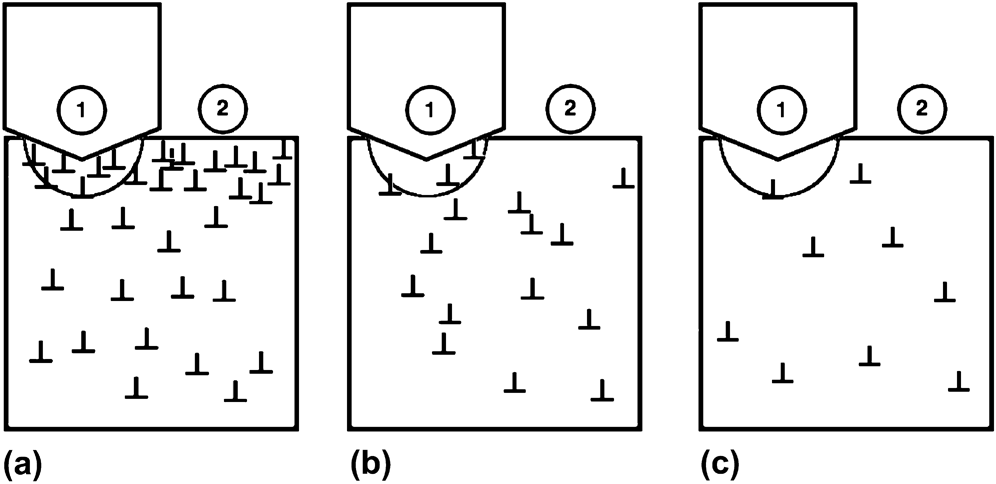
Despite the pop-in and creep effects present at the higher temperature annealing conditions and shallow depths, the trends of increasing variability with decreasing depth and increasing heat treating can be explained by dislocation density and position variation. When the material is worked, in this case by polishing, many randomly located dislocations are generated in the material. The dislocation density is high and generally uniform as shown schematically in Fig. 9(a). The hardness measured at position 1 and position 2 for the as-polished condition is generally likely to be similar. Referring now to Fig. 9(b), representing the material after some annealing, the local initial dislocation density at position 1 is higher than at position 2. The hardness at position 1 will thus be higher than at position 2. The likelihood of sampling a volume of material with differing initial dislocation density is greater as the amount of heat treatment increases. However, this is only the case up to the point where the initial dislocation density is low and the volume is mostly devoid of initial dislocations. The local dislocation distribution for a moderately annealed sample is highly stochastic even if the bulk density is uniform. For the volume of material probed, it might be equally as likely to indent a region where the density is high as it is to indent where the density is low. Thus, when multiple indents are performed, a wider range and greater standard deviation of hardness values will be measured. Figure 9(c) represents the case of a well-annealed sample. In this case, most of the dislocations have been removed from the material. The dislocation spacing is large, potentially 1 μm or more, which can be much larger than the contact diameter or plastic volume radius. Indenting at position 1 in Fig. 9(c) could lead to dislocation nucleation, and the same could be said of position 2. In this case, when many indents are performed, the sampled volume is most likely probing a volume with few initial dislocations. TEM images of strained microcrystalline nickel from Norfleet et al.Reference Norfleet, Dimiduk, Polasik, Uchic and Mills52 and bulk prestrained Ni from Schneider et al.Reference Schneider, Kiener, Yakacki, Maier, Gruber, Tamura, Kunz, Minor and Frick53 support the argument for a stochastically distributed dislocation arrangement.
A schematic of initial dislocation position in the region near the indenter tip, showing (a) high, (b) medium and heterogeneous, and (c) low disloation density. The hemisphere below the indenter tip represents the plastic zone.
The coefficient of variation of the hardness for the 500 °C indents is greater than either the as-polished or the 1000 °C indents. It is likely that sampling across a grain boundary in the as-polished and 500 °C annealing conditions causes the coefficient of variation to be greater than it would have been if only a single grain had been sampled. The subgrain structure at the surface of the as-polished sample served to average the properties of the underlying grains and thus the modality of the measurements is tempered. It is important to recognize that while the variation in hardness is greatest for the sample annealed at 500 °C, the variation in modulus is greatest for the 1000 °C sample. This suggests that the dislocation microstructure variation will indeed dominate the variation in hardness. The sample with the “moderate” variation in dislocation content shows the greatest variation in hardness but not the greatest variation in modulus. A similar phenomenon is seen with increasing indent depth. Deeper indents display a smaller range and less variation of hardness. The stressed volume is of course larger for deeper indents, causing an averaging effect when measuring material properties. The shallow indents only sample near the tip and surface, whereas the deeper indents probe deeper into the material and further from the point of contact. The deeper indents will encounter more initial dislocations, giving a better measurement of the average hardness of the material.
The trends observed here for hardness mirror observations reported by Shao et al.Reference Shao, Abdolrahim, Bahr, Lin and Zbib54 in dislocation dynamics simulations. In their work, the variability in yield strength of micropillars was found to be strongly dependent upon dislocation density and size of the pillar. With decreasing initial dislocation density, they found increasing variability. Decreasing pillar size also produces increasing variability. Similarly, in this current experimental study, we find increasing hardness variability at shallower depths and after annealing.
Some similarities exist in the microstructures of the simulated and real micropillars and the indentations discussed here. In the simulations of micropillars, the samples always contain initial dislocations, similar to the fact that our indentations should on average always probe a dislocation in the stressed volume. In real pillars, a nonuniform stress condition exists in the material under an indenter tip, as is the stress field nonuniform in compression-loaded micropillars.Reference Frick, Clark, Orso, Schneider and Arzt55,Reference Volkert and Lilleodden56 The pillars are monocrystalline in nature and our indents likely sample few grains or just one grain for the 500 and 1000 °C annealed conditions. The two experiments have similar outcomes because they both sample the nonuniformity in stress and defect structure. The trends presented here support the conclusion that the likelihood of sampling multiple dislocations affects the variability of hardness measurements.
V. CONCLUSIONS
The following conclusions can be drawn from this work.
(1) Deeper indents give a more consistent measurement, and this is likely due to the fact that the shallower indents may or may not encounter a local region where the dislocation density is high. The deeper indents probe more material and average the material properties over this larger volume.
(2) Multiscale modeling of material properties such as hardness should consider that for certain sizes of sampled volumes, variation based on microstructural features may add to uncertainty in the use of small-scale mechanical tests to validate computational simulations.
(3) Indentation should be performed on work-hardened samples for the most consistent mechanical properties measurements.
(4) Creep, pop-in, and dislocation density/location impact the repeatability of nanoindentation hardness measurements. Creep and pop-in are defect-based phenomena whose statistical likelihood must be considered when predictions or models are made.
Supplementary Material
Supplementary materials can be viewed in this issue of the Journal of Materials Research by visiting http://journals.cambridge.org/jmr.
ACKNOWLEDGMENTS
This work was supported by the National Science Foundation's CMMI program under Grant No. 1030843. We would like to thank Samantha K. Lawrence for initial sample preparation and Dr. Iman Salehinia for helpful discussion.