Introduction
Winter Wheat is an important crop in the UK and canopy management of crop biomass is an important management tool to optimise yield in the crop.
On average, every three or four years widespread lodging occurs on up to 20% of the UK winter wheat area. The process by which the shoots of small grained cereals are displaced from their vertical stance is known as lodging. This usually occurs only after the ear has emerged and results in the shoots permanently leaning or lying horizontally on the ground. This can reduce yield by up to 80% and causes several knock-on effects including reduced grain quality, greater drying costs and slower harvest. It is a problem that limits cereal productivity. Lodging has serious economic effects; yield is reduced and quality impaired, while combining and drying costs increase. Up to 75% of yield can be lost if crops lodge at ear emergence. Later lodging has less effect on yield, but will impair quality characters such as Hagberg falling number. Lodged crops often require extra drying which can cost £3–£7.50/tonne (Berry et al., Reference Berry, Spink, Griffin, Sylvester-Bradley, Baker, Scott and Clare1998).
Canopy size and risk of lodging can be managed using Plant Growth Regulators (PGRs). In the UK, 84% of the winter wheat is treated with PGRs (Garthwaite and Thomas, Reference Garthwaite and Thomas2000).
Lodging is a complicated phenomenon that is influenced by many factors including: wind, rain, topography, soil type, previous crop, husbandry and disease. It is frequently associated with conditions that promote plant growth such as an abundant supply of nutrients. (Berry et al., Reference Berry, Sterling, Spink, Baker, Sylvester-Bradley, Mooney, Tams and Ennos2004). As such canopy size will change across a field as these factors vary. However most UK growers will apply PGRs at uniform rates across a whole field. Crops that have sub optimal canopies will not benefit from being further restricted by the application of a PGR and could be further stressed, whereas a crop that has a very large canopy and a high risk from lodging will benefit from an application of a PGR.
Therefore a potential improvement in crop canopy management could be to variably apply PGRs across a field based on underlying changes in the crop biomass. Applying more PGR to areas of high biomass and less PGR to areas of low biomass will save money of crop inputs, increase yield and reduce disease pressure as well as establishing a more even crop canopy that will respond better to subsequent inputs and improve harvesting efficiency.
This paper presents the results of this approach on 4 fields over two seasons in the south of England and assesses any benefits that may have been derived from a variable application of PGRs.
Materials and methods
The farm where the variable rate PGR trials were done was on the northern edge of Reading in the south of England. Average rainfall here is 650mm. Average January temperatures range from 1 to 7 °C and July temperatures range from 12 to 22 °C.
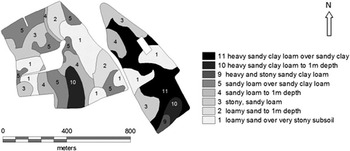
In 2014-15 two fields were chosen for trials, Bishopsleys 20.8 ha and Chalkhouse 31.4 ha. which varied significantly in soil type as shown in Figure 1 below.
Soil type map for Chalkhouse (left) and Bishopsleys (right).

40 t/ha farmyard manure was applied to Chalkhouse in spring 2014 prior to sowing maize. Spring oats were grown in Bishopleys in 2014. At the end of September that year, both fields were drilled with Solstice a group 1 milling winter wheat.
Both fields were farmed commercially with a standard herbicide programme in the autumn and a fungicide programme in spring 2015. Nitrogen fertiliser was also applied in the spring in 4 splits. Sulphur was applied with the first application in March. All nitrogen was applied variably across the fields according to satellite images of the leaf area index (LAI). A total of 260 kg/ha of nitrogen N was applied for the winter wheat crop.
PGR was applied on 8 April, 2015,. The PGR was Chlormequat (0.75 kg/l) applied at 1.6 l/ha. This was mixed with another PGR, Moddus (0.25 kg/l) which has the active ingredient Trinexapac-ethyl. This was applied at 0.1 l/ha. The third ingredient of the PGR mix was Cherokee which is a fungicide with the active ingredient Chlorothalonil applied at 1 l/ha. This mix of two popular PGRs and a fungicide is commonly used in the UK. This was diluted with water and sprayed on at 100 l/ha. The sprayer was a trailed Chafer Guardian. The growth stage of the wheat was GS30 which is just before stem extension.
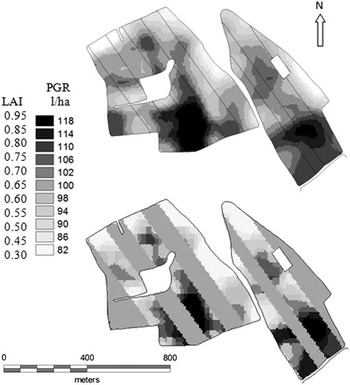
The field was divided up into strips running parallel to the tramlines and between 2 and 3 tramlines wide in Figure 2. Each strip alternated with uniform rate according to the farmer’s best practice and variable rate according to the biomass of the crop as measured by satellite. Red and near infra red wavelengths are emitted from the satellite and measurement by the satellite of their reflectance by the crop will give a map of crop biomass (Soylsense website, 2016). Satellite resolution is 22 m. The satellite images of biomass are converted into leaf area index LAI maps by calibrating the images with ground measurements of LAI. During the growing season, LAI ground measurements are made at certain points in the country in order to convert the images to LAI maps. In the strips where PGR was varied, a high LAI reading generated a high application of PGR up to 120% of the farmer’s best practice. A low reading generated a low application of PGR down to 80% of farmer’s best practice. This variation of +/− 20% is the maximum allowable within the restrictions of the sprayer nozzles.
Satellite image of LAI on 1 April (top) and PGR map (bottom) applied on 8 April, 2015, showing variable rate and uniform rate strips.

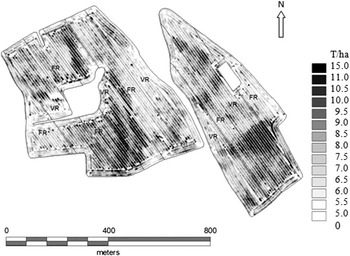
The trial strips were arranged so that there was no treatment bias from soil type or any other factor which may affect yield. A further application of PGR was applied at a uniform rate across the 2 fields on 22 April, 2015, at GS32 when the second node was detectable. This PGR mix did not include any Moddus and the Chlormequat application was reduced from 1.6 to 0.6 l/ha. In August the fields were harvested with a John Deere 680i and the yield was measured and mapped every 2 m along the combine’s 9 m cutter bar as shown in Figure 5.
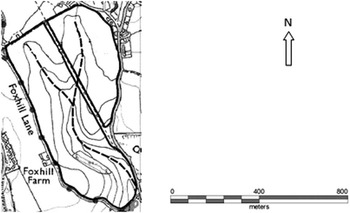
In 2015-16 2 fields were chosen for PGR trials, Dunsden 1 12.1 ha and Dunsden 2 24.1 ha. No soil type map was available and the soil type was slightly different from the previous two fields. Valleys and chalky banks are more prominent on these fields which are shown in Figure 3 below.
Dunsden 1 (right) and Dunsden 2 (left) contoured map (Contains Ordnance Survey data © Crown copyright and database right 2016 OS 0100057954).

The fields were drilled at the beginning of October with Skyfall, a group 1 milling wheat. Both fields were farmed commercially with a standard herbicide programme in autumn 2015 and a fungicide programme in the following spring. Both fields had a biennial application of muriate of potash (MOP) in the spring to feed 2016 and 2017 crops. This was varied according to soil indices measured the previous autumn. Nitrogen fertiliser was also applied in the spring in 4 splits. These were all applied variably across the fields according to satellite images of the LAI. Sulphur was applied with the first application in March and a total of 282 kg/ha of Nitrogen N was applied in total.
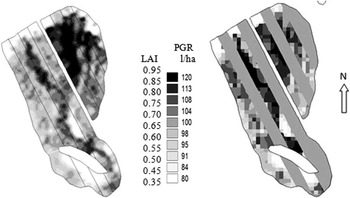
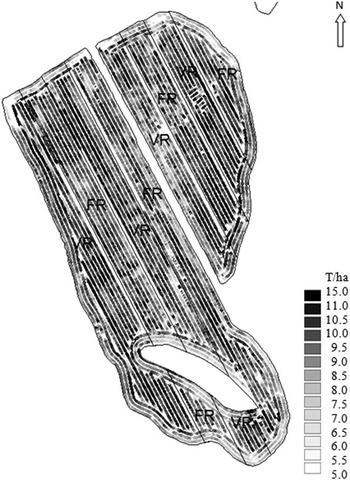
The PGR mix on both fields included 1.0 l/ha Chlormequat (0.75 kg/l) and 0.1 l/ha Moddus (0.25 kg/l). Bravo 500 was also added to the mix at 1 l/ha which is a fungicide (active ingredient Chlorothalonil). This was applied variably in the same way as the previous year, according to satellite images of the LAI. Growth stage of the crop was GS31 when stem extension is just starting. Again variable and uniform rate applications were alternated across the field as shown in Figure 4. Each strip was 2 tramlines wide and the uniform and variable strips were designed to eliminate as much as possible any treatment bias from valley and bank on crop yield. A further uniform rate application of PGR mix was applied on 27 April 2016 with two changes from the variable application. 1) Chlormequat rate was halved to 0.5 l/ha, 2) The fungicide Keystone was added to the mix. The fields were harvested in August and the yield was measured and mapped in Figure 6 as before. No lodging of the crop was observed before harvest.
Dunsden 1 and 2, satellite image of LAI (left) on 31 March, and PGR map (right) applied on 5 April, 2016.

Results
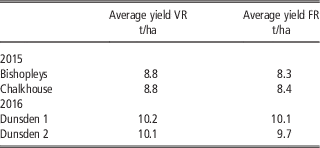
The average benefit for the 4 fields trialled was 0.4 t/ha (Table 1). This represents the average of thousands of measurements in each treatment.
Average wheat yields for the variably treated strips VR compared to uniform (flat rate) FR strips

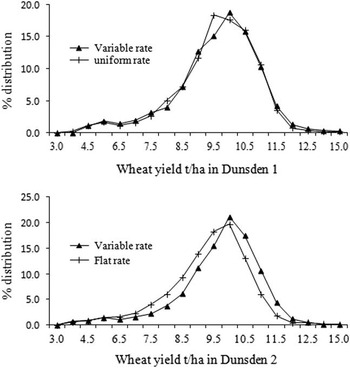
Figure 7 shows that any yield difference between variable and uniform rate in Dunsden 1 is too small to be noticeable whereas in Dunsden 2 there is a clear yield difference between the two rates. Each treatment represents thousands of yield measurements. In this bottom graph of Dunsden 2 in the lower yield range of 7.5 and 10.0 t/ha there are between 10 and 50% more yield measurements in the flat rate treatment. In the higher yield range of 10 and 11.5 t/ha there are between 20 and 50% more yields in the variable rate treatment. This clearly shows that the variable treatment is averaging more than the flat rate treatment. At a conservative price of £140 per t milling wheat, 0.4 t/ha difference equates to £56 per ha saving.
Discussion
PGR has been applied variably in treatment strips such that a high biomass has had more PGR applied up to 120% of farmer’s best practice and low biomass has had less PGR applied down to 80% of farmer’s best practice. The result has been a yield benefit. Thicker crop canopies have had more PGR thus reducing lodging and disease in those areas. Thinner crop has had less PGR in order to reduce stress and improve growth in those areas.
In figure 1 the heavy soil (soil 11) in the VR strip of Bishopsleys has benefitted from higher application of PGR in Figure 2 which has resulted in higher yield in Figure 5. In Figure 3 the valley in the VR strip in Dunsden 2 in the north of the field has benefitted from higher application of PGR in Figure 4 which has resulted in higher yield in Figure 6. In the VR strip of gravelly soil in the south of the field (observed by the second author during a field visit), the wheat has benefitted from a lower application of PGR in Figure 4 which has resulted in higher yield in Figure 6.
In Dunsden 1 there was no clear improvement of yield in the variable rate PGR in Figure 7. The VR strip on the west had a higher rate of PGR applied to both valley and banks compared to the uniform rate in Figure 4. It is possible that the extra PGR has stressed the crop and led to the lower yield in that area in Figure 6.
In Dunsden 2 there was quite a bit of blackgrass in the northern part of the field. This was worse in the uniform strips and has resulted in lower yield in Figure 6. It is possible that the extra PGR gave better control of the blackgrass. This effect needs further investigation.
The limitations of these trials are that most arable sprayers are not able to vary PGR applications more than 20% above or below the field average because the nozzle spray pattern becomes deforested. This means that the lowest rate of 80% may still be too stressful for some sub optimal crop canopies while some thick biomass canopies might benefit from higher rates than 120%. Further investigation should find a way of increasing the range of variable rate spray.
Conclusions
Variable application of PGR has been successfully carried out on four commercial fields. Comparisons with the farmer’s best uniform practice which was carried out alongside variable applications in the same fields demonstrated the clear yield benefits of variable application on three of the four fields. Therefore the conclusion of this paper is that farmers should variably apply their PGR.
Yield maps for Chalkhouse (left) and Bishopleys (right) harvested in 2015 showing trial strips. VR is variable rate, and FR is uniform (flat) rate.

Yield maps for Dunsden 1 (left) and Dunsden 2 (right) harvested in 2016, showing trial strips. VR is variable rate, and FR is uniform (flat) rate.

The distribution of yield measurements for both variable rate and uniform strips for Dunsden 1 (top) and Dunsden 2 (bottom).

Acknowledgements
This project was funded by SOYL. The company is grateful to Simon Beddows from Coppid Farming for allowing four of his fields to be used for this project while continuing to farm them commercially.