I. INTRODUCTION
Thangadurai et al., (Reference Thangadurai, Kaack and Weppner2003) has documented Li5La3Ta2O12 as a fast-ion conductor. This compound has a garnet-type structure that displays both a large molar content and a relatively high mobility of Li within the lattice. Therefore, Li5La3Ta2O12 and other similar garnet phases are being considered for energy storage applications as separator materials in Li-ion batteries (Thangadurai and Weppner, Reference Thangadurai and Weppner2005). The structures of Li5La3Ta2O12 and its analog Li5La3Nb2O12 have been outlined by Thangadurai et al., (Reference Thangadurai, Adams and Weppner2004) where they note the necessity of employing excess Li during synthesis to account for Li loss because of volatility at high temperatures. Careful control of Li precursor content during synthesis is critical to the formation of these fast Li-ion conductor phases. At times during the processing of Li5La3Ta2O12, an impurity phase of La2LiTaO6 may be observed because of the troublesome volatility of the Li species. The presence of La2LiTaO6 is a strong indication of Li loss during processing. Hence, determination of the weight fraction of La2LiTaO6, present in the post-processed Li5La3Ta2O12 powders, can aid in the exact determination of the Li excess required in subsequent precursor batching. Powder X-ray Diffraction (PXRD) data for the La2LiTaO6 phase has been previously documented in the Powder Diffraction File (PDF) database via entry 00-039-0897 and was initially reported by Hayashi et al. (Reference Hayashi, Noguchi and Fujiwara1986) as a pseudo-orthorhombic structure. This perovskite lattice demonstrates an ordering of the Li and Ta sites, resulting in doubling of the unit cell in similar fashion to the previously reported La2LiIrO6 structure (see Hayashi et al. Reference Hayashi, Demazeau, Pouchard and Hagenmuller1980). Various studies on similar ordered perovskite compounds have been reported: Ln 2LiIrO6 (Ln = La, Pr, Nb, Sm, and Eu) by Mugavero et al. (Reference Mugavero, Smith and zur Loye2005); La2LiRuO6 by Battle et al. (Reference Battle, Grey, Hervieu, Martin, Moore and Paik2003); La2LiSbO6 by Lopez et al. (Reference Mugavero, Smith and zur Loye1992). All these studies provide structural details for the documented phases. The existing La2LiTaO6 PDF entry 00-039-0897 was based on the information provided from Hayashi et al. (Reference Hayashi, Noguchi and Fujiwara1986). This initial report on La2LiTaO6 has provided a refined lattice parameters for a monoclinic cell, however, no structural information (i.e. space group, atom positions, occupancies, etc.) were given. Additionally, the absence of an I/I c value in the PDF entry means, that even semi-quantitative Reference Intensity Ratio analysis cannot be pursued. The absence of this information means detailed quantitative analysis of the La2LiTaO6 phase cannot be implemented. Ideally, a full structural elucidation of the La2LiTaO6 phase would prove beneficial for such a purpose, thereby allowing quantitative analysis to be performed via Rietveld structure refinement. The purpose of this study was to isolate the La2LiTaO6 phase and fully characterize its structure so as to facilitate future means of quantitative XRD.
II. EXPERIMENTAL PROCEDURES
A. Sample synthesis
The La2LiTaO6 powder was prepared by solid-state synthesis using Li2CO3 (Alfa Aesar, 99.0%), La2O3 (Acros, 99.99%), and Ta2O5 (HC Starck, 99.0%) precursor powders. The nominal batched composition employed a 1 wt% excess of Li2CO3; and precursor powders were ball-milled for 23 h in ethanol (Pharmco-Aaper, 99.5%). The sample powder was calcined at 1000 °C for 12 h (static air atmosphere) using a 5 °C min−1 heating rate. After calcination, the sample was ball-milled again to reduce particle size of the La2LiTaO6 powder.
B. XRD data collection
A portion of the La2LiTaO6 powder was ground in an alumina mortar and pestle and the powder was lightly dusted onto a greased “zero background” holder (Silicon 510-cut crystal, MTI Corp., Richmond, CA) as outlined by Jenkins and Snyder (Reference Jenkins and Snyder1996). This preparation method generated a thin monolayer (~40 to 50 μm) of La2LiTaO6 powder for XRD analysis. The relatively high density of La2LiTaO6 (~7.2 g cm−3) guaranteed ensured that the monolayer would serve as an infinitely thick specimen for this analysis. A D2 Phaser powder X-ray diffractometer (Bruker AXS, Inc., Madison, WI) equipped with a sealed tube Cu X-ray source (30 kV, 10 mA) and Lynx-Eye 1D energy-discriminating position-sensitive detector was used for data collection. An incident-beam divergence slit (0.6 mm) was employed along with an anti-scatter knife edge (3 mm opening above specimen) to reduce parasitic scatter at the specimen. Powder XRD data were collected over a scan range of 10–90°2θ at a step size of 0.02°2θ and a detector scan-rate of 15°2θ min−1. The equivalent count-time per step in this data collection was ~15 s step−1. Alignment and calibration were checked using a corundum plate (NIST SRM1976) external standard. Diffraction data were collected at room temperature (25 °C).
III. RESULTS AND DISCUSSION
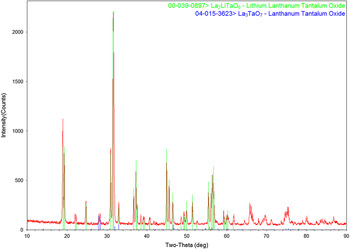
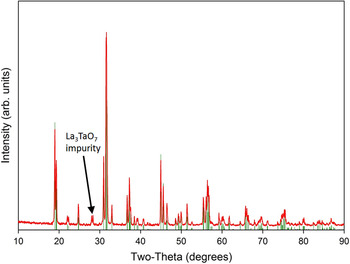
Figure 1 shows the observed XRD powder pattern for La2LiTaO6 along with the existing PDF entry 00-039-0897 for La2LiTaO6. A small impurity phase of La3TaO7 (PDF entry 04-015-3623; Wakeshima et al., Reference Wakeshima, Nishimine and Hinatsu2004) was also observed in the pattern. The presence of La3TaO7 suggests the Li volatility in the preparation of the La2LiTaO6 phase as well. Fortunately, the La3TaO7 impurity phase concentration is quite small and will not significantly impact the derivation of structural parameters for the La2LiTaO6 phase.
(Color online) XRD pattern for synthesized La2LiTaO6 powder is shown as match to the PDF entry 00-039-0897 along with a minor impurity phase of La3TaO7.

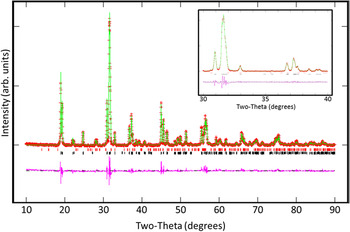
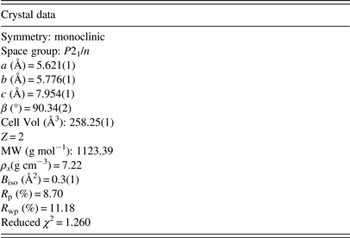
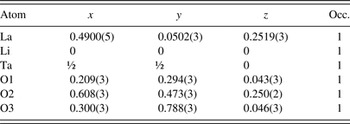
Rietveld structure refinement of the powder XRD data was performed using the EXPGUI version (Toby, Reference Toby2001) of GSAS (Larson and Von Dreele, Reference Larson and Von Dreele2000). The starting model for the La2LiTaO6 in the refinement has employed atom positions for the isostructural compound La2LiIrO6 (Mugavero et al., Reference Mugavero, Smith and zur Loye2005). The structure for La3TaO7 was an input from the data supplied by Wakeshima et al. (Reference Wakeshima, Nishimine and Hinatsu2004). Initial cycles of the two phase refinement converged quickly to low residual error (i.e. R p < 10%). The background function employed in the refinement was a cosine-Fourier-series (background function option No. 2 in GSAS). Three terms were refined for the background function. The profile function employed for the refinement was the conventional pseudo-Voigt function (constant wavelength profile No. 2 in GSAS) where, Lorentzian coefficients for crystallite size and microstrain broadening (Lx and Ly) were refined and the Gaussian variables (U,V,W) were fixed, based on the refinements of the known standard materials (e.g., LaB6). Specimen shift was also accounted for in the refinement via profile function No. 2 settings, but no asymmetric contributions to the profile were modeled. No evidence of preferred orientation was observed visually from the XRD pattern or during the refinement process (e.g., March–Dollase function refined to unity), so the data were fit without preferred orientation corrections. Figure 2 shows the final fit for the structure refinement showing a satisfactory match with the simulated pattern to that of the raw data. The difference pattern shows minor artifacts associated with small discrepancies in peak shape between the observed peaks and the simulated pattern. A zoomed region (30–40°2θ) is shown as an inset to Figure 2, better illustrating the fitting of the profiles and residual present in the difference pattern. Crystal data for La2LiTaO6 are given in Table I. The refined lattice parameters for La2LiTaO6 were very similar to those reported by Hayashi et al. (Reference Hayashi, Noguchi and Fujiwara1986) with the exception that the β angle now is reported with a value >90° (i.e. 90.34°). The final residual error (R p) for the refinement was 8.7% and the reduced χ 2 = 1.26; both these values confirm that the structure refinement is satisfactory and lend validity to the resulting structural parameters obtained. Residual errors (R p and R wp) reported in Table I are “fitted” residual values (i.e. without background subtraction). An overall atomic displacement parameter (B iso) was refined for the structure and yielded a realistic value of 0.3(1) Å2. Employment of the overall B iso parameter was considerably more stable within the refinement than atomic displacement parameters for individual atoms, which would sometimes refine non-positive definite. The refined quantity of La3TaO7 impurity phase was found to be 3.1(2) wt%. Table II lists the atom positions for La, Li, Ta, and O in the La2LiTaO6 structure. Li and Ta occupy unique positions, while the La and three oxygen sites have refinable x, y, and z fractional coordinates.
(Color online) Rietveld structure refinement of La2LiTaO6 powder as a two-phase refinement including the trace second phase of La3TaO7. A zoomed 2θ region is also provided (see inset) to show comparison of fit profiles to that of the raw data. See text for details.

Crystal data and structural refinement for La2LiTaO6.

Refined atomic coordinates for La2LiTaO6.

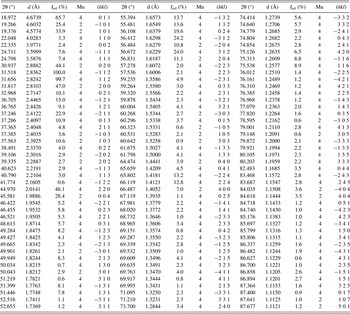
To generate powder XRD data (d's and I's) for La2LiTaO6, the refined structural parameters from Tables I and II were entered into the program PowderCell (PowderCell for Windows, Version 2.4) and a list of peak positions and relative intensities was generated within PowderCell. The use of PowderCell to generate the reflection output list was performed as a check to independently verify the pattern and structure. In addition, the PowderCell output was more easily developed into tabular form and so was employed rather than the conventional GSAS output. The resulting peak list is shown in Table III. Peaks with intensities of ≤0.5% have been removed. The XRD data in Table III were generated via PowderCell so as to avoid possible inaccuracies in peak position and intensity that could be caused during profile fitting of the original raw data (as a result of the superimposed presence of the La3TaO7 2nd phase). As a check, the newly simulated XRD powder data from Table III (stick pattern) for La2LiTaO6 was overlaid onto the raw data pattern (see Figure 3). The new XRD pattern shows excellent agreement with the raw pattern. It is worth pointing out that the original PDF entry 00-039-0897 reported by Hayashi et al. (Reference Hayashi, Noguchi and Fujiwara1986) lists an I rel = 38% for the (011) reflection, whereas results in Table III show a considerably higher value of I rel = 65.7%. Minimal information regarding instrumentation, data collection, and data reduction is given in the Hayashi et al., (Reference Hayashi, Noguchi and Fujiwara1986) publication and so it is difficult to assess the origin of this discrepancy. When comparing the balance I rel values from Table III with those reported by Hayashi et al. (Reference Hayashi, Noguchi and Fujiwara1986), the trends are more agreeable.
(Color online) New PXRD stick pattern for La2LiTaO6 (generated via PowderCell) overlaid onto raw data to verify an acceptable phase identification pattern suitable for the database.

PXRD data for La2LiTaO6 (reflections with I rel ≤ 0.5% have been removed).

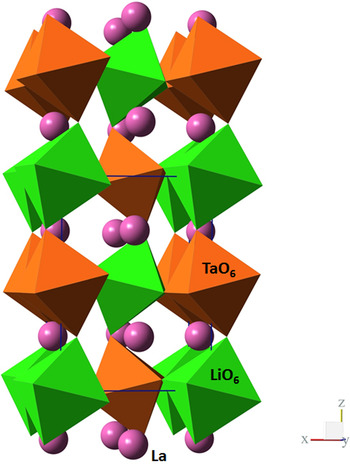
Figure 4 presents the refined structure for La2LiTaO6 as a polyhedra model. One can clearly see the ordering behavior of the LiO6 and TaO6 octahedra as they stack in the c-axis direction. The chains of LiO6 and TaO6 show significant octahedral tilting of the apical oxygen (i.e., O2 – see Table II). The La atoms fill the cavities provided by the tilted octahedra. It is the presence of these tilted octahedra, and their respective oxygen locations, that gives rise to significant variability in the La–O bond lengths (as will be discussed later).
(Color online) Polyhedra visualization of La2LiTaO6 structure as viewed down the b-axis. Chains of ordered LiO6 and TaO6 octahedra are shown propagating along the c-axis (vertically) in the image. La atoms are shown as isolated spheres filling the large voids created by the linked octahedra.

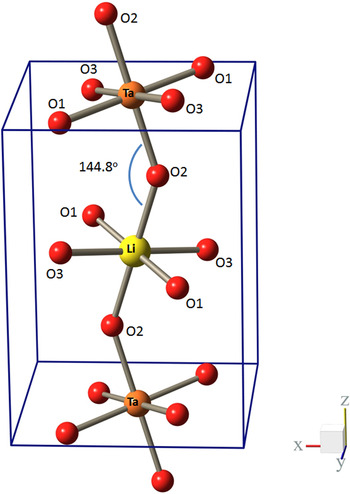
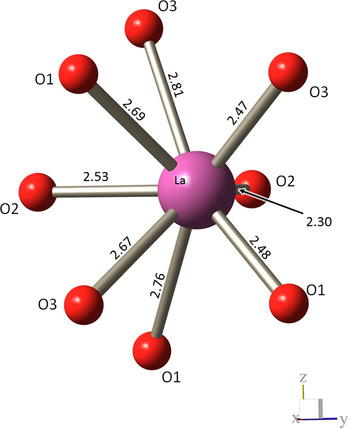
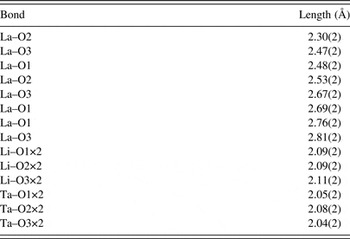
Figure 5 better illustrates the ordered LiO6–TaO6 chains generated in the structure. This figure shows the apical oxygen (O2) displaying a tilt of 144.8° ± 1.0° for the Li–O2–Ta bond angle, which is a significant deviation from a linear (180°) arrangement. Although this tilt angle is significant, it is not without precedent, as the isostructural Eu2LiIrO6 (see Mugavero et al., Reference Mugavero, Smith and zur Loye2005) has a comparable tilt angle (144.7°). It is worth pointing out that the tilting of the LiO6 and TaO6 octaherdra with respect to one another is quite different along the c-axis direction (i.e., Li–O2–Ta bond angle) than the other Li–O–Ta bonding which occurs along the [110] and [−110] directions in the structure. The Li–O–Ta bond angles linking octahedra in these directions, namely Li–O1–Ta (153.4° ± 1.0°) and Li–O3–Ta (151.9° ± 1.1°) display ≈8° anisotropy in the relative orientation of vertex-sharing ochtahedra. Table IV lists the bond lengths for Li–O, Ta–O, and La–O. When considering the Li–O and Ta–O bond lengths, all the Li–O bond values appear similar (between 2.09 and 2.11 Å). The Ta–O bonds are generally shorter (between 2.04 and 2.08). The pervading observation concerning the octahedra is that they are relatively uniform in terms of bond lengths within each respective octahedra (Li or Ta), but there is a significant variance allowed in the tilting of the octahedra when viewed with respect to the neighboring octahedra in the lattice. Figure 6 shows the net effect of the tilt variation on the resulting coordination of the La atom. The La–O bond lengths (in Å) are listed in Figure 6 as well as documented in Table IV. The variation in bond lengths exceeds 0.5 Å as the range of bonds varies from 2.30 to 2.81 Å about the La cation. Similar variations in La–O bond length were observed in the Ln 2LiIrO6 series (Mugavero et al., Reference Mugavero, Smith and zur Loye2005) and for La2LiSbO6 (Lopez et al., Reference Lopez, Veiga, Rodriguez-Carvajal, Fernandez, Jerez and Pico1992).
(Color online) Ball and stick visualization of LiO6 and TaO6 octahedra showing tilting between linked Li and Ta octahedra as well as relative positioning of the octahedra within the unit cell. See Table IV for Li–O and Ta–O bond lengths. The structure is shown as viewed down the b-axis and the c-axis propagates vertically. See text for details.

(Color online) Ball and stick visualization of oxygen coordination about the La atom. Numerical values shown on La–O bonds are in Angstroms. See also Table IV for La–O bond lengths. The orientation of this La–O coordination plot has been rotated relative to Figures 4 and 5 and is viewed down the a-axis with the c-axis propagating vertically.

Selected bond lengths for La2LiTaO6.

IV. CONCLUSION
The La2LiTaO6 phase has been isolated and the structure has been refined. The compound displays a monoclinic ordered-perovskite structure. The ordered LiO6 and TaO6 octahedra are very similar in terms of metal–oxygen bond uniformity, displaying minimal distortion and uniform bond lengths within each individual LiO6 or TaO6 octahedron. However, the linked octahedra display significant Li–O–Ta bond angle tilting, resulting in the distortion of the structure and variable La–O bond lengths. PXRD data have been generated for La2LiTaO6 suitable for new entry into the PDF database.
ACKNOWLEDGEMENTS
Material synthesis was supported from the US Department of Energy's Office of Nuclear Energy Fuel Cycle Research and Development Program managed by Dr. Stephen Kung. Sandia National Laboratories is a multiprogram laboratory managed and operated by Sandia Corporation, a wholly owned subsidiary of Lockheed Martin Corporation, for the US Department of Energy's National Nuclear Security Administration under contract DE-AC04-94AL85000.
SUPPLEMENTAL DATA
The supplementary material for this article can be found at http://www.journals.cambridge.org/PDJ.
The Chemical Information File (CIF) for La2LiTaO6 is available via the online version.