I. Introduction
Although wine has been a highly-traded product for a long time (Ayuda, Ferrer-Pérez, and Pinilla, Reference Ayuda, Ferrer-Pérez and Pinilla2020), globalization has strongly influenced international wine markets during recent decades, resulting in the rapid growth in trade (Campbell and Guibert, Reference Campbell and Guibert2006) as well as structural shifts in trade patterns (Anderson and Wittwer, Reference Anderson and Wittwer2013; Mariani, Pomarici, and Boatto, Reference Mariani, Pomarici and Boatto2012). This is partly due to the introduction of new wine-producing countries, and partly due to new destination markets for exports, with a particular emphasis on China. Recent studies on trade patterns for wine investigates the role of factors such as exchange rates, regulations, trade barriers, and the development of new markets for trade (Dal Bianco et al., Reference Dal Bianco, Boatto, Caracciolo and Santeramo2015; Mariani et al., Reference Mariani, Napoletano, Pomarici and Vecchio2014).
However, besides noting that keener competition in the global marketplace has made relationships between buyers and sellers of wine more fickle (Balogh and Jámbor, Reference Balogh and Jámbor2017), the duration of trade relationships involving wine has received limited attention. The ability of a firm to maintain established trading-partner relationships over time reduces market-specific search and investment costs at the firm-level, and is thus important for trade cost for firms (Melitz, Reference Melitz2003). This is likely to be the case also for trade in wine. However, for wine products, the fact that specific terroirs are necessary for many qualities may also cause trade duration patterns to deviate from what is observed for other products, as suppliers may have a stronger position due to the uniqueness of their products, particularly for high-quality wine.
Trade duration is an important part of firms’ trade margins and was first investigated by Besedeš and Prusa (Reference Besedeš and Prusa2006a, Reference Besedeš and Prusa2006b) using country-to-country level data. They showed that trade relationships in U.S. imports for all types of products are highly dynamic, with a mean survival rate between 2–4 years. Such short durations are much more volatile than what is predicted by standard trade theory. In recent years, there has been an increasing focus on the role of firms in international trade, with a particular focus on trade cost. The seminal model of Melitz (Reference Melitz2003) showed that trade costs could vary between firms and markets and contain fixed as well as variable components, influencing which firms export to any specific market. Esteve-Pérez, Requena-Silvente, and Pallardó-Lopez (Reference Esteve-Pérez, Requena-Silvente and Pallardó-Lopez2013) and Straume (Reference Straume2017) use firm data to study duration and shows that trade patterns are more dynamic at the firm level than on the country level.
In this article, we investigate the duration of trade relationships for wine imports to Norway. The fact that no wine is produced in Norway has two advantages: (1) the trade data completely characterizes the market and (2) there are no discriminatory fees or tariffs for any group of producers. The data contains all transactions for firms that import wine to Norway, linking all the individual transactions to specific importing and exporting firms. This level of detail in the data allows us to analyze factors that affect the duration of the individual exporter-importer trade relationship. To our knowledge, this article is the first to study the duration of such highly disaggregated buyer-seller relationships in the wine trade.
The next section provides more background on the determinants of the duration of trade and links this discussion to the international wine industry. In Section III, the empirical strategy is described. Section IV presents the data, followed by Section V where the empirical results are discussed. Section VI concludes.
II. Background
Several theoretical models of trade (e.g., Krugman, Reference Krugman1979; Rauch, Reference Rauch1999) show that trade in differentiated goods, such as wine, is anticipated to last longer than trade in homogeneous goods. Besedeš and Prusa (Reference Besedeš and Prusa2006b) and Nitsch (Reference Nitsch2009) confirm the fact that trade in homogeneous products will have a shorter duration than the trade in more differentiated products. This article does not compare trade duration across different types of goods, but rather different “versions” of a particular good. Specifically, it investigates what role differentiation through quality, as signaled by unit values of wine, has on trade duration. In particular, one would expect premium wines to behave more like differentiated products due to unique terroirs, while cheaper wines may be more commoditized.
The variation in attributes makes wine a differentiated product. One can argue that higher-quality wines are more differentiated than lower-quality wines, as they are more complex in terms of smells and flavors. Wine prices will, to some extent, reflect quality but also embed other attributes such as reputational effects that can be based on past quality and achievements (Oczkowski, Reference Oczkowski2001; Oczkowski and Doucouliagos, Reference Oczkowski and Doucouliagos2014). Wine importers have to look beyond the price to fully understand the type of product, its quality, and market potential. This implies that search costs are larger for higher-quality wines than for lower-quality bulk wines because importers need to obtain more information for trade in high-quality wines.
The literature on trade duration also shed light on other factors that influence duration. For instance, the initial size of the trade flows is positively linked to duration irrespective of the type of good (Besedeš and Prusa, Reference Besedeš and Prusa2006b; Esteve-Pérez, Requena-Silvente, and Pallardó-Lopez, Reference Esteve-Pérez, Requena-Silvente and Pallardó-Lopez2013). This can be explained by sunk cost and option theories as well as learning models (Caves, Reference Caves1998, Reference Caves2007). Firms start with large initial trades when they commit to the trade relationship, which then gives them the option to grow the trade even larger when confirming their initial belief in the trading partnership.
Size of producers matters in terms of participation in wine exports. Larger firms will have a greater propensity to export (Aylward, Reference Aylward2003), but size does not appear to be a prerequisite to participate as both small and large firms participate (Aylward, Reference Aylward2003; Suarez-Ortega, Reference Suarez-Ortega2003). One explanation for this might be constant returns-to-scale, making the cost advantage of large exporters less obvious (Townsend, Kirsten, and Vink, Reference Townsend, Kirsten and Vink1998). Nonetheless, among small and medium-large producers, Maurel (Reference Maurel2009) finds the largest firms have the highest export performance as measured by export intensity.
Ambiguous results about the link between size and export performance can also be related to quality, rather than productivity, as shown in Crozet, Head, and Mayer (Reference Crozet, Head and Mayer2011). Their study analyzes the champagne market and finds that better quality increases the propensity to export, and that price rises monotonically with quality. However, in markets for other wine types, reputation appears to be an equally important determinant of the price (María Angulo et al., Reference María Angulo, María Gil, Gracia and Sánchez2000; Oczkowski, Reference Oczkowski2001; Oczkowski and Doucouliagos, Reference Oczkowski and Doucouliagos2014). These differing results about the price-quality relationship can exist due to different ways of measuring quality (Corsi and Ashenfelter, Reference Corsi and Ashenfelter2019) and, as Combris, Lecocq, and Visser (Reference Combris, Lecocq and Visser1997) discuss, because the judgment of experts might not conform to the taste preferences of wine consumers in general. In any case, the price-quality relationship appears to be reasonably strong as one can assume that reputation is partly based on past quality performance.
Trade duration models often incorporate elements of the gravity model of trade, as standard gravity variables are known to influence trade flows, and thus, also potentially duration of trade relations. Nitsch (Reference Nitsch2009), Esteve-Perez, Requena-Silvente, and Pallardó-Lopez (Reference Esteve-Pérez, Requena-Silvente and Pallardó-Lopez2013), Straume (Reference Straume2017), and Asche et al. (Reference Asche, Cojocaru, Gaasland and Straume2018) show that trade durations are negatively affected by increased geographical distance to the destination market, while the results are mixed with respect to the economic size of the destination market. Dal Bianco et al. (Reference Dal Bianco, Boatto, Caracciolo and Santeramo2015) find that distance has a negative influence on trade flows of wine using gravity model specifications that include distance as a standard variable to explain the effect of increased transportation costs on trade values.
In other studies of the international wine trade, geographical distance is seldom discussed as an issue (Anderson and Wittwer, Reference Anderson and Wittwer2013; Mariani, Pomarici, and Boatto, Reference Mariani, Pomarici and Boatto2012). Instead, trade barriers in terms of restrictions or additional taxes on wine imports have received attention as an influence on international trade (Dal Bianco et al., Reference Dal Bianco, Boatto, Caracciolo and Santeramo2015; Mariani et al., Reference Mariani, Napoletano, Pomarici and Vecchio2014; Wiseman and Ellig, Reference Wiseman and Ellig2007). These studies show that trade barriers have a negative impact on wine exports to different markets. In our analysis, all agents in the market are subject to the same import regulations, so these cross-country differences in regulations and taxation do not come into play.
Changing trade patterns can be driven by different factors that influence the relative competitiveness of different producer countries (Hussain, Cholette, and Castaldi, Reference Hussain, Cholette and Castaldi2008; Witter and Anderson, Reference Wittwer and Anderson2020). One key factor that influences price competitiveness in the wine trade is exchange rates. For example, Anderson and Wittwer (Reference Anderson and Wittwer2013) find that changes in the real exchange rate can, to a great extent, explain why New World producers such as Australia and Southern World producers lost market shares in a period from 2007 to 2011. During this period, Australia experienced an appreciation in the real exchange rate of 33% that led to a reduction of its wine exports. Cardebat and Figuet (Reference Cardebat and Figuet2019) argue that French wines became less competitive during the 2000s, partially due to the appreciation of the euro against the American Dollar and British Pound.
Characteristics of the Norwegian wine market may also influence trade duration. For example, the growth in wine consumption in Norway, which has increased from around 27 thousand liters per year in the early 1990s to around 76 thousand liters per year in 2013, after which it has leveled off, might have positively influenced trade duration. A similar trend is noted in per capita wine consumption, which was just under 8 liters per year in the early 1990s, and increased to around 18.5 liters per year in the 2010s. Gustavsen and Rickertsen (Reference Gustavsen and Rickertsen2019) provide more information about Norwegian wine consumers.
A particular characteristic of the Norwegian wine market is that all retail sales of beverages with an alcohol content above 4.75% has to be conducted by the state-run Wine Monopoly stores (Vinmonopolet). The Norwegian government established the monopoly to control alcohol consumption and, thus, limit the negative effects of alcohol on society. One of the key regulations to reduce consumption is a high tax on alcohol. As Casini et al. (Reference Casini, Corsi, Rickertsen, Lai and Cavicchi2013, p. 319) note: “High tax rates per unit of alcohol [in Norway] mean that cheap wines become relatively expensive, while expensive wines become relatively cheap. In other words, high-quality wines have more or less the same price as identical wines purchased abroad, while cheap wines are much more expensive than abroad.” An effect of this policy is to dampen the quality signal of wine prices.
Although the Wine Monopoly has exclusive retailing rights, the right to import wines was deregulated in 1995. Since then, the number of private importers has steadily grown. In 2004, there were 125 importers that provided wines to the Wine Monopoly, while in 2014, this number had increased to 404 importers (Wine Monopoly, 2004, 2014). This means that wine distribution in Norway can be viewed as a public-private partnership. There is a large selection of wines in Norway, with more than 8,000 wines available from all the main wine-producing countries (Casini et al., Reference Casini, Corsi, Rickertsen, Lai and Cavicchi2013). The most-selling wines are available in all of the Wine Monopoly's outlets, while those not stocked in an outlet can be ordered without additional charges.
According to an in-depth article from Dagens Næringsliv, a Norwegian business newspaper, the competitive climate among Norwegian wine importers hardened substantially over the data period with the increased number of importers (Kristiansen, Reference Kristiansen2016). A sign of these new times was signaled by incumbent importers accusing new firms of “stealing” wine brands. Supposedly, this was done by slandering about incumbents’ lack of sales and promotion effort in Norway to wine exporters/producers and by other methods perceived as unfair by the incumbents. Structural changes in the competition among the importing firms may, therefore, also have influenced the duration of trade relationships.
III. Empirical Strategy
To estimate the duration of trade relations, we apply survival analysis. Survival analysis estimates the expected duration of time before some event terminates a relationship. For example, in the health sector, this can be the death of a patient. In economics, it is typically related to firms going out of business or the termination of trading partner relationships. In general, the survival function can be specified as

where f(t) is the probability density function of T (i.e., the probability of failure at time t), S(t) is the survival function that gives the probability that an observation survives longer than t. In other words, the survival function is the probability that there is no failure prior to time t. The Kaplan-Meier nonparametric estimator is a common technique to graph the shape of the survival function.
Finally, h(t) is the hazard function, which gives the rate of failure at a time t, given that the unit of observation has survived up to time t. That the hazard function h(t) is a ratio can be seen more easily by rewriting Equation (1) as h(t) = f(t)/S(t). The hazard rate can vary from zero (meaning no risk of failure at all) to infinity (certain failure). It can be shown that the hazard rate can be reformulated as a regression of the form (Greene, Reference Greene2003)

where the hazard rate is conditional on a set of covariates, X. In the trade literature, the hazard rate is usually estimated using a Cox proportional hazards model (Besedeš and Prusa, Reference Besedeš and Prusa2006a; Nitsch, Reference Nitsch2009). Even if the baseline hazard h(t) is not specified, the Cox model's results will closely approximate the results for the correct parametric model. Another advantage is that one can obtain the estimated betas, representing the true βs (i.e., the parametric part of the Cox function), without having parameterized the hazard function (i.e., the non-parametric part of the Cox function). The latter also implies that no assumption about the underlying distribution of the hazard function is required.
One objection to the Cox model is that it assumes the hazard rate to be constant over time. To allow for a more flexible estimation of the hazard rates, we also estimate a parametric Weibull model.Footnote 1 In the Weibull model, the underlying hazard rate is not assumed to be constant over time but rather modeled as a function of the log of time. Some trade relationships can experience multiple failures, meaning that an exporter-importer firm pair stops trading at a certain point in time, but resumes the trading relation again at a later point in time.
IV. Data
The data used in this article are taken from customs records identifying each single import transaction of wine from 2004 to 2014 of HS code 22042109.Footnote 2 This means that the individual importers and exporters linked to each trade are matched, and the records identify total volume, total statistical value (in NOK), invoicing currency, wine production country, and shipping country associated with the trade.
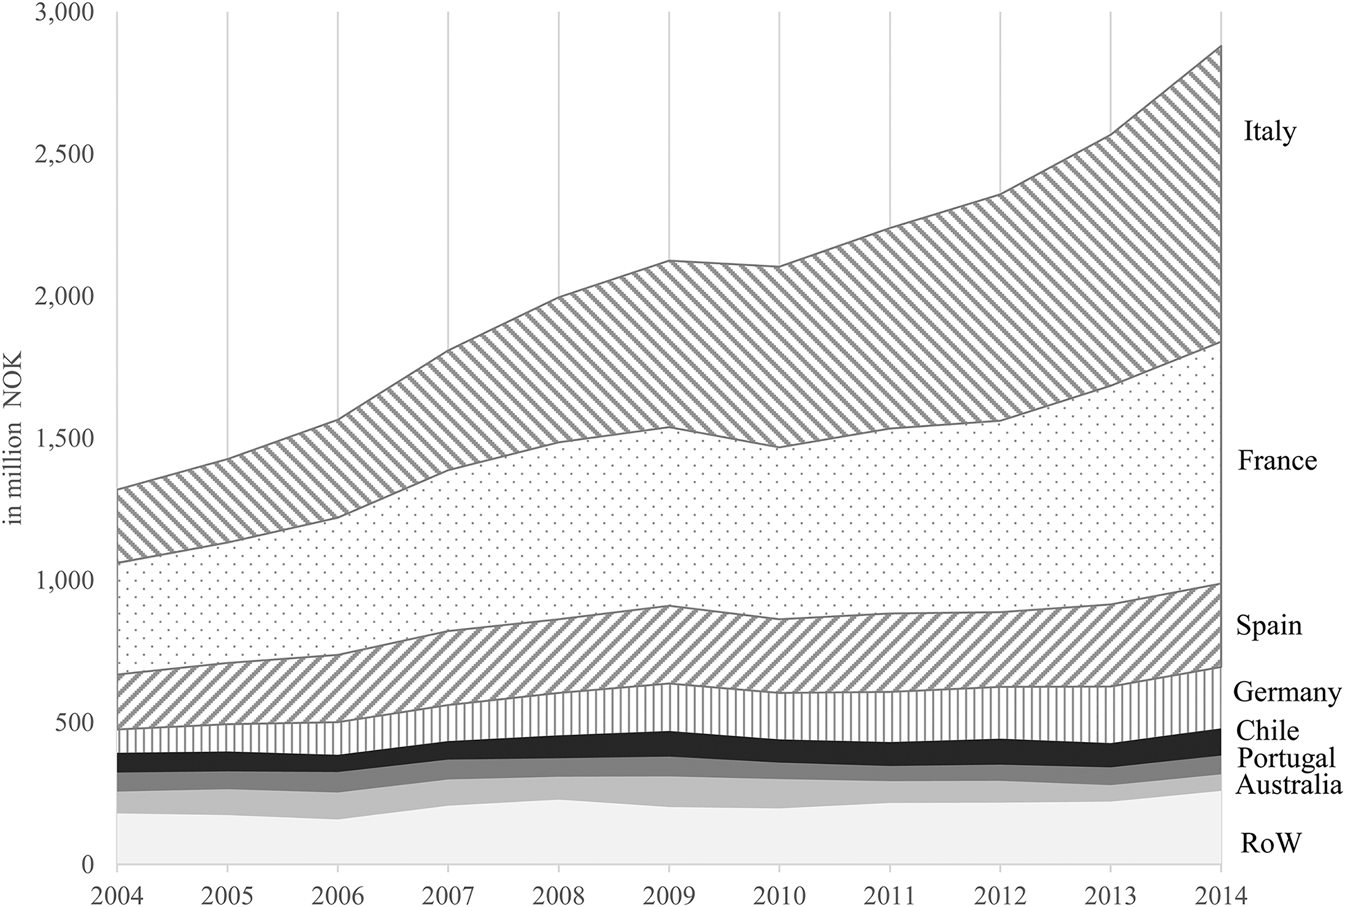
French (30%), Italian (29%), Spanish (13%), and German (7%) wines accounted for around 80% of the total import value during the entire period (see Figure 1). This implies that the “old world” wine producers clearly dominate the Norwegian market. The four largest countries of origin have actually increased their dominance from 70% in 2004 to 83% in 2014, with Italy's market share growing the most from 20% to 36%.
Wine Imports to Norway by Producing Country

The duration analysis is conducted at the firm-to-firm level for a particular wine-producing country. Due to this definition of a trade relationship, the same importer and exporter may share more than one trade relationship since a particular exporter may export wines from more than one country. That is, if firm A exports wines from France and Italy handled by importing firm B in Norway, this constitutes two distinct trade relationships according to our definition. This distinction between the wine-producing countries makes it more clean-cut to identify the effects of exchange rates and gross domestic product (GDP) on trade relationships. Moreover, it makes sense since the trade from two distinct countries will represent different quality wines and generally different wine producers.
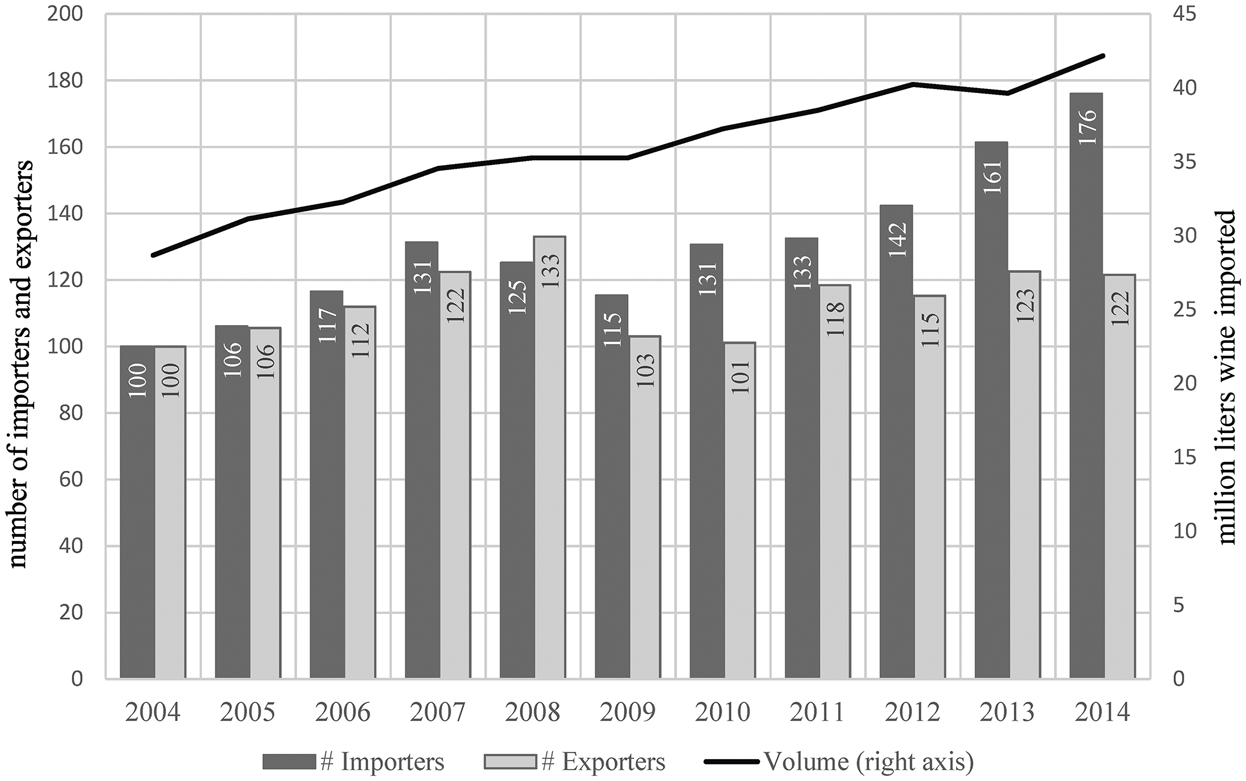
The number of importers and the average volume they import are shown in Figure 2. The number of importers steadily increased until the financial crisis started in 2008, after which many appear to have exited. In 2011, the number started to increase again, but never exceeded the peak in 2008. Another noteworthy pattern in the graph is that the average imported volume per firm was at its lowest in 2008, and since 2009, it has been on a higher level compared to the pre-financial crisis years. However, it is important to keep in mind that wine consumption in Norway has increased throughout the data period. This may help to explain why the average volume per importer has been increasing. We now turn to look at key statistics of the variables in the data set.
Number of Wine Importers and Exporters and Annual Imported Volume of Wine

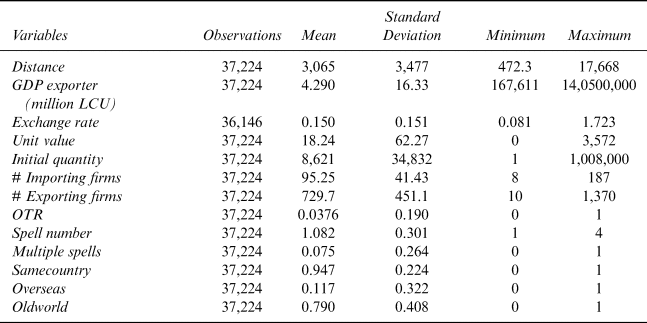
Table 1 shows descriptive statistics of the variables. The Distance variable that measures between a wine exporter and Norway were obtained from distancefromto.net. This web engine uses Google Maps to calculate distances between two geographical points. The GDP exporter is used to measure the size of the exporting countries’ economies. The exporters’ GDPs are denoted in fixed prices of local currency and were collected from the World Bank. The Exchange rate measures the wine importer's currency, Norwegian kroner (NOK), against the exporters’ currencies. A rise in the Exchange rate implies the import of that country's wine becomes relatively more expensive compared to other countries’ wines that use different currencies. The source of the exchange rate data is the central bank of Norway.
Descriptive Statistics

Crozet, Head, and Mayer (Reference Crozet, Head and Mayer2011) found that quality is a far more important predictor of export success among champagne producers than productivity. Unlike Crozet, Head, and Mayer (Reference Crozet, Head and Mayer2011), we do not have a direct measure of quality but use the unit value of imports as a proxy for quality. Price has been found to be a good, but imperfect, measure of quality (Combris, Lecocq, and Visser, Reference Combris, Lecocq and Visser1997; María Angulo et al., Reference María Angulo, María Gil, Gracia and Sánchez2000). For instance, Oczkowski (Reference Oczkowski2001) found that for Australian wines, reputation was a stronger predictor of prices than quality. But reputation is likely linked to the past quality of the wine, which still means there is a strong quality-price relationship (Landon and Smith, Reference Landon and Smith1997; Oczkowski and Doucouliagos, Reference Oczkowski and Doucouliagos2014).
The Unit value measures the average price per liter per shipment denoted in NOK. The mean price is 107 NOK per liter imported wine, which corresponds to slightly above 13 USD per liter. As can be expected, there is a large span between the minimum and maximum values, given the significant quality differences of wine. The standard deviation of import prices is around 24 USD per liter.
The Initial quantity measures the size of the first shipment in every exporter-importer-trade relationship. The main purpose of this variable is to capture the scale effects on trade duration. Larger initial quantities are normally associated with longer duration of trade relationships (Besedeš and Prusa, Reference Besedeš and Prusa2006b). Another factor that could influence survival rate is the number of firms in the market. For example, it was discussed earlier that the competitive environment among Norwegian wine importers appears to have changed towards a more cut-throat competition (Kristiansen, Reference Kristiansen2016). To capture such changes, we include # Importing firms, which measured the yearly number of Norwegian firms that import wines from the individual wine-producing countries.
Note that the measures contrast the total number of importers shown in Figure 2, since the variable # Importing firms only counts the number of firms importing from a particular wine-producing country, say, from France. The idea is that an importer-exporter relationship of French wines is influenced by the total number of Norwegian importers targeting French wine producers and not the number of wine-importing firms operating in Norway altogether. This can be a reasonable delineation if Norwegian importers must commit large investments when moving from one wine-producing country to another. Similarly, the variable # Exporting firms measures how many firms per year export wine to Norway from a specific wine-producing country.
To account for trade relationships that involve partners that already trade together in wines from other countries of origin, we include a dummy variable for on-going trade relationships (OTR). Our hypothesis is that relationships that involve partners that already are familiar with each other will have lower failure rates. The Spell number is a count variable that counts the number of times the exporter-importer pair has traded together in the sample. For example, for a trade-relationship that breaks down after one year and then retakes trading two years later, the Spell number will take the value 1 for the first short spell and then the value 2 for as long as that second spell lasts. If the underlying hazard rate is allowed to vary with time, as in the Weibull model, we would assume that as the number of spells increases and the partners get to know each other better, the survival rate of the trade relationships would increase.
Several dummies are included as independent variables. Multiple spells capture the number of observations where exporter-importer trade relationships have several spells. This variable complements the Spell number by giving the value 1 to trading-partner relationships that have more than one spell. Same country indicates when the wine is shipped to Norway, from the same country in which it is produced. Table 1 shows that almost 95% of the shipments are sent directly from the producing country, so it is quite unusual that the wine is re-exported from another country. Overseas is a dummy for wines originating outside of Europe, which is predominantly from Oceania, South Africa, South America, and the United States. These overseas producers account for around 12% of the imported wines. Oldworld is a dummy for wines originating from the “four big,” France, Italy, Spain, and Germany. The dummy is included to see if these “incumbent” producers’ position in the Norwegian wine import market influence trade relationships in any systematic manner. In Models (3) and (4), we drop the Oldworld dummy and rather include country-specific dummies, representing each of these wine-producing countries individually, to investigate if country-specific fixed effects influence trade relationships.
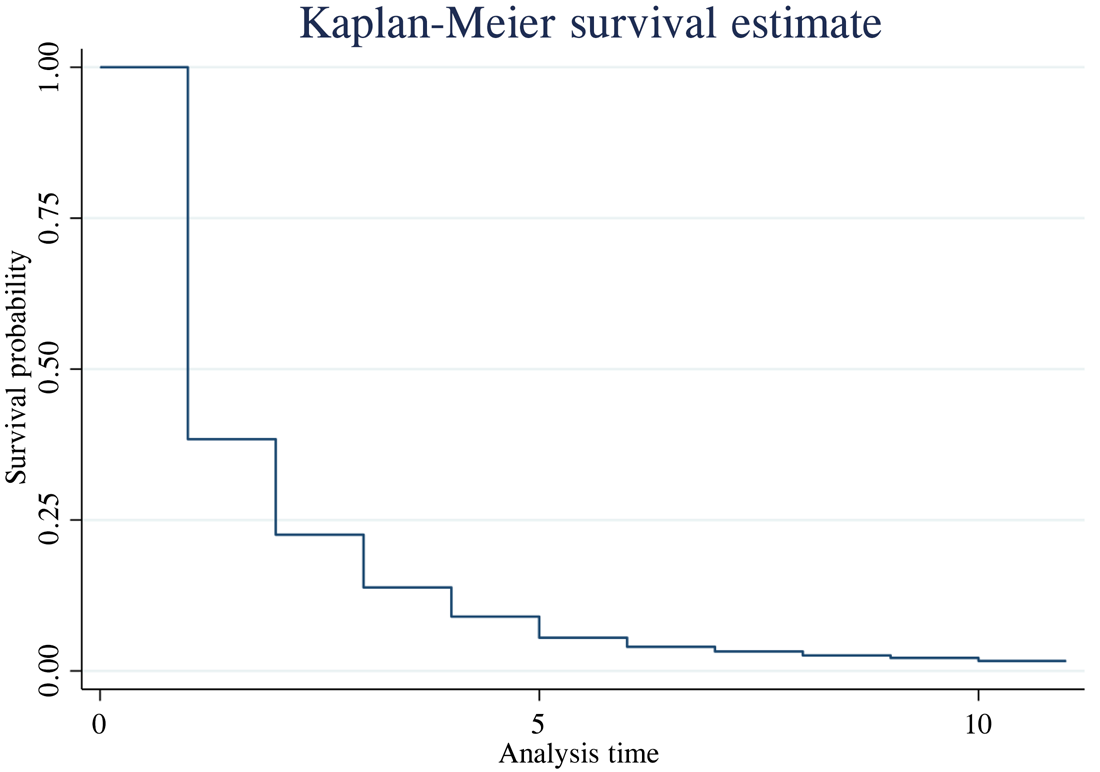
Figure 3 shows the Kaplan-Meier estimates of the survival rates for the trade relations from year-to-year. More than 60% of the established relations trade together for only one year, and more than 75% of the relations end after two years. Hardly any trade relationships survive the entire sample period of 11 years. There appears to be little variation in this survival pattern if we break down the data sample on the source country of imported wines, at least not among the large wine producers. Hence, the general pattern of short-lived trading relationships is common across wine-producing regions.
Survival Rate of Trading Partners from Year-to-Year

V. Empirical Results
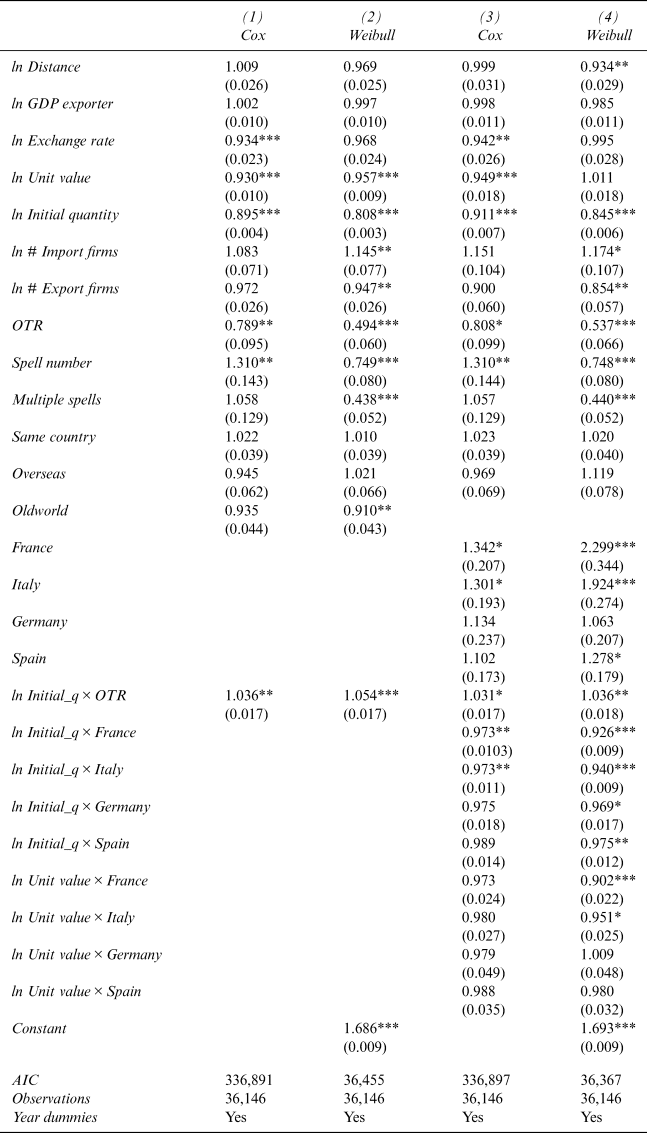
Table 2 reports the results from the Cox proportional hazard and the parametric Weibull model. The estimated coefficients from these models are hazard rates, and they are interpreted differently from OLS-estimates. Coefficients that are larger than one scale up the hazard ratio, coefficients lower than one scales the hazards down, and coefficients that equals one do not influence the hazard ratio. Models 1 and 2 in Table 2 report the estimated coefficients for the hazard rates for the Cox and Weibull models. We further include a set of country-fixed effects and interaction terms to the two models to investigate the robustness of the hazard rates—these estimations are reported in Models 3 and 4 in Table 2.

Robust standard errors in parentheses
*** p < 0.01, ** p < 0.05, * p < 0.1
a Excluding left-censored observations from the sample does not result in substantially differences.
For most of the independent variables, the magnitude of the estimated parameters remains similar in the Cox and Weibull models. Of the two estimation methods, the AIC clearly favors the Weibull model as the statistic reported in Table 2 is much lower than that of the Cox model.
The first covariate reported in Table 2 is the geographical distance to the wine-producing countries. The Distance coefficient is close to and not statistically different from one in Models 1–3, indicating that distance does not influence duration. In Model 4, we see that the estimated model indicates that increased distance to the country of origin will increase the survival probability. Trade towards distant markets may invoke larger search costs and force the trading partners to invest more in the relationships making them more stable. From the trade literature, we know that trades in perishable products are most sensitive to the geographical distance between markets.
The exporters’ GDP, with a coefficient approximately equal to one, has no impact on trade duration. Although the exporters’ GDP could proxy other characteristics of the exporting country relevant for trade duration, it is not that obvious what this should be in this particular context where we analyze flows of a specific product type to a single import market.
The estimated coefficient for the Exchange rate was lower than one and statistically significant in the Cox estimations, implying that a weakening of the exporter's currency relative to the importer's currency, NOK, increase trade duration. We find no statistical significance for this variable in the Weibull estimations, but the estimated coefficients are lower than one, as in the Cox model.
The unit value is statistically significant at the 1% level in Models 1–3, indicating that an increase in the unit value increases the duration of the trading partners’ relationship. In Model 4, this effect is picked up by the interaction term between the unit value and imports from France and Italy. The overall interpretation of the results is that wine quality is a positive factor for trade duration. The results with respect to wine prices are an extension of the findings in Crozet, Head, and Mayer (Reference Crozet, Head and Mayer2011), who analyzed export propensity. The findings indicated that not only trade propensity was affected by wine quality, but also the duration of trade relationships. The results from Model 4 single out France and partly Italy as countries where wine quality influences trade duration, while this does not seem to be the case for Germany and Spain. This asymmetry could be influenced by strong competition for French and Italian wines. Such competition may motivate additional sunk investments in long-term relationships to access high-quality wines from these regions.
Another highly significant factor in all four models is Initial quantity. A large first shipment between a specific wine exporter and importer pair increases the probability of a lasting trade relationship between those two partners. A large initial trade may signal commitment. From Model 4, we see that initial trade is particularly important for trade relationships involving one of the four largest countries of origin. Furthermore, Models 2 and 4 shows that while growth in the number of importers increases the hazard of a breakdown in trade relationships, the number of exporters have the opposite effect. This asymmetric effect could be because wine exporters have several international markets where they can sell their products. In contrast, importers compete for limited shelf space in the Norwegian wine monopoly's retail stores and in Norwegian restaurants, and for importing the best-selling wines to the Norwegian public.
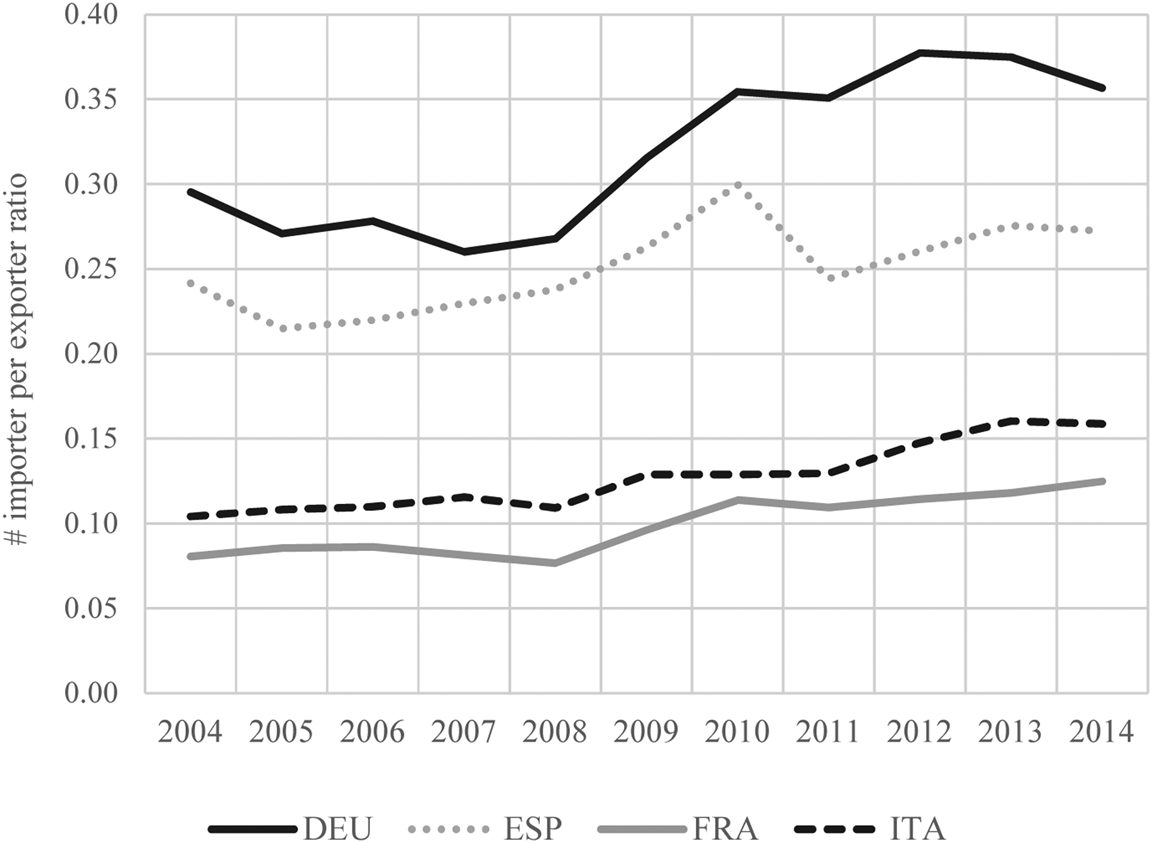
This finding lends support that a tougher competitive climate has influenced trade duration in Norwegian wine imports. This argument is reinforced by the development of the importer/exporter ratio from the four largest countries of origin over the period, as shown in Figure 4.
Number of Importers per Exporters for the Four Most Important Wine Exporting Countries to the Norwegian Wine Import Market

The estimated coefficients for the OTR-dummy are lower than one and highly statistically significant across all models. Partners that already know each other have a higher probability of establishing new lasting relations than partners that do not have prior trading experience with each other. When partners that know each other from previous trades create short new relations, these will typically involve a large initial volume. We suspect that this, for instance, could be the case when well-known partners become aware of a particularly good wine season in a country that they normally do not source wine from, and thus collaborates in one-off imports.
We get conflicting results between the Cox model and the Weibull model when it comes to the Spell number variable. The estimated hazard rates in the Cox model indicates that hazard is increasing in Spell number, while the opposite is true for the Weibull model. This difference is probably due to the underlying assumptions of the two models. We find the results from the Weibull model to be the most appropriate in this case since this parametric model does not assume that hazard is constant over time. Moreover, as previously mentioned, the AIC statistics favor the Weibull model as the preferred choice. The interpretation of the Weibull coefficients is that as the number of the spells between trading partners increase, so does the survival probability of new trade relationship.
The Cox models indicate hazard rates larger than one, but not significant, for trade relationships that are associated with multiple spells. The two Weibull estimations indicate that the presence of multiple spells decreases hazard significantly. This finding is not in line with the common findings in the trade literature but may indicate an interesting characteristic of the wine market. An importer who knows an exporter from earlier relations, and knows that this firm can source high-quality wines, could be willing to establish a new relation when trying, for example, to source the same type of wine as they have previous trading experience in. We also know that not all partners source from all countries each year, for example, due to bad seasons with low quality. Given these characteristics of wine trade, it is not surprising to find lower hazards associated with the presence of multiple spells.
Neither the Same country dummy nor the Overseas dummy is significant. As it is only in a small fraction of the trade relationships where the exporters actually are located in a different country than the origin country of the wine, it is not very surprising that the Same country variable does not give a significant effect. The mean value of the Same country dummy reported in Table 1 indicates that almost 95% of trades correspond to exporters being situated in the same country where the wine they export is produced. Note that we attempted to remove the Overseas dummy as it could be correlated with distance. However, the Distance parameters remained similar in either model. This may be due to the dominance of European producers.
VI. Conclusions
The global wine trade continues to grow with new agents entering the market (Balogh and Jámbor, Reference Balogh and Jámbor2017). The increased competition and participation in the wine market are bound to influence trade dynamics, including the duration of trade relationships. In this article, we have access to highly-disaggregated data on wine imports to Norway, which allows us to link exporter and importer firms. This high-quality data is used to analyze how the duration of firm-to-firm trade relationships are affected by different factors in an 11-year period stretching from 2004 to 2014. The first result of the study is that most trade relationships are very short. This is a result that aligns with previous findings in the general trade literature, both for the duration of overall trade between countries as well as for trade at the product level.
The main focus of this study is how the trade duration is influenced by wine quality, as reflected by the price (Oczkowski and Doucouliagos, Reference Oczkowski and Doucouliagos2014). Wine is a highly-differentiated product with a large spectrum of different qualities and tastes. We show that imports of higher-priced wines are associated with longer duration of trade relationships. As expected, a weakening of the exporter's currency seems to have contributed to lengthening the duration of trade relationships. A growing share of Norwegian wine imports has come from France, Germany, and Italy. Especially Italy's market share grew sharply from 19% in 2004 to 34% in 2014. This corresponds to a period when, for most of the time, the long-term trend of the euro has been of weakening relative to the import currency NOK. This indicates that the exchange rate has influenced changes in the relative pattern of the trade relationship, geographically speaking.
The findings underscore the importance of the price, the size of the initial trade quantity, and the on-going trade between the partners for the duration of trade relationships. Another interesting result is that there is an asymmetric effect of the number of importers from the number of exporters. We argue that this result arises because for most wine sellers, Norway is just one of several markets where they can export their product, while for Norwegian importers, there is a competition for a limited number of wines known to sell among Norwegian consumers. The fact that there exists a monopoly of retailing wines in Norway makes shelf-space even limited compared to the normal where wine is also retailed in grocery stores, supermarkets, and specialized wine retailers. The limited shelf-space available to efficiently market imported wines can further enhance competition among importers. This underscores that particular market institutions also can influence competition.