



1. Introduction
The shock wave–turbulent boundary layer interaction (STBLI) is commonly observed in both the internal and external flows of high-speed aircraft, and has significant effects on vehicle and component performance. This classic topic has been investigated extensively in recent decades (Dolling Reference Dolling2001). The STBLI typically adversely affects aerodynamic performance, leading to a thicker boundary layer or even flow separation. Consequently, the total pressure loss and flow distortion increase significantly. The flow unsteadiness caused by the STBLI often results in downstream oscillations that can be severe in certain cases, potentially damaging the airframe or engine. However, the STBLI does not necessarily lead to entirely negative consequences. For instance, using the enhanced fluctuation to improve the mixing of fuel and air within a scramjet combustor is feasible (Yang, Kubota & Zukoski Reference Yang, Kubota and Zukoski1993). With a comprehensive understanding of the physical processes, sophisticated and effective flow control techniques deeply rooted in the principles of fluid physics can be developed. These techniques can be employed directly in design, facilitating the creation of optimal designs for aerodynamic devices while circumventing undesired consequences or harnessing potential advantages. Scholars focus primarily on two aspects when studying the STBLI: the mean flow characteristics, such as the pressure increase within and scale of the separation, and the unsteadiness in the interaction, such as low-frequency oscillations.
The classic theory proposed by Chapman, Kuehn & Larson (Reference Chapman, Kuehn and Larson1958) considers the effects of both the Reynolds number and the Mach number, enabling the prediction of the pressure increase within the separation bubble. Another important contribution of this theory is that it reveals the fundamental features of the STBLI, specifically, that the initial pressure increase and extent length caused by the interaction are related only to the local flow parameters and are independent of the shock intensity, whereas the shock intensity affects only the pressure increase downstream. The length scale of the separation region in the STBLI is of particular interest because of its significance in the geometric design of aircraft. Furthermore, this length is commonly used as a normalisation factor for the low-frequency oscillation of the STBLI. Souverein, Bakker & Dupont (Reference Souverein, Bakker and Dupont2013) developed a separation length scaling method for the STBLI based on the mass conservation of flow in both the upstream and downstream STBLI regions. The derived relationship between the normalised interaction length of the STBLI region and the strength of the STBLI covers wide ranges of Mach numbers, Reynolds numbers and shock strengths, exhibiting only a moderate scatter of approximately  $15\,\%$.
Studies on the unsteadiness of the STBLI have broadly sustained the perspective of the STBLI as a forced dynamical system. In cases without separation, investigations have suggested a direct relationship between the movement of the shock and the turbulence that it encounters (Debieve & Lacharme Reference Debieve and Lacharme1986; Lee, Lele & Moin Reference Lee, Lele and Moin1993). The occurrence of shock unsteadiness at frequencies significantly lower than those in unseparated cases has also been observed when the shock is sufficiently strong to induce separation in a general sense (Piponniau et al. Reference Piponniau, Dussauge, Debieve and Dupont2009; Priebe et al. Reference Priebe, Tu, Rowley and Martin2016). According to Dupont, Haddad & Debieve (Reference Dupont, Haddad and Debieve2006), the interaction region can be divided into five main sections, each encompassing typical time scales that span two orders of magnitude. The analysis of the source of this low-frequency unsteadiness revealed two broad mechanisms that are responsible for driving the pulsations in the separation bubble. First is the ‘upstream mechanism’, in which the separation bubble is influenced by the incoming boundary layer. Studies have indicated connections between the variations in momentum, pressure and velocity within the turbulent boundary layer prior to separation and the movements of the separation shock (Andreopoulos & Muck Reference Andreopoulos and Muck1987; Gramann & Dolling Reference Gramann and Dolling1990; Erengil & Dolling Reference Erengil and Dolling1991a,Reference Erengil and Dollingb; Beresh, Clemens & Dolling Reference Beresh, Clemens and Dolling2002; Ganapathisubramani, Clemens & Dolling Reference Ganapathisubramani, Clemens and Dolling2006). The ‘downstream mechanism’ is related to the separation bubble and the shear layer, which dominate the pulsation for large length scales. Previous studies have extensively highlighted the potential driving force behind the formation of the shear layer over the separation bubble, and the subsequent entrainment of fluid (Piponniau et al. Reference Piponniau, Dussauge, Debieve and Dupont2009; Priebe & Martin Reference Priebe and Martin2012; Estruch-Samper & Chandola Reference Estruch-Samper and Chandola2018). Feedback mechanisms within the separation bubble have also been considered as sources of low-frequency oscillations in many studies (Pirozzoli, Grasso & Gatski Reference Pirozzoli, Grasso and Gatski2004; Wu & Martin Reference Wu and Martin2008). Scholars have also argued that low-frequency unsteadiness does not arise exclusively from external forcing, whether it occurs upstream or downstream from the separation shock. Instead, this unsteadiness emerges as an inherent characteristic of the coupled system (Theofilis Reference Theofilis2011; Touber & Sandham Reference Touber and Sandham2011; Hildebrand et al. Reference Hildebrand, Dwivedi, Nichols, Jovanovic and Candler2018; Hao et al. Reference Hao, Cao, Wen and Olivier2021). Thomas, Putnam & Chu (Reference Thomas, Putnam and Chu1994), Touber & Sandham (Reference Touber and Sandham2009) and Sidharth et al. (Reference Sidharth, Dwivedi, Candler and Nichols2018) identified an unstable mode resulting from the inherent global instability of the separation bubble. Hao et al. (Reference Hao, Cao, Wen and Olivier2021) discovered a strong correlation between the emergence of secondary separation beneath the primary separation bubble and global instability. Cao et al. (Reference Cao, Hao, Klioutchnikov, Olivier and Wen2021) provided evidence of streamwise heat flux streaks even in the absence of any external disturbances.
To acquire essential insights, significant emphasis has been placed on conventional interaction involving a single interaction region. However, having only one STBLI region is considered the ideal case. Deviations from this case may occur in practical flight scenarios. For instance, in internal flows such as those related to high-speed inlets and isolators, the presence of multiple reflected shocks often results in boundary layer separation at adjacent locations (Leonard & Narayanaswamy Reference Leonard and Narayanaswamy2021; Khobragade, Unnikrishnan & Kumar Reference Khobragade, Unnikrishnan and Kumar2022). This highlights the question of whether adjacent STBLI regions interact with each other, particularly considering the inherent features of the STBLI. These include the dependence of the pressure increase at the separation point and extent length on the local flow parameters, as well as the decelerated or relaxing boundary layer downstream from the interaction region. In other words, the adverse pressure gradient may cause the separation of the STBLI region to occur earlier through the disturbed boundary layer. Previous studies have revealed the development and shedding of large vortex structures during these interactions, which result in elevated levels of turbulence far from the surface within the downstream boundary layer (Dupont et al. Reference Dupont, Piponniau, Sidorenko and Debieve2008; Graftieaux, Michard & Grosjean Reference Graftieaux, Michard and Grosjean2001). These structures remain present for several interaction lengths. Questioning the extent to which the unsteady features of the STBLI region affect other interaction regions is also important.
The objective of the present study was to examine the aforementioned issues by utilising time-resolved pressure measurements, high-speed schlieren visualisations and the particle image velocimetry (PIV) technique to investigate dual-STBLIs (incident and compression-ramp-induced STBLIs) under Mach 4.1 edge conditions. Strong STBLI zones with evident separation were sequentially set at the upstream and downstream positions, and another area was designated as a weak STBLI zone to study the influences from upstream and downstream. Six scenarios with various spacings between the two interaction regions were considered. The flow structure variations were first observed using schlieren imaging. Next, the effects of the additional STBLI on separation and reattachment were assessed. The application of PIV was utilized to characterise the state of the boundary layer following the interaction. The utilisation of time-resolved measurement techniques enabled us to analyse the dynamics of the interaction, encompassing the temporal evolution of the unsteadiness, shock behaviour, shear layer development and perturbation propagation.
2. Problem statement
The existence of various distinct types of STBLI, characterised by their geometry and the occurrence of flow separation, suggests that these phenomena may lead to fundamentally different forms of unsteadiness. Dussauge & Piponniau (Reference Dussauge and Piponniau2008) and Dussauge (Reference Dussauge2009) proposed interpretations based on the diagram presented in the black dashed box in figure 1. The upper and lower branches depict flows that are not separated and are separated, respectively. In both scenarios, a shock wave acts as an interface between the upstream and downstream layers, dividing them. The positions and motions of the shock waves vary accordingly. By considering these different components, the motion of the shock wave can be analysed from both upstream and downstream perspectives.
Schematic of the problem domain.

In a previous study (Li & Chang Reference Li and Chang2021), an intriguing observation was made: as the shock train induced by the backpressure approached the upstream STBLI region in an isolator, broadband and gradually intensifying oscillations occurred. Under constant inflow and outflow conditions, violent limit cycle oscillation of the separation shock occurred around the interaction region owing to a positive feedback mechanism within the shock train resulting from the disturbed distributions of the flow parameters caused by the STBLI (Li et al. Reference Li, Chang, Xu, Yu and Bao2021). The shock train can be considered an STBLI with far-downstream influences that are characterised by the coupling between the downstream flow and the separation shock, which extends over distances much larger than the characteristic length scale of the incoming flow (Hadjadj & Dussauge Reference Hadjadj and Dussauge2009). The STBLI at the leading edge of the shock train is essentially identical to the incident STBLI and compression-ramp-induced STBLI, both of which exhibit forced motion and intrinsic instability (Bruce & Babinsky Reference Bruce and Babinsky2008; Li et al. Reference Li, Chang, Xu, Yu and Bao2021). The downstream STBLI has been confirmed to be influenced by the upstream one in shock train cases. However, the characteristics of the upstream STBLI have been obscured by violent oscillations of the shock train. The interference between the two canonical interactions remains unknown, and the previous studies on shock trains motivate further investigation into their mutual interaction. The presence of unsteadiness, distortion of flow parameters, relaxation process downstream of the STBLI, and low-frequency mechanism give rise to several questions regarding these aspects.
(1) Will a sudden change in separation occur as two interaction regions approach one another?
(2) How does the unsteadiness progress as the two interaction regions approach one another?
(3) Does any relationship exist between the two interactions?
The current study was focused on the effects of downstream and upstream STBLIs on other interaction regions. Previous studies (Li & Chang Reference Li and Chang2021; Li et al. Reference Li, Chang, Xu, Yu and Bao2021), the themes of which are shown in the blue dashed box at the bottom of figure 1, suggest that the effects are not negligible. For better implementation and less additional interference, the upstream and downstream interactions were designed as impinging shock and compression corner interactions, respectively. To avoid transition effects, the boundary layer upstream from the incident shock was set to be fully turbulent. In corner regions, three-dimensional shock wave patterns exist. According to Li et al. (Reference Li, Chang, Xu, Yu and Bao2021) and Wang et al. (Reference Wang, Sandham, Hu and Liu2015), the dominance of two-dimensional flow characteristics increased in the central region with a higher aspect ratio of the channel (width to height) and a smaller proportion of corner flow. Thus to minimise the three-dimensional effect of the STBLI, the minimum aspect ratio for channels composed of wedges, flat plates and sidewalls was set at 2.5. We also verified the two-dimensional flow features by the planar laser scattering method and three-dimensional numerical simulations. The flow basically maintained the two-dimensional characteristics within a range of approximately 120 mm spread out near the centreline, while the three-dimensional flow area in corners remained small. Additionally, the three-dimensional dynamic mode decomposition results indicated that the shock remained predominantly two-dimensional and uniform in the spanwise direction during low-frequency motion (Priebe et al. Reference Priebe, Tu, Rowley and Martin2016). Therefore, we focused solely on analysing the low-frequency dynamics in two dimensions.
3. Experimental set-up
3.1. Wind tunnel
All tests were performed in an air-breathing supersonic wind tunnel of the National Key Laboratory of Science and Technology on Aerodynamic Design and Research at Northwestern Polytechnical University (NPU). The nominal free-stream Mach number was 4.2 at the exit of the nozzle. The facility comprised a stagnation chamber with damping screens, an interchangeable rectangular supersonic nozzle, a test section, a diffuser, and a  $200\ \text {m}^3$ vacuum tank, as shown in figure 2. Four vacuum pumps could pump the vacuum tank to a pressure of less than
 $0.1\ \text {Pa}$ in 1 h. These settings enabled sustained runs of approximately
 $10\ \text {s}$.
Diagram of the supersonic facility at NPU.

The entrance of the test section measured  $200\ \text {mm}\times 200\ \text {mm}$ (
 ${\rm width} \times {\rm height}$). The divergence of the upper and lower walls in the test section was adjusted by
 $\pm 0.5^{\circ }$ relative to the centreline, considering the development of the boundary layer along these walls. The test section contained removable modules on all four sides to mount the models and provide optical access. Two pieces of optical glass of dimensions
 $260\ \text {mm}\times 180\ \text {mm}$ were mounted on each sidewall for schlieren imaging.
The flow conditions used in this study are listed in table 1. Here,  $M_{\infty }$,
 $T_{0}$ and
 $P_{0}$ correspond to the nominal Mach number, stagnation temperature and stagnation pressure of the supersonic flow at the exit of the nozzle, and
 $U_{1}$ denotes the edge velocity on the flat plate upstream from the STBLI region. The Mach number at the flat plate, denoted as
 $M_{1}$, is
 $4.1\pm 0.02$, slightly lower than the free-stream Mach number 4.2, resulting in a unit Reynolds number
 $Re^{*}=4.3\times 10^{6}\ \text {m}^{-1}$. This discrepancy can be attributed to the deceleration caused by a shock generated by the forced transition device positioned at the leading edge of the flat plate.
Summary of flow conditions.

3.2. Test model
Figure 3 provides a schematic representation of the model. A full-span, 610 mm long steel plate with a  $5^{\circ }$ lead was employed to generate the boundary layer for all tests. The plate was connected to the bottom wall at height
 $60\ \text {mm}$ by using a rib plate. The rib plate was specifically designed to offset the divergence angle of the lower wall. Therefore, the full-span plate was parallel to the free-stream flow. The forced transition method was also employed to facilitate the boundary layer transition and to ensure a turbulent boundary layer upstream from the STBLI zone. The downstream STBLI was produced by using a compression corner with deflection angle
 $24^{\circ }$ at the end of the plate. The upstream STBLI was generated by employing a two-dimensional wedge suspended from the upper wall. Different angles were designed to achieve disparate shock intensities. The vertical distance between the tip of the wedge and the plate surface was
 $80\ \text {mm}$. This wedge could be moved streamwise in
 $10\ \text {mm}$ intervals, resulting in different distances between the two STBLI regions.
Diagram of the test section, with plate model, wedge and the distribution of pressure transducers.

As shown in figure 3, the incident shock  $i$ intersects the centreline of the plate surface at point
 $o_{1}$ under inviscid conditions. The distance between
 $o_{1}$ and
 $o_{2}$ (the origin of the ramp at the end of the plate) is defined as
 $d$. The configurations of the two cases are presented in table 2, with the upstream deflection angles of the wedge being
 $3^{\circ }$ and
 $10^{\circ }$. The shock generator was adjusted with a spacing of approximately
 $10\ \text {mm}$ along the flow direction during the test to obtain six distances between the impingement point of the incident shock and the origin of the compression corner. The values of
 $d$ obtained from schlieren imaging are also listed in table 2.
Geometric parameters of test model.

3.3. Test programme
Different diagnostic methods were used throughout the tests. The tests aimed to determine the flow structure of the interference between the two interaction regions and to provide a physical interpretation. High-frequency pressure measurements were used to investigate the unsteadiness and communication between the two interaction regions. Although commonly utilised for qualitative analysis, the schlieren imaging technique directly correlates the light intensity of the schlieren image with the density gradients in the flow, thereby providing valuable information. The evaluation of the flow oscillation frequencies can be facilitated by utilising time-resolved flow field information. High-speed schlieren imaging is a superior method of acquiring extensive datasets. The PIV measurements were also utilized to quantitatively characterise the state of the boundary layer through its interactions with shock waves.
3.3.1. Time-resolved pressure measurements
Up to 31 fast-response pressure transducers were set in the centreline of the plate and flushed onto the plate surface, each having natural frequency  $200\ \text {kHz}$, as shown schematically in figure 3. Transducers labelled T1–T25 were spaced
 $5.0\ \text {mm}$ apart in the streamwise direction, starting
 $389.0\ \text {mm}$ from the leading edge, with sensor T25 exactly
 $1.0\ \text {mm}$ upstream from the origin of the ramp. The other six transducers, labelled T26–T31, started
 $5.0\ \text {mm}$ from the origin of the ramp. Two different transducer models, namely, Kulite XCS-062-15A and XCQ-062-30A, were utilised in the study. These transducers were rated at
 $103.4\ \text {kPa}$ and
 $206.8\ \text {kPa}$ absolute, respectively. The transducers were connected to two 16-bit A/D converters (NI PCI-6338 Multifunction DAQ) and then recorded simultaneously at
 $500\ \text {kS}\ {\text {s}^{-1}}$ (with a custom NI LabVIEW Virtual Instrument) for each channel. A
 $200\ \text {kHz}$ low-pass filter was used to remove aliasing effects. The auxiliary amplifier was used to achieve a high-level pressure signal, but it imposed a constraint on the response at approximately
 $40\ \text {kHz}$. The fast-response transducers were calibrated by obtaining readings at 11 different pressure points ranging from
 $0.5\ \text {kPa}$ to
 $100\ \text {kPa}$, using a Wika Mensor pressure controller (CPC6000). The linear fitting method was employed to establish a correlation between the recorded pressure and mean voltage. The deviation of each data point from the calibration line was found to be within
 $0.5\,\%$. Subsequently, a linear regression model was utilised to convert the voltage readings of the transducer into corresponding pressure values.
The power spectral density (PSD), cross-correlation and coherence function were estimated over a duration 8.0 s. The dataset was divided into 487 blocks with a  $50\,\%$ overlap. Each block consisted of
 $2^{14}$ samples, resulting in frequency resolution
 $\Delta f=30.5\ \text {Hz}$. To calculate the PSD, the Welch method was employed along with a Hanning window. The correlation coefficient between two points (denoted
 $x$ and
 $y$) is defined as
 $\rho _{xy}(\tau )=R_{xy}(\tau )/\sqrt {(R_{xx}(0)\,R_{yy}(0))}$, where
 $R_{xy}(\tau )$ is the cross-correlation function between the two signals,
 $\tau$ is the lag time, and
 $R_{xx}(0)$ and
 $R_{yy}(0)$ are the autocorrelation functions for zero lag time, with the function normalised to the range
 $\pm 1$. The magnitude-squared coherence estimate is a frequency-dependent function that ranges from 0 to 1. These values indicate the level of correspondence between signal
 $x$ and signal
 $y$ at different frequencies. This coherence is defined as
 $C_{xy}(\,{f})={\lvert P_{xy}(\,{f}) \rvert }^{2}/ \sqrt {(P_{xy}(\,{f}) \, P_{xy}(\,{f}))}$, where
 $P_{xy}(\,{f})$ represents the cross-PSD between the two signals, and
 $P_{xx}(\,{f})$ and
 $P_{yy}(\,{f})$ are their respective auto-spectral densities.
3.3.2. High-speed schlieren visualisations
A conventional Z-type schlieren system was used to visualise the flow structures with different density gradients. Two concave mirrors, each with diameter  $200\ \text {mm}$ and focal length
 $2000\ \text {mm}$, were utilised to collimate the light passing through the test section and refocus it on the opposite side. A xenon lamp was directed towards an aperture in the form of a narrow opening positioned at the focus point of the concave mirror. On the opposite side of the test section, another concave mirror collected the light rays, and a knife edge was placed at the focus to visualise the density gradients of interest. A horizontal knife edge was employed to identify vertical gradient changes, thereby capturing the flapping behaviour of the shear layer. Schlieren visualisations were recorded using a Phantom 340L high-speed camera at
 $4\times 10^{4}$ fps. For all runs, the image resolution was
 $512\ \text {pixels}$ in the horizontal direction, and
 $100\ \text {pixels}$ in the vertical direction. A duration of
 $2\ \mathrm {\mu } \text {s}$ was chosen as the exposure time, ensuring effective freezing of the shock structures in each image.
Time-resolved image sequences can provide transient information in the flow field, assuming a linear relationship between the density gradient and light intensity in the schlieren image. Therefore, the intensity is closely related to the motion of vortex structures, shear layers or shock waves. The light intensity of each pixel in the image sequence is denoted as  $I(i,j,n)$, where
 $I$ represents the intensity, and
 $i$ and
 $j$ represent the horizontal and vertical positions in the image. The snapshot number
 $n$ ranges from 1 to
 $3.2\times 10^5$. The time series that describes the evolution of light intensity at a specific pixel
 $(i,j)$ can be represented as
 $I_{i,j}(n)$, which also indicates the change in the density gradient at that location during the selected time interval. Statistical information such as the standard deviation of the flow field captured by schlieren imaging can be derived from these data. The standard deviation map clearly highlights the presence of significant intensity fluctuations in the region in which the shock wave and edge of the boundary layer are influenced by the breathing of the separation bubble.
The spatial and temporal correlation between flow structures, such as shock waves and vortices, allows for the extraction of large-scale coherent patterns from the time series. The methodology known as spectral proper orthogonal decomposition (SPOD) offers a collection of orthogonal modes that exhibit distinct frequencies and effectively capture the organised evolution of flow structures across both time and space domains (Towne, Schmidt & Colonius Reference Towne, Schmidt and Colonius2018). In the present study, we utilised SPOD analysis with Hanning window function and 155 blocks with  $50\,\%$ overlap of
 $2^{12}$ images to reveal the characteristic of flow structures with low-, medium- and high-frequency oscillations in the STBLI.
3.3.3. The PIV measurements
We employed PIV to obtain quantitative measurements of the flow field structure and boundary layer conditions. The flow was illuminated by a double-pulsed Litron Nano200-15 Nd:Yag laser with wavelength 532 nm. The repetition rate of the laser was 15 Hz, the typical pulse energy was approximately 200 mJ, and the pulse duration was 6 ns. The laser sheet was emitted vertically onto the centreline of the flat-plate wall in the test section through an optical glass window installed on the roof.
The flow was seeded with aerosol oil particles, which had average diameter approximately  $1.0 \ \mathrm {\mu }{\text {m}}$. These seeding particles were supplied to the tunnel through a reservoir consisting of a thin-walled pallet-sized (
 $4\times 4\times 4\ \text {m}^3$) plastic bag, similar to the one developed by Tichenor, Humble & Bowersox (Reference Tichenor, Humble and Bowersox2012). The reservoir was positioned upstream of the tunnel and connected directly to the inlet of the stagnation chamber. Initially, particles were injected into the reservoir, followed by even mixing using an air pump to inflate the bag to the required volume for a run. Particle concentration in the reservoir was regulated by adjusting the operating time for particle atomisation during injection. The reservoir concentration was determined based on experience to ensure a high particle concentration in the image captured. Rings attached to the reservoir were tethered with ropes to control bag deformation as its contents are emptied (similarly to a bellows). Upon opening of the butterfly valve, downstream vacuum facilitates suctioning of particles into the test section along with main flow. The Stokes number of the particle was approximately 1.1 (
 ${\rm Stokes}\ {\rm number} = \tau _{p}/\tau _{f}$, with
 $\tau _{p}\approx 18.9 \ \mathrm {\mu }{\text {s}}$ representing the time scale of the particle). Based on the findings by Brooks et al. (Reference Brooks, Gupta, Smith and Marineau2018), it has been demonstrated that particle lag acts as a low-pass filter on fluctuating velocity PSD, thereby limiting measurable energy content. The flatter spectrum observed in wall-normal fluctuating velocity appears to render this component more susceptible to such effects compared to the streamwise component. Consequently, in this study, we employed quantitative measurements of streamwise velocity to characterise the state of the boundary layer.
To minimise the presence of high-intensity pixel regions near the wall, the steel wall surface within the field of view (FOV) was meticulously polished to restrict scattered light, and the cameras were positioned at a height comparable to that of the wall. Particle images were captured using an Impex CXP-C5341 CMOS camera with spatial resolution  $5312 \times 3040$ pixels. The time offset between the double images was set at 440 ns. The FOV of the entire dual-STBLI regions measured
 $156\ \text {mm}\times 90\ \text {mm}$ in both streamwise and normal wall directions, respectively, with spatial resolution
 $34.1\ \text {pixel}\ \text {mm}^{-1}$. The PIV images were processed using PIVlab (Thielicke & Sonntag Reference Thielicke and Sonntag2021) with standard iterative multi-step interrogation areas of
 $32\times 32$ pixels, and a
 $50\,\%$ overlap in both horizontal and vertical directions. For measurements of the undisturbed turbulent boundary layer and local interactions, the FOV was set at
 $48.6\ \text {mm}\times 27.9\ \text {mm}$, with scaling
 $109.3\ \text {pixel}\ \text {mm}^{-1}$. The initial and final window sizes corresponded to
 $128\times 128$ pixels and
 $48\times 48$ pixels, respectively, with a
 $50\,\%$ overlap. Furthermore, to allow convergence of conditional mean quantities, approximately 1500 statistically independent velocity fields were acquired.
3.4. Upstream turbulent boundary layer
The flow parameters of the undisturbed boundary layer were determined by utilising measurements from PIV. The measurements were conducted  $380\ \text {mm}$ from the leading edge of the plate. The mean velocity profile is presented in figure 4(a). The incompressible theory is extended to include compressible flows by modifying the dimensional analysis to account for changes in density using the van Driest effective velocity (van Driest Reference van Driest1951). Subsequently, this velocity is combined with the Walz equation (Walz Reference Walz1969) and the perfect gas law, assuming a constant pressure throughout the boundary layer. This integration yields a closed-form equation
Turbulent boundary layer conditions. (a) Velocity profile of the upstream turbulent boundary layer obtained by PIV and Pitot tube. (b) The PSD based on wall pressure (blue) and the coherence  $C_{xy}$ (red) between the wall pressure within the upstream boundary layer and separation. The grey shaded area indicates the region outside sensor frequency response (>40 kHz).

 \begin{equation} u^* = \frac{u_{e}}{b}\sin^{{-}1}\left(\frac{2b^2(u/u_{e})-a}{\sqrt{(a^2+4b^2)}}\right), \end{equation}
where
 $$\begin{gather} a=\left(1+r\,\frac{\gamma-1}{2}\,{M_{e}}^2\right)\frac{T_{e}}{T_{w}}-1, \end{gather}$$
 $$\begin{gather}b^2=r\,\frac{\gamma-1}{2}\,{M_{e}}^2\left(\frac{T_{e}}{T_{w}}\right), \end{gather}$$
and  $r=Pr^{1/3}=0.89$ represents the recovery factor. For the case of an adiabatic zero-pressure-gradient flat-plate compressible turbulent boundary layer, when the recovery temperature is equal to the wall temperature, we have
 $a=0$. And the velocity profile in the log layer is defined as
 \begin{equation} {u_{vd}}^+ = \frac{u^{*}}{u_{\tau}}=\frac{1}{\kappa}\log\left(\frac{u_{\tau}y}{\upsilon}\right)+C, \end{equation}
where  $\kappa =0.41$ and
 $C=5.2$. Coles (Reference Coles1956) extended the log law into the outer scaling region by adding a wake function to describe the departure from the log layer. The derived law of the wake,
 \begin{equation} {u_{vd}}^+ = \frac{1}{\kappa}\log \left(\frac{u_{\tau}y}{\upsilon_{w}}\right)+C+\frac{2\varPi}{\kappa}\sin^2\left(\frac{\rm \pi}{2}\,\frac{y}{\delta_{1}}\right), \end{equation}
remains applicable throughout the logarithmic layer to the outer region, encompassing the intermediate overlap.
The statistical uncertainty associated with the mean velocity, due to limited realisations, is less than  $1\,\%\,U_{1}$. The transformed velocity profile matches well with the standard log law, and a distinct wake component characteristic of turbulent boundary layers can be identified clearly, which aligns with Coles’ law of the wake (Coles Reference Coles1956). The friction velocity was obtained by making a least squares fit to the law of the wake of the measured velocity profile. According to the PIV data, the boundary layer thickness
 $\delta _{1}$ measured
 $8.8\ \text {mm}$
 $(99\,\%\,U_{1})$, while the displacement thickness
 $\delta _{1}^{*}$ was found to be
 $3.6\ \text {mm}$. The momentum thickness
 $\theta$ was determined as
 $0.4\ \text {mm}$, and the shape factor
 $H$ was calculated as 8.2. Additionally, the Reynolds number
 $Re_{\theta }$ based on momentum thickness was estimated at
 $1.9\times 10^3$. These flow conditions are summarised in table 3. The reference flow is further documented by presenting a sample PSD graph in figure 4(b), which illustrates the wall pressure within the undisturbed boundary layer. The fluctuation energy remains broad and consistent across the low-frequency range, which is in accordance with the results of high-speed flow experiments conducted by Beresh et al. (Reference Beresh, Henfling, Spillers and Pruett2011). Furthermore, we examined the potential correlation between the pressure fluctuations in the incoming flow and those in the recirculation region. Figure 4(b) illustrates the coherence between the wall pressure measurements within the incoming boundary layer and at the separation shock foot. This coherence suggests that a minimal correlation exists between the pressure fluctuations in the upstream boundary layer and low-frequency unsteadiness near the separation.
Summary of flow conditions.

4. Mean flow organisation
4.1. Expanded separation: the role of a retarded boundary layer
Time-averaged schlieren images were used to investigate the overall separation trends of the interactions. The interference between weak interacting flows originating from different upstream shock impact locations and a strong STBLI is illustrated in figure 5. Furthermore, the mean wall pressure normalised by the free-stream pressure and the relative standard deviation  $\sigma _{p}/p_{w}$ along the centreline for each case are also presented. The incident shock
 $i$, as shown in figure 5(a), impacts approximately
 $52\ \text {mm}$ upstream from the origin of the compression corner (
 $x=0\ \text {mm}$). For ease of comparison in the subsequent cases, we define the impinging location as the intersection between the incident shock extension line and the wall surface in the inviscid flow; however, because of the upstream bending of the incident shock beneath the boundary layer, the actual shock foot is positioned
 $5\ \text {mm}$ upstream from this impinging location. Reflected shock
 $ii$ is relatively weak because of the small deflection angle of the wedge. The nominal Mach number downstream from the first STBLI region was 3.89, and the compression-ramp-induced STBLI led to a separated boundary layer. The wall pressure distribution reveals the presence of two pressure increases: one caused by the incident shock, and the other induced by the shock at the compression corner. The separation point captured by the schlieren image is approximately
 $6\ \text {mm}$ upstream from the corner. The local maxima for
 $\sigma _{p}/p_{w}$ can be employed to identify the shock foot. The peak observed at T7 may have been caused by a spanwise shock wave that occurred because of the gap between the test section and either the nozzle or the window. The interaction extent
 $L_{{ext}}$, which is defined as the distance between the origin of the interaction and the location of the separation point of the compression-ramp-induced STBLI identified by wall pressure measurements, is approximately
 $15\ \text {mm}$.
Distributions of wall pressure and relative standard deviation for case A with different spacings between the two interaction regions, along with the mean flow structures: (a)  $d=52\ \text {mm}$, (b)
 $d=30\ \text {mm}$, (c)
 $d=19\ \text {mm}$, (d)
 $d=10\ \text {mm}$.

When the incident shock shifts  $10\ \text {mm}$ downstream (
 $d=41\ \text {mm}$), besides the displacement of the incident shock and slight expansion of the separation region, no significant changes are observed in the flow field depicted in figure 5(a); therefore, detailed flow information is not provided here. Notably, even though the upstream STBLI is relatively weak, the turbulence in the incoming boundary layer is distorted by its passage across the shock wave, then is convected downstream and contributes to the formation of a new boundary layer. In addition, the adverse pressure gradient caused by the incident shock cannot be ignored. The STBLI at the compression corner encounters a progressively incomplete boundary layer as the incident shock moves downstream. The presence of such a disturbed boundary layer (retarded boundary layer) is thought to affect the flow parameters at the downstream separation, such as shear stress. According to the free-interaction theory, these flow parameter variations can affect both the initial pressure increase and the length of the region associated with the separation. However, owing to either the limitations in the transducer distribution or a relatively weak STBLI, no significant effect is observed, and
 $L_{{ext}}$ remains unchanged in these two scenarios.
The incident shock in figure 5(b) shifts further downstream with  $d=30\ \text {mm}$, and the downstream STBLI also undergoes a significant change in this scenario. Notably, although the displacement of the shock foot remains consistent with the previous observations (
 $d$ changes from 52 mm to 41 mm and then to 30 mm, corresponding to a variation of 5 mm in the shock foot position towards upstream), a sudden and substantial increase in
 $L_{{ext}}$ occurs, where
 $L_{{ext}}$ reaches
 $40\ \text {mm}$. This length is more than twice the previous length. Additional shock waves for which the origin location (time-averaged) is consistent with the upstream influence (UI) are more perceptible in this scenario. The intensity and shock angle at the UI are greater for the downstream interaction than for the upstream one, indicating that flow deflection exceeds that caused by the upstream shock. The gradual rise in pressure towards the separation point can be attributed to both the combination of the incident shocks and the UI resulting from the downstream STBLI.
The incident shock in figure 5(c) undergoes a displacement of an additional  $10\ \text {mm}$. In the absence of interference between the two interaction regions, the impingement point of the upstream incident shock should ideally align with the starting point of the UI as shown in figure 5(a). However, the time-averaged schlieren image reveals a significant change in the origin of the compression wave as it crosses the impinging point of the upstream incident shock. Despite this difference, no shift in the location of the separation point identified by the schlieren image compared with that depicted in figure 5(b) is apparent. The peak position of
 $\sigma _{p}/p_{w}$ also exhibits a notable displacement, which is consistent with the alterations observed in the schlieren image depicting the compression wave. The significant reduction in the skin friction coefficient within the interaction region is a crucial characteristic of the STBLI, and based on the free-interaction theory, the interaction extent
 $L_{{ext}}$ is inversely proportional to the skin friction coefficient. From this phenomenon, we can infer that the upstream STBLI region overlaps with the initial portion of the downstream STBLI region. The sudden change in
 $L_{{ext}}$ results from drastic changes in the local flow conditions at the separation point of the downstream STBLI. An evident extension of the separation is observed in figure 5(d), whereas the length
 $L_{{ext}}$ appears to be consistent with that in figure 5(a). In this scenario, the shock foot has already passed the impingement point of the upstream incident shock; thus the incident shock no longer affects the flow parameters at separation.
Even with a small deflection angle, the impact of the incident shock is evident. Figure 6 illustrates the variation in the shock foot position at the compression corner in case A. Initially, the shock foot position changes linearly with  $d$, which aligns with the gradual variations in the flow parameters within the boundary layer downstream from the first STBLI region. However, when
 $d$ reaches
 $19\ \text {mm}$, a shift in the shock foot position occurs. According to the free-interaction theory, the local flow parameters affect the extent of the interaction, resulting in changes in the UI; however, the local flow does not affect the separation. The superposition of pressure gradients also plays a crucial role in this situation. A greater length is required for the development of the separation shear layer (flow acceleration) to achieve a larger pressure increase. In addition, the separation can be facilitated by the presence of a retarded boundary layer following the interaction region.
Variation of the shock foot position in case A. These locations were determined according to the peak of the relative standard deviation.

The mean flow behaviour is also described by the average streamwise velocity field in figure 7(a). The contour lines are densely distributed around dimensionless velocity 1.0, making the incident shock visible despite its relatively weak intensity. The distorted boundary layer downstream from the first STBLI region seems to exhibit a gradual increase in thickness at a relatively modest rate. The profiles of the streamwise velocity in the wall-normal direction at  $x=25\ \text {mm}$ are shown in figure 7(b). When the first STBLI is at a distant location, such as
 $d=52$ and
 $30\ \text {mm}$, no significant change occurs in the boundary layer state upstream from the interaction region at the compression corner. However, when the incident shock continues to move downstream (
 $d=19\ \text {mm}$), a notable deficit is observed in the streamwise velocity. This deficit caused by an adverse pressure gradient could be due to either the upstream incident shock or forward propagation of the adverse pressure gradient from the downstream interaction region. The comparison of the first two scenarios reveals that even in the latter case, the deficit in the velocity profile is ultimately attributed to the alteration of the local boundary layer state caused by the upstream incident shock wave.
Mean streamwise velocity distribution  $\bar {u}/U_1$ in case A. (a) Streamwise velocity contours from
 $-0.2$ to 0.9 in increments of 0.1, and from 0.9 to 1.0 in increments of 0.01. (b) Streamwise velocity profiles with various
 $d$ at
 $x=-25\ \text {mm}$.

In the scenario in which  $d=19\ \text {mm}$, small-field-of-view PIV measurements were conducted in the region between
 $x= -40\ \text {mm}$ and
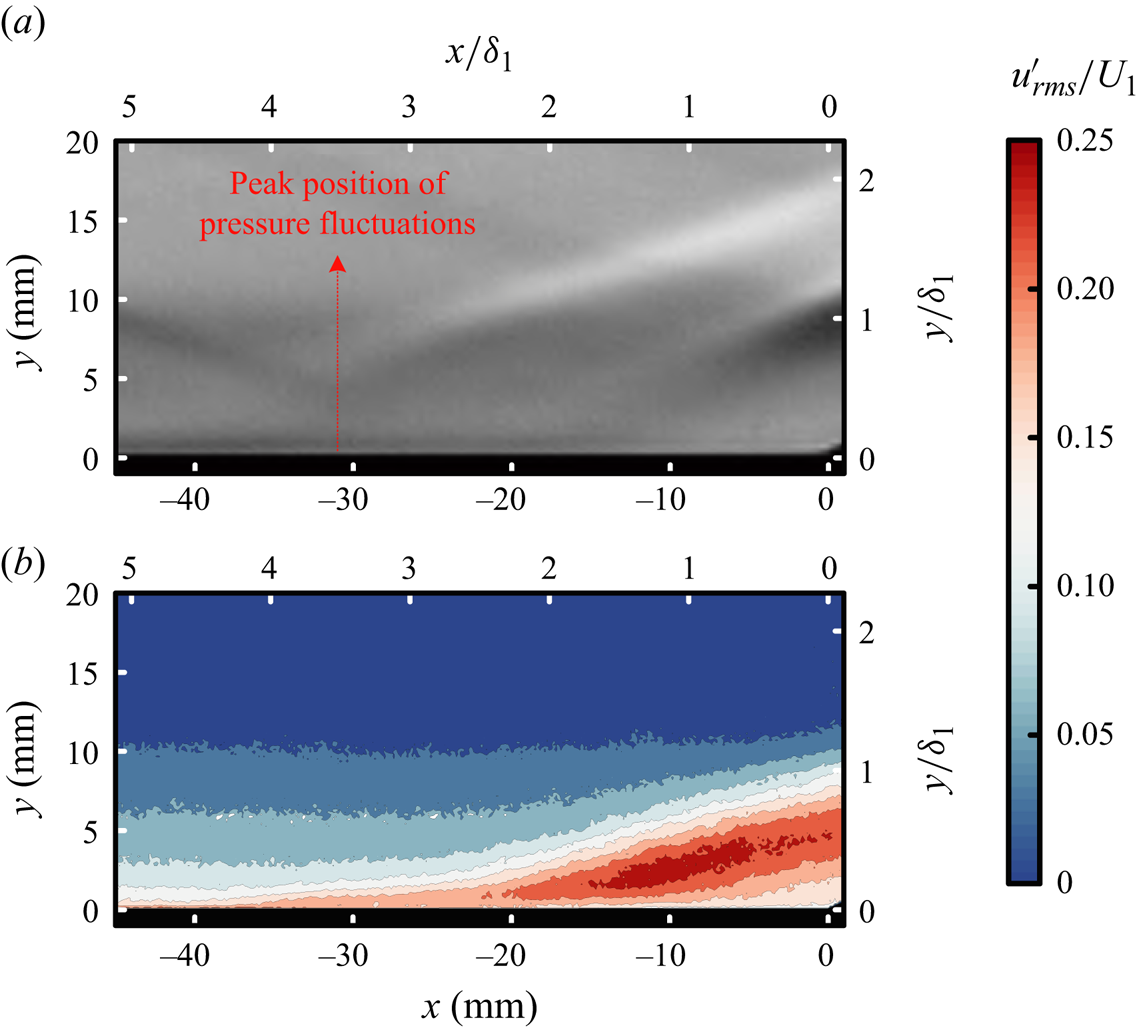
 $x=0\ \text {mm}$. The root mean square (r.m.s.) of the streamwise velocity fluctuations is shown in figure 8, together with the locally magnified schlieren image. A region of high-energy fluctuations, starting at approximately
 $x= -15\ \text {mm}$, is observed in the r.m.s. contour, indicating the initiation of the shear layer within the separation. Furthermore, fluctuations with a specific level extend upstream to the vicinity of
 $x= -30\ \text {mm}$, which corresponds to both the peak position of the pressure fluctuation and the area encompassed by the compression waves. These compression waves exhibit a remarkable unsteady behaviour, which will be analysed in the subsequent section on shock unsteadiness.
Comparison of (a) time-averaged schlieren image and (b) r.m.s. streamwise velocity fluctuations in the magnified field of the interaction region with  $d=19\ \text {mm}$.
4.2. Expanded separation: the role of a relaxing boundary layer
This situation differs when the relative positions of the two interaction regions change. In this case, the interaction with the separation occurs upstream. The incident shock impacts a location approximately  $56\ \text {mm}$ upstream from the origin of the compression corner, as shown in figure 9(a). Owing to the relatively large deflection angle of the wedge, the incident shock is sufficiently strong to induce a separate boundary layer in the first STBLI region. The nominal Mach number downstream from this region is 2.85. The compression-ramp-induced STBLI leads to a boundary layer without any apparent separation, even at deflection angle
 $24^{\circ }$. A potential explanation is that the upstream expansion waves induced by the shock generator exert a beneficial influence on the downstream STBLI region. The shock foot, identified using the relative standard deviation, is located near transducer T6. This location aligns with the results of the schlieren image analysis. The absence of a pressure plateau in the pressure distribution can be attributed to the relatively weak incident shock at this Mach number, despite inducing separation. According to Xue et al. (Reference Xue, Jiao, Wang and Cheng2023), under the current flow conditions, the critical flow deflection angle is
 $24.8^{\circ }$, beyond which further increases in pressure may cease and the pressure may exhibit non-monotonic changes, potentially approaching a plateau.
Distributions of wall pressure and relative standard deviation for case B with different spacings between the two interaction regions, along with the mean flow structures: (a)  $d=56\ \text {mm}$, (b)
 $d=45\ \text {mm}$, (c)
 $d=36\ \text {mm}$, (d)
 $d=25\ \text {mm}$.

When the incident shock shifts  $10\ \text {mm}$ downstream, as shown in figure 9(b), the separated STBLI region approaches the downstream region while simultaneously experiencing a similar displacement of the shock foot position. Wall pressure continuously increases from the UI to the compression surface. Furthermore, with the emergence of compression waves, the sonic line gradually moves away from the wall as the flow develops. This observation suggests a change in the subsonic region beneath the boundary layer between these two regions. However, subsequent analysis of the shear layer evolution indicated that a complete connection was not established. As shown in figure 9(c), the incident shock shifts further downstream, making the connection between the two interaction regions more evident. A distinctly separated boundary layer between the two regions can be observed in the schlieren image. The extension of the shock waves towards the lower part of the boundary layer ceases to occur at the compression corner.
In figure 9(d), the incident shock undergoes a downstream shift of an additional  $10\ \text {mm}$, resulting in an enlarged merged separation region compared with that in the previous scenario. Simultaneously, a pressure plateau is observed in the wall pressure distribution, which is equal to the value estimated using free-interaction theory. However, the pressure plateau does not extend to the compression corner; instead, it terminates at the location of vortex shedding and is followed by a gradual increase in pressure until it reaches the compression surface because of the compression waves upstream from the reattachment shock. The shock foot moves upstream once again towards transducer T5. In the scenarios with
 $d=16$ and
 $6\ \text {mm}$, the separation shock gradually moves upstream as the incident shock progresses downstream, and the size of the separation region continuously expands. The presence of pressure plateaus also become more prominent, coinciding with the increasing platform area.
The average streamwise velocity fields for case B are displayed in figure 10(a). For the scenario in which  $d=56\ \text {mm}$, the velocity profiles at different streamwise locations downstream from the first STBLI region are presented in figure 10(b). When the two interaction regions are far apart, the downstream boundary layer develops with a relatively low rate of recovery until it reaches the compression corner. When the incident shock moves downstream, it fails to reach the UI of the downstream interaction region starting at approximately
 $x=-11\ \text {mm}$. The adverse pressure gradient initially affects the relaxing boundary layer from downstream, causing a gradual displacement of the sonic line within this boundary layer away from the wall, and resulting in a sequence of compression waves in the second STBLI region. As the interaction regions approach each other (
 $d=36\ \text {mm}$), the PIV results reveal a clear connection between the low-energy fluids in the two regions. Furthermore, the schlieren images demonstrate the fusion of the two separation zones, as illustrated in figure 9(c). From this spacing, a reverse movement is observed for the separation shock of the first STBLI. At this point, the adverse pressure gradient induced by the compression corner influences the upstream region through a separated boundary layer. The combined influence of these factors results in the expansion of the separation zone and transition of the reattachment position.
Mean streamwise velocity distribution  $\bar {u}/U_1$ in case B. (a) Streamwise velocity contours from
 $-0.2$ to 0.9 in increments of 0.1, and from 0.9 to 1.0 in increments of 0.01. (b) Evolution of streamwise velocity profiles at various positions with
 $d=56\ \text {mm}$.

Overall, the boundary layer between the two STBLI regions plays an important role in the separation expansion. Even with a small deflection angle, the incident shock decelerates the boundary layer, leading to significant changes in the UI and peak position of pressure fluctuations. Downstream from the separated STBLI, the relaxing boundary layer develops with a relatively low rate of recovery and is easier to separate when subjected to adverse pressure gradients. The adverse pressure gradient is more likely to propagate upstream through these perturbed boundary layers when the two interaction regions approach each other, rather than through fully developed turbulent boundary layers.
5. Unsteadiness in the interactions
5.1. Streamwise evolution of the PSD
At each transducer, the pressure was normalised with respect to  $p_{\infty }$, and the PSD of the wall pressure was computed over each run to characterise the streamwise variations of the wall pressure dynamics. Figure 11 presents maps of the frequency-premultiplied PSD (
 $\,f\, G(f)$) of the pressure fluctuations for case A. The spectra are normalised by the variance of the local wall pressure below
 $40.0\ \text {kHz}$. To enable interpretation with reference to the boundary layer time scales, the right-hand axis in the spectra is shown in terms of
 $St_{\delta }=f\delta _{1}/U_{1}$. We also give the non-dimensional frequency based on the interaction length
 $L_{{int}}$ in the subsequent analysis. In all cases, the peak energy should be located at the convection frequency
 $(U_{1}/\delta _{1}=89.51\ \text {kHz})$; however, these peaks fall near
 $40\ \text {kHz}$, which is the cutoff frequency of the transducer.
Streamwise evolution of frequency-premultiplied pressure fluctuation PSD for case A with (a)  $d=52\ \text {mm}$, (b)
 $d=30\ \text {mm}$, (c)
 $d=19\ \text {mm}$, (d)
 $d=0\ \text {mm}$. All plots have the same spatial coordinates (
 $x$–
 $y$ plane) scaled by the boundary layer thickness and contour levels.

The presence of a weak low-frequency component can be observed at a fixed position between  $x=-100\ \text {mm}$ and
 $x=-80\ \text {mm}$ in figure 11(a), which is consistent with the occurrence of the peak in the distribution of
 $\sigma _{p}/p_{w}$ in figure 5. This unexpected disturbance can be attributed to the spanwise developing shock caused by the gap between the optical window and the sidewall. Downstream from this region, oscillations induced by the incident shock can be observed within the frequency range from
 $1.0\ \text {kHz}$ to
 $5.0\ \text {kHz}$. At the mean location of the shock foot
 $(x\approx -20\ \text {mm})$, the low-frequency content caused by the STBLI at the compression corner is also detected, and downstream from this interaction region, the broadband peak shifts towards higher frequencies. As the incident shock moves downstream, as illustrated in figures 11(b,c), no significant change is evident in the high-frequency component of the interaction. However, a gradual extension of the upstream low-frequency component is observed. In figure 11(b), the dynamic characteristics of the two interaction regions can still be distinguished. As depicted in figures 11(c,d), when the upstream incident shock enters the downstream interaction region, the range of low-frequency oscillations exhibited by the separation shock expands. The location of the energy peak in the low-frequency component is also in accordance with that indicated in figure 5(c).
The connection between the two interaction regions is more evident in case B, as depicted in figure 12. Within the upstream STBLI region, low-frequency dominance with a local maximum at  $719.0\ \text {Hz}$ (
 $St_{\delta }=0.008$,
 $St_{L_{{int}}}=0.04$) can be observed at the shock foot in both figures 12(a) and 12(b). Subsequently, high-frequency fluctuations emerge at approximately
 $37.0\ \text {kHz}$ (
 $St_{\delta }=0.41$,
 $St_{L_{{int}}}=2.2$), indicating the incipient instability of the separated shear layer. In the relaxation region between the two interaction regions, the flow exhibits only high-frequency fluctuations.
Streamwise evolution of frequency-premultiplied pressure fluctuation PSD for case B with (a)  $d=56\ \text {mm}$, (b)
 $d=45\ \text {mm}$, (c)
 $d=36\ \text {mm}$, (d)
 $d=25\ \text {mm}$. All plots use the same contour set and spatial coordinates as those in figure 11.

The spectral evolution over the two STBLI regions with smaller spacings is illustrated in figures 12(c) and 12(d), where distinct low-frequency oscillations are observed between the two regions. An increase in energy content is observed at frequencies of approximately  $183.0\ \text {Hz}$ (
 $St_{\delta }=0.002$,
 $St_{L_{{int}}}=0.02$) near the shock foot, whereas a dominant instability of
 $18.4\ \text {kHz}$ (
 $St_{\delta }=0.21$,
 $St_{L_{{int}}}=2.04$) subsequently emerges downstream from the separation shock. This unsteadiness signifies the initial stage of shear layer development. The subsequent shedding of the shear layer is observed to transition to lower frequencies as it progresses along the recirculation length, reaching
 $15.2\ \text {kHz}$ (
 $St_{\delta }=0.17$,
 $St_{L_{{int}}}=1.68$) near the expansion fan at
 $x=x_{0}+0.5{L_{{int}}}$, where
 $x_0$ is the shock foot location. After vortex shedding, this frequency remains nearly constant up to the compression corner. When the separation extends to the corner, forming a large separation, the low-frequency spectrum with substantial power moves upstream along with the separation shock. The low-frequency component persists in the recirculation region, albeit with diminishing power. With an increase in the separation scale, the shear layer becomes longer, leading to a decrease in the vortex shedding frequency downstream.
The range of low-frequency bands can serve as an additional indicator for determining the range of the shock motion, which is observed to be  $20\ \text {mm}$ in figure 12(b). For peak frequency
 $427.2\ \text {Hz}$, the shock velocity is estimated to be
 $8.5\ \text {m}\ \text {s}^{-1}$ or approximately
 $1.2\,\%$ of the free-stream velocity, closely matching the typical literature value of
 $2.0\,\%$. Furthermore, the observed trend in the separation shock velocity with increasing separation scale is consistent with the findings of Estruch-Samper & Chandola (Reference Estruch-Samper and Chandola2018). The essential components in STBLI, namely, the shock system, shear layer and separation bubble, play crucial roles in determining the unsteady characteristics (Wu & Martin Reference Wu and Martin2008). This section provides a comprehensive overview of the unsteady features exhibited by dual-STBLIs along the flow direction. A detailed analysis is presented for each individual aspect.
5.2. Shock wave unsteadiness
Even if the incident shock is relatively weak, the boundary layer downstream from the STBLI region is disturbed, rendering it more susceptible to thickening or separation in the presence of adverse pressure gradients. This decelerated boundary layer can significantly influence the subsequent STBLI when the two interaction regions are closely positioned, as observed in the current case. The wall pressure begins to increase upstream from the nominal separation or interaction point in the STBLI region owing to the pressure gradient. With a less fully developed boundary layer, this effect extends further upstream, as does the low-frequency oscillation of the waves induced by UI.
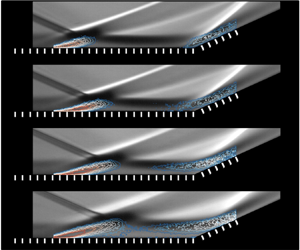
This process can be observed effectively using high-frame-rate schlieren imaging and PIV. The standard deviation of the image intensity obtained from a temporal sequence of  $3.2\times 10^5$ schlieren images is illustrated in figure 13, along with the superimposed r.m.s. streamwise velocity fluctuation on the time-averaged schlieren image for case A. Due to the different visual principles on which schlieren imaging and PIV are based, they complement each other in revealing the unsteady features in the interaction region. Schlieren imaging can capture structural changes in flow fields with large density gradients, including shock waves and shear layers. The standard deviation map reveals fluctuations in both the incident shock and boundary layer. However, the magnitudes of these fluctuations are significantly lower than those of the shock oscillation at the compression corner. Within the boundary layer and the interaction region, the PIV enables the quantitative measurement of the flow field, facilitating an accurate assessment of the boundary layer state.
Fluctuations in the flow field with various spacings between the two STBLI regions in case A. (a) Standard deviation (temporal) intensity maps of the dual-STBLIs obtained from schlieren image sequences. Levels of contour are spaced by 0.2. (b) The r.m.s. streamwise velocity fluctuations normalised by the mean streamwise velocity upstream of the STBLI superimposed with the time-averaged schlieren images. Levels of contour are spaced by 0.02.

When the spacing between the two STBLI regions is relatively large, as depicted in figure 13(a) with  $d=52$ and
 $30\ \text {mm}$, the separation shock becomes distinctly discernible in the standard deviation map. The separation shock manifests as a distinct region characterised by significant intensity fluctuations, indicating the unsteady nature of the STBLI. The downstream boundary layer also exhibits a certain level of turbulence. Shock motions typically arise from specific causes, as evidenced by the PIV results in figure 13(b), indicating a higher level of velocity fluctuation beneath the separation shock within the interaction region. These fluctuations encompass diverse frequencies, including the breathing of the separation bubble and shear layer development. The downstream movement of the incident shock, as illustrated in figure 13 with
 $d = 30$ and
 $19\ {\rm mm}$, has a negligible effect on the position of the separation shock at the compression corner. The interaction region at the compression corner is expected to experience an expansion of high-level fluctuations. However, noticeable oscillations of additional waves induced by the UI can be observed distinctly not far upstream in the standard deviation map. The downstream movement of the incident shock leads to a gradual upstream movement of the additional waves generated at the UI, intensifying the oscillations. An analysis of the standard deviation map reveals that variations in the incident shock do not affect the position of the original separation shock at the compression corner. However, violent oscillations are observed in the waves generated at the UI.
The standard deviation map and PIV results enable the observation of amplified oscillations in the upstream influence waves and separation region; however, they do not provide insights into the frequency components present in the interaction regions. To overcome this limitation, we analysed and summarised the SPOD modes across all frequencies. Before further discussions, we would like to emphasise that the number of data samples utilised in this analysis is sufficient. The leading SPOD modal energies obtained with different snapshots of instantaneous fields are shown in figure 14. When the number of snapshots exceeds  $1.0\times 10^5$, the difference in energy for low frequencies is minimal, whereas when the number of snapshots exceeds
 $2.0\times 10^5$, the differences in high frequencies gradually decrease. Considering the very tiny discrepancy between the distributions obtained with
 $n=2.5\times 10^5$ and
 $n=3.2\times 10^5$, convergence of the SPOD energy is regarded as sufficient. In addition, the SPOD result exhibits a broadband and energetic low-frequency component associated with the separation shock unsteadiness, which is consistent with the wall pressure measurements.
Dependence of the SPOD energy convergence on the number of samples.

Three primary shapes emerge, which can be seen in both cases: first, low-frequency oscillations are predominantly influenced by the separation shock; second, medium-frequency oscillations are associated with the oscillation of the separated shear layer; and third, relatively high-frequency oscillations are characterised by small-scale coherent structures originating from vortex shedding. When the two interaction regions are sufficiently far apart, as illustrated in figure 15(a), the typical characteristics of the STBLI can be observed at the compression corner. From the inspection of the leading SPOD mode, we can conclude that the low-frequency oscillations, such as those at  $St_{\delta }=0.007$, are dominated by the separation shock motion at the compression corner. This observation is consistent with the fundamental understanding of STBLI, in that separation bubble breathing and large-scale separation shock motion occur predominantly at lower frequencies. The separated shear layer exhibits significant coherent fluctuations, such as flapping of the mixed layer and structural shedding, predominantly at low and medium frequencies (
 $St_{\delta }=0.007$ and
 $0.06$).
First SPOD composed of flow fluctuations obtained from schlieren image sequences in case A with (a)  $d=52\ \text {mm}$, (b)
 $d=19\ \text {mm}$. The plots illustrate low-, medium- and high-frequency oscillations in the flow, arranged from top to bottom. The contours represent the real part of the first SPOD mode, with the levels spaced at intervals of 0.1.

When the two interaction regions are in close proximity, as shown in figure 15(b), an additional shock wave with low-frequency oscillations originates from the UI, and the most energetic fluctuations are in this shock. However, this shock does not exhibit medium- or high-frequency unsteadiness. The shear layer provides energetic contributions at both low and medium frequencies. Similar findings were obtained in a study on the STBLI induced by a compression ramp (Grilli et al. Reference Grilli, Schmid, Hickel and Adams2012). The authors employed dynamic mode decomposition to analyse the presence of a low-frequency mode associated with the pulsation of the separation bubble. In another investigation on transonic STBLI (Sartor et al. Reference Sartor, Mettot, Bur and Sipp2015), Fourier-mode decomposition was utilised to examine the effects of low-frequency perturbations on both the shock wave and the top of the recirculation bubble. At medium frequencies, noticeable elongated coherent structures are present on the compression surface, as depicted in figure 15(b), suggesting intermittent movement of the shear layer in the direction normal to the wall. At a relatively high frequency ( $St_{\delta }=0.21$), streamwise periodic structures with small scales appear within the mixing layer in both figures 15(a) and 15(b).
Interestingly, only low-frequency oscillations are observed in the shock waves originating from the UI, which could be due to the existence of the retarded flow in the region upstream from the separation. Murphree et al. (Reference Murphree, Combs, Yu, Dolling and Clemens2021) reported a similar phenomenon, wherein the planar laser scattering and pressure PSD revealed a retarded or weakly separated flow upstream from the region in which the separation was induced by a cylinder. The study conducted by Humble, Scarano & van Oudheusden (Reference Humble, Scarano and van Oudheusden2009) revealed that vortex structures exhibit lifting behaviour even in the absence of a significantly reversed flow region. These vortex structures respond to the highly retarded flow within the inner layer, as illustrated in figure 8, similar to their response to a large-scale recirculating bubble. Consequently, when no substantial deficit exists in the inner layer velocity, no lifting of vortex structures is observed. This finding is particularly important in the present interaction because the upstream STBLI strongly favours the occurrence of retarded flow. Even without a large-scale reversed-flow region, this retarded flow can instantaneously exhibit many features that are typically associated with large-scale separated interactions. In this case, the free-interaction theory provides a mathematical framework for establishing the connection between local conditions and the UI, whereas the presence of retarded flow offers a tangible physical basis.
5.3. Shear layer evolution
The shear layer plays a crucial role in the STBLI. The extent of the separation is determined by the ability of the shear layer originating from the separation point to overcome the pressure increase at the reattachment point. This ability is influenced by the initial momentum available during the process of reattachment. According to the free-interaction theory, it can be observed that the pressure rise leading up to separation is independent of the downstream conditions. Consequently, a higher overall pressure increase applied to the boundary layer or an escalation in shock intensity necessitates a greater pressure increase during reattachment. This increase can be accomplished only by increasing the velocity attained on the dividing streamline; thus extending the length of the shear layer is essential for facilitating more substantial momentum transfer from the outer flow. Additionally, Piponniau et al. (Reference Piponniau, Dussauge, Debieve and Dupont2009) proposed a hypothesis regarding the instability of the STBLI. They suggested that the unsteadiness of the separation bubble could be caused by a process of entrainment and recharge driven by the shear layer. The low-momentum fluid inside the separation bubble can be drawn in by the shedding mechanism through the action of the shear layer. Hereafter, the analysis focuses exclusively on unsteady effects within the separation region.
In case A, the most notable phenomenon is the change in the shock foot. In case B, the oscillation of the separation shock at the upstream position exhibits the expected behaviour, whereas the variation in the shear layer is worth noting. As the two interaction regions gradually approach each other, as depicted in figure 9, reattachment in the upstream region no longer appears, and the shock wave at the compression surface gradually moves downstream with the fusion of the two interaction regions. When focusing on the area between these two regions, many compression waves appear upstream as the spacing decreases.
The standard deviation of the image intensity, along with the superimposed r.m.s. streamwise velocity fluctuation on the time-averaged schlieren image for case B, is depicted in figure 16. When the two interaction regions are far apart, as shown in figure 16(a) with  $d=56$ and
 $45\ \text {mm}$, fluctuations with certain intensities can be observed in the separation and reattachment shocks of the upstream STBLI and the shock wave at the downstream compression ramp. The presence of fluctuations at the edge of the mixing layer originating from vortex shedding, and at the top of the recirculation bubble, should also be considered in the standard deviation map. Similar to case A, regions exhibiting high-level velocity fluctuations are observed within the interaction regions and are situated beneath the separation shocks, as shown in figure 16(b). When the spacing between the two regions decreases, large-range fluctuations caused by compression waves occur between these regions. Simultaneously, the oscillations in the mixing layer between these two regions are enhanced to a certain extent. With an increasing separation scale, the shear layer progressively moves away from the wall. The intriguing aspect lies in the gradual expansion of velocity fluctuation as the two interaction zones approach each other, extending upstream through a separated shear layer. However, the frequency composition of these oscillations remains unknown.
Fluctuations in the flow field with various spacings between the two STBLI regions in case B. (a) Standard deviation (temporal) intensity maps of the dual-STBLIs obtained from schlieren image sequences. Levels of contour are spaced by 0.2. (b) The r.m.s. streamwise velocity fluctuations normalised by the mean streamwise velocity upstream of the STBLI superimposed with the time-averaged schlieren image. Levels of contour are spaced by 0.02.
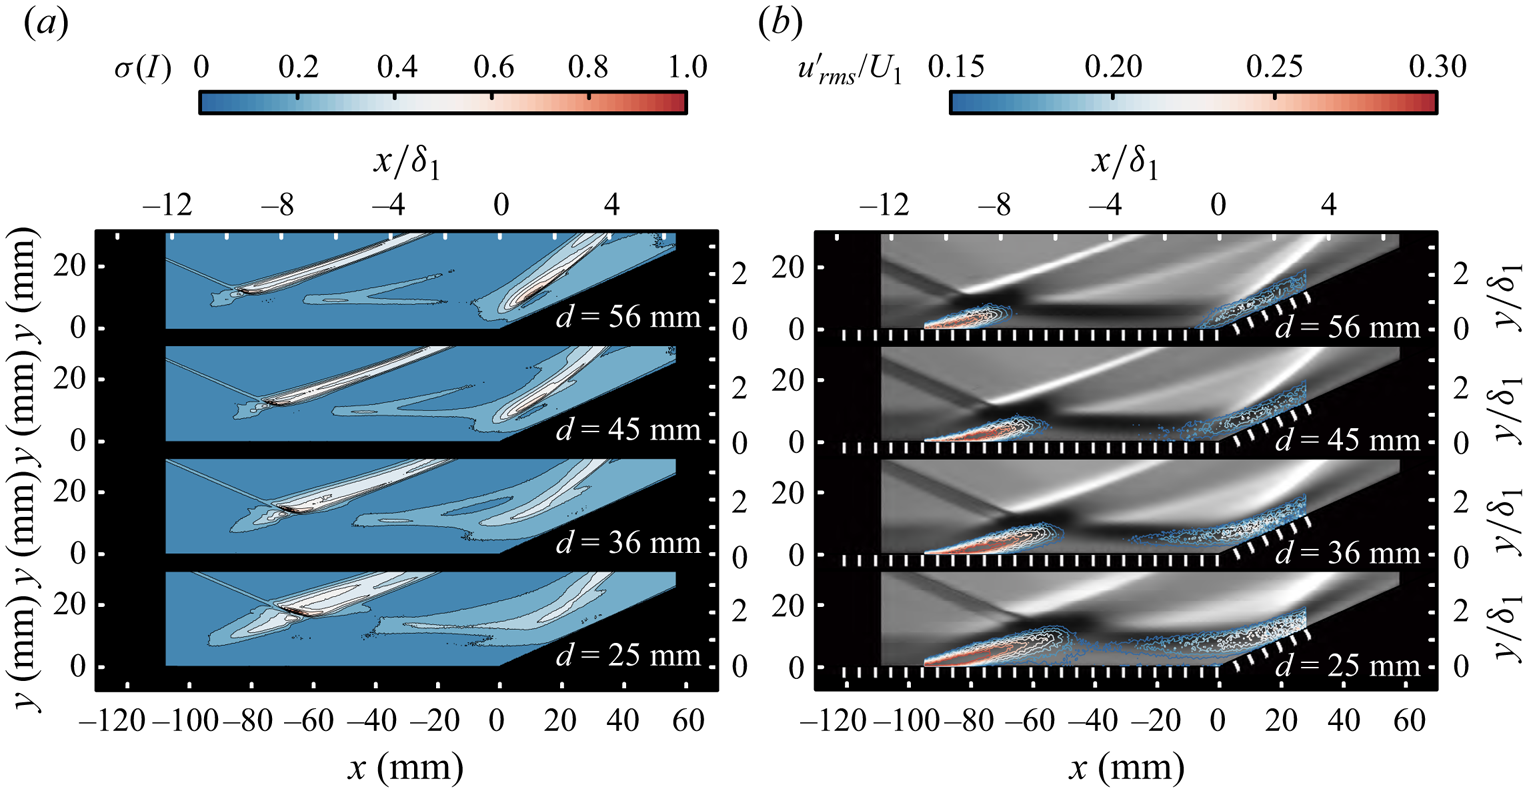
Figure 17 shows the leading SPOD modes of the light intensity fluctuations obtained from the schlieren system. The low-frequency oscillations in all scenarios are governed primarily by the separation shock in the upstream STBLI region, accompanied by the motion of the shear layer normal to the wall, similar to what is depicted in figure 15. Streamwise periodic structures with small scales appear within the mixing layer at high frequencies. When the two interaction regions are widely separated, as depicted in figure 17(a), the range of low- and medium-frequency oscillations in the downstream mixing layer of the first STBLI region is limited, with the perturbation diminishing to a low level at a short distance downstream, whereas high-frequency periodic structures persist until they reach the compression surface. The shock wave at the compression corner is influenced by the mixing layer and vortex structures induced upstream, and these effects can be observed at low, medium and high frequencies. As the two regions approach each other, as shown in figure 17(b), coupled with the observations in figure 9(d), the separation of the mixing layer downstream from the first STBLI region results in more pronounced oscillations that extend to the compression surface, thereby influencing the compression waves above it. The elongated structures within the mixing layer extend continuously to the compression surface, indicating vertical amplitude oscillations of the entire mixing layer. When the scale of separation increases further, the elongated structures move away from the wall with the mixing layer. Notably, both the mixing layer fluctuations and the small-scale eddies originate downstream from the expansion fan or vortex shedding.
First SPOD mode of flow fluctuations obtained from schlieren image sequences in case B with (a)  $d=56\ \text {mm}$, (b)
 $d=25\ \text {mm}$. The plots illustrate low-, medium- and high-frequency oscillations in the flow, arranged from top to bottom. All plots use the same contour set and spatial coordinates as those in figure 15.

The source of low-frequency oscillations in the STBLI has been summarised in Clemens & Narayanaswamy (Reference Clemens and Narayanaswamy2009) and Souverein et al. (Reference Souverein, Dupont, Debieve, Dussauge, van Oudheusden and Scarano2010). The findings reported in those works indicate the presence of both upstream and downstream effects, with their significance varying depending on the degree of separation and the interaction strength. In cases in which the boundary layer is fully separated, the ‘downstream mechanism’ dominates; however, for mild interactions, the ‘upstream mechanism’ is expected to be more significant. In case B, where the boundary layer is fully separated with an interaction length more than  $5\delta _1$ in each scenario, the SPOD analysis results are consistent with the findings of Priebe & Martin (Reference Priebe and Martin2012). The low-frequency oscillation is influenced primarily by downstream effects, with the motion of the shock attributed to the breathing of the separation bubble and the accompanying flapping of the separated shear layer. This is verified further in the cross-correlation analysis that follows.
The enhancement in the low-frequency oscillation between the two regions was analysed further. Taking fixed position T17 as an example, we evaluated the variations in the pressure spectra under different spacings, as illustrated in figure 18. At  $d=36\ \text {mm}$, sudden amplification occurs in the low-frequency components, accompanied by a concomitant decrease in the dominant frequency of the high-frequency components. As the incident shock moves downstream, a decrease is observed in the dominant frequency of the high-frequency oscillations, along with slight attenuation in the low-frequency oscillations. The PSD map in figure 11 clearly illustrates that an increase in the separation scale leads to the development of a shear layer originating from the separation point, resulting in lower-frequency fluctuations caused by the Kelvin–Helmholtz instability.
Frequency-premultiplied PSD of the pressure fluctuations at T17 ( $x=-41\ \text {mm}$) with different spacings between the two STBLI regions.

Figure 19 summarises the streamwise development of the characteristic frequency  $f_{{ch}}$ during the interaction. The values of
 $f_{{ch}}$ were obtained directly from the peaks in the spectra at each sensor (refer to figure 11), with approximate uncertainty
 $5\,\%$. When the two interaction regions are widely separated, such as by
 $d_{1}=56\ \text {mm}$ (marked by circles) and
 $d_{2}=45\ \text {mm}$ (marked by squares),
 $f_{{ch}}$ increases rapidly from the low frequencies at the upstream separation point. It reaches a local peak at approximately
 $x-x_0=0.2L_{{int}}$ upon shear layer inception, then decreases monotonically along the recirculation region until
 $x-x_0=0.5L_{{int}}$, where vortex shedding occurs. Subsequently, downstream from the reattachment region, the dominant frequency gradually increases to over
 $30.0\ \text {kHz}$. This behaviour is consistent with the evolution of the shear-induced disturbances in a typical incident STBLI (Dupont et al. Reference Dupont, Haddad and Debieve2006). The significant disparity is due to the dominant frequency upon inception close to and downstream from the separation; this frequency is
 $25.8\ \text {kHz}$ in our case, which is more than three times its counterpart observed by Dupont et al. (Reference Dupont, Haddad and Debieve2006) for the incident STBLI (
 $7.2\ \text {kHz}$). In both cases, this frequency occurs at
 $x-x_0=0.2L_{{int}}$. Notably, the compression corner study by Thomas et al. (Reference Thomas, Putnam and Chu1994) revealed a dominant frequency of approximately
 $32.0\ \text {kHz}$ upon shear layer inception, whereas the forward-facing step study by (Chandola, Huang & Estruch-Samper Reference Chandola, Huang and Estruch-Samper2017) yielded a dominant frequency of approximately
 $37.5\ \text {kHz}$; both of these values are close to the
 $f_{{ch}}$ value observed here. Notably, a reversal in the trend of
 $f_{{ch}}$ over the expansion region intrinsic to the incident STBLI case occurs when considering the STBLI in both the forward-facing step (Chandola et al. Reference Chandola, Huang and Estruch-Samper2017) and the compression corner (Thomas et al. Reference Thomas, Putnam and Chu1994).
Distribution of the dominant frequency  $f_{{ch}}$ in the shear layer evolution with different spacings between the two STBLI regions. The two long dashed lines in (a) the schlieren images and (b) the curves indicate the positions at which
 $f_{{ch}}$ undergoes a reversal and tends to stabilise.

When the two interaction regions approach each other, the schlieren image and pressure distribution reveal an initial separation in the boundary layer downstream from the reattachment, as shown in figure 9(c). Here,  $f_{{ch}}$ of the interaction with spacing
 $d=36\ \text {mm}$, in contrast to those in the previous two scenarios (
 $d=56$ and
 $45\ \text {mm}$), experiences a further decrease downstream from the inception of the shear layer, owing to the extended development of the shear layer caused by enhanced separation. Additionally, downstream from the expansion fan, instead of increasing to the high levels observed in the previous two scenarios,
 $f_{{ch}}$ stabilises at approximately
 $22.0\ \text {kHz}$. The shift from higher to lower frequencies along the streamwise direction becomes increasingly pronounced as the two regions approach each other, as demonstrated in figure 19 with
 $d=25$, 16, 6 mm. Subsequently, a gradual increase in
 $f_{{ch}}$ occurs within the shear layer downstream from the expansion fan, whereas the relatively constant frequencies at the end progressively decrease. In scenarios in which the spacing ranges from
 $d=36\ \text {mm}$ to
 $d=6\ \text {mm}$,
 $f_{{ch}}$ of the shear layer downstream from the expansion fan continues to increase owing to the acceleration of the shed structures induced by the expansion fan. After normalising with respect to the separation length
 $L_{{int}}$, the results for this region (
 $0.5L_{{int}}\unicode{x2013}1.2L_{{int}}$) align with the findings reported in the existing literature. When the separation scale is quite large, such as
 $d=6\ \text {mm}$,
 $f_{{ch}}$ decreases continuously from the inception of the shear layer. This finding aligns with the trend observed in the compression corner interactions (Thomas et al. Reference Thomas, Putnam and Chu1994), where
 $f_{{ch}}$ decreases towards a location close ahead of the reattachment. However, contrary to expectations, the previously mentioned acceleration of the shed structures does not result in a significant increase in
 $f_{{ch}}$, suggesting a weakened effect of the expansion fan.
In addition to changes in  $f_{{ch}}$, the evaluation of the energy variations associated primarily with the separation bubble involved integrating the spectra below and above the
 $1.0\ \text {kHz}$ threshold for further analysis, as illustrated in figure 20. The spectra presented herein were normalised based on the maximum fluctuation energy observed along the plate. Significantly enhanced low-frequency oscillations can be observed near the shock foot, accompanied by high-frequency fluctuations that arise from the shear layer development. The proportion of low-frequency energy compared with the high-frequency component in figure 20(a) is relatively small because of the limited separation scale. However, as depicted in figures 20(b) and 20(c), the approach of the two STBLI regions leads to rapid amplification of the low-frequency energy. However, the subsequent trend demonstrates a gradual decrease in all three scenarios, and a rapid increase at the compression surface.
Distribution of the spectral energy during the shear layer evolution with (a)  $d=56\ \text {mm}$, (b)
 $d=36\ \text {mm}$, (c)
 $d=16\ \text {mm}$, at
 $f< 1\ {\text {kHz}}$ and
 $f> 1\ {\text {kHz}}$.

As shown in figure 20(a), the high-frequency energy gradually diminishes downstream from the first STBLI region until it reaches the compression corner, where the shock in the second STBLI region leads to a subsequent increase in the high-frequency energy. The enhancement of the separation in figures 20(b) and 20(c) results in a decrease in the dominant frequency, which leads to the amplification of high-frequency fluctuations associated with the shear layer development. The slight decrease in the high-frequency energy followed by a rapid increase near the expansion fan is noteworthy. This inflection point coincides with the reversal of  $f_{{ch}}$ at the vortex shedding position, as depicted in figure 19. In these two scenarios, the absence of reattachment in the first STBLI region leads to the continuous development of the shear layer until it reaches the compression corner. This provides favourable conditions for the formation of vortex structures resembling those occurring in the Kelvin–Helmholtz phenomenon within the mixing layer after the separation shock. Scholars have further confirmed that the presence of reverse flow and inflection velocity profiles can result in Kelvin–Helmholtz instability, ultimately leading to the formation of large convective eddies (Dupont et al. Reference Dupont, Piponniau, Sidorenko and Debieve2008; Helm, Martin & Dupont Reference Helm, Martin and Dupont2014).
5.4. Communication within the separation bubble
Ascertaining whether the two interaction regions exhibit coupling at the frequencies of interest is crucial. The coherence function, which quantifies the similarity between wall pressure measurements at different locations within the interaction region, was calculated. The coherence function  $C_{xy}$ indicates the level of linearity between signals
 $x(t)$ and
 $y(t)$ in terms of the energy content at a specific frequency;
 $C_{xy}=1.0$ implies a linear relationship between the two time sequences at frequency
 $f$, whereas
 $C_{xy}=0$ indicates no correlation.
The coherence function along the streamwise direction in case A is shown in figure 21. The reference transducer used for these coherence functions is positioned at T27, which is close to the origin of the compression corner. Within the incoming boundary layer,  $C_{xy}$ maintains a relatively low value that does not exceed 0.2 at any frequency. The highly correlated positions in the separated region surrounding the reference location are shown in figure 21(a), with
 $C_{xy}>0.4$. Furthermore, the flow at the shock foot is correlated with low-frequency pulsations spanning approximately
 $10\ \text {mm}$, where
 $C_{xy}$ exceeds 0.3. Furthermore, as the incident shock moves downstream,
 $C_{xy}$ at the shock foot increases significantly, reaching maximum value 0.6 in figure 21(b). The range of flow with
 $C_{xy}$ higher than 0.3 near the shock foot expands to
 $25\ \text {mm}$, starting from this point. In the initial region of the separated flow, one can observe a narrow passage distinguished by an extremely weak correlation between
 $x=-11$ and
 $x=-1$, corresponding to the early growth stage of the shear layer (Murphree et al. Reference Murphree, Combs, Yu, Dolling and Clemens2021; Jenquin, Johnson & Narayanaswamy Reference Jenquin, Johnson and Narayanaswamy2023). Meanwhile, specific high-frequency components, such as
 $33.1\ \text {kHz}$ in figure 21(a) and
 $23.5\ \text {kHz}$ in figure 21(b), exhibit a strong correlation with the upstream flow. The regions demonstrating significant values of
 $C_{xy}$ at these frequencies originate primarily from the initial stage of shear layer development.
Coherence between the reference signal and the wall pressure at different streamwise locations in case A with (a)  $d=52\ \text {mm}$, (b)
 $d=30\ \text {mm}$, (c)
 $d=19\ \text {mm}$, (d)
 $d=10\ \text {mm}$.

The flow associated with the low-frequency oscillations does not extend significantly upstream until the two interaction regions approach each other, as shown in figure 21(c). The flow at sensor T16 demonstrates a noticeable level of correlation, which also implies an expansion of the second STBLI region across the incident shock. The schlieren image reveals that the shock foot at T22 deeply penetrates the boundary layer, indicating the absence of significant separation upstream from the shock foot; however, this region exhibits a lower  $C_{xy}$. The region near the shock foot with
 $C_{xy}>0.3$ remains confined within a span of approximately
 $25\ \text {mm}$ when the incident shock moves further downstream, as shown in figure 21(d). The superposition of the pressure gradient increases the separation scale at the compression corner, consequently increasing the development length of the shear layer, as evidenced by the extension of the region that is closely related to the high-frequency components. Additionally, a decrease occurs in the dominant frequency of these high-frequency components, from
 $21.1\ \text {kHz}$ in figure 21(c) to
 $17.6\ \text {kHz}$ in figure 21(d). This observation is consistent with the evolution trend observed in case B (refer to figure 19) regarding
 $f_{{ch}}$ of the shear layer, which can be attributed to the elongated development region behind the separation.
The cross-correlation was estimated throughout the measurement domain in order to analyse the temporal organisation of the pressure fluctuations within the interaction region, relative to a reference location situated near the intermittent region and close to the shock foot. The reference location was selected based on the location exhibiting the highest  $C_{xy}$ within the intermittent region, as depicted in figure 21. Identifying the STBLI regions that precede or follow the intermittent region is crucial for understanding the underlying mechanisms governing separation shock motion. The presented results are based on an average of 487 selected data snippets, each
 $2^{14}$ samples
 $({\approx }30\ \text {ms})$ in length. The presence of a positive (negative) lag at the cross-correlation extremum indicates that the pressure signal at the reference transducer location was lagging (leading). By monitoring the evolution of time delay in the correlation peaks, calculating the average speed and direction of the pressure perturbations was possible. According to figure 21, the signal must be pre-filtered using a low-pass filter at
 $1\ \text {kHz}$ to eliminate certain complex influences and evaluate the low-frequency effects along the interaction region.
The cross-correlations  $\rho _{xy}$ with respect to the signal within the intermittent zone are depicted in figure 22. Similar to the findings depicted in figure 21, the pressure fluctuations in the intermittent region demonstrate a minimal correlation with the incoming boundary layer. The highly correlated area near the reference location is confined. The initial stage of the separated flow near the shock foot exhibits a narrow region in which the correlation is significantly reduced. Downstream, a noticeable negative correlation is observed in the separated flow. This negative correlation persists until reattachment and encompasses the adjacent zones, which is consistent with previous research findings (Priebe & Martin Reference Priebe and Martin2012; Jenquin et al. Reference Jenquin, Johnson and Narayanaswamy2023). In other words, when the pressure in the intermittent zone increases, the pressure inside the separation bubble decreases. This finding indicates that as the separation shock moves upstream, the reattachment point shifts downstream. The periodic expansion and contraction of the separation bubble can be attributed to this combined motion of the separation and reattachment points, which are out of phase. The pressure increases at the location where the separation shock passes, while the upstream pressure of the reattachment shock decreases as it moves rearwards. When the mass is discharged, the internal pressure decreases. In figure 22(a), a maximum positive delay is observed at
 $x=-11\ \text {mm}$ (T23), which corresponds to the shock foot identified in figure 5(a). Furthermore, the pressure variation at this location precedes values at the other locations, indicating the origin of the disturbance. Based on the spacing between the transducers, the average velocities of the upstream- and downstream-propagating disturbances can be calculated as
 $0.37u_{\infty }$ and
 $0.42u_{\infty }$, respectively. As the incident shock moves downstream, the cross-correlation distributions in figures 22(b) and 22(c) exhibit similarities to the previous ones. With a slight enhancement in the separation scale, the propagating velocities decrease. When the incident shock enters the interaction region, it amplifies the oscillation of the shock at the UI, increasing the upstream-propagating velocity, as depicted in figure 22(c). However, as the separation scale increases, larger vortex structures decrease the downstream-propagating velocity as illustrated in figures 22(c) and 22(d). A second peak of delay within the separation region becomes increasingly prominent as the separation scale increases, as depicted in figures 22(c) and 22(d). Both upstream- and downstream-propagating disturbances can also be observed to originate at this location.
Streamwise evolution of the two-point cross-correlations of different zones within the STBLI region with reference to the intermittent region in case A with (a)  $d=52\ \text {mm}$, (b)
 $d=30\ \text {mm}$, (c)
 $d=19\ \text {mm}$, (d)
 $d=10\ \text {mm}$.

Although the linear coupling between the pressure at the shock foot located at the compression corner and the pressure fluctuations in the upstream boundary layer is relatively weak, as demonstrated in figures 21 and 22, this finding is consistent with those of previous studies, which have indicated a weak correlation between the low-frequency mode of the STBLI and the incoming boundary layer (Piponniau et al. Reference Piponniau, Dussauge, Debieve and Dupont2009; Huang & Estruch-Samper Reference Huang and Estruch-Samper2018). However, this does not diminish the effects of the upstream boundary layer conditions on the STBLI. A boundary layer with a full profile reduces the separation tendency, whereas an incomplete profile renders separation more likely. In numerous studies (Kim & Adrian Reference Kim and Adrian1999; Adrian, Meinhart & Tomkins Reference Adrian, Meinhart and Tomkins2000; Ganapathisubramani, Clemens & Dolling Reference Ganapathisubramani, Clemens and Dolling2007; Humble, Scarano & van Oudheusden Reference Humble, Scarano and van Oudheusden2007; Jenquin et al. Reference Jenquin, Johnson and Narayanaswamy2023), a strong correlation has been observed between the fluctuations in the upstream velocity and the separation location. The presence of elongated low-speed structures within the upstream boundary layer aligns with the occurrence of separated flow. These disturbances in the boundary layer induce shock motion, leading to pressure fluctuations at the shock foot that precede those observed at other locations within the separation bubble. This phenomenon is demonstrated clearly in figure 22, where pressure fluctuations at the shock foot are observed prior to those inside the separation bubble or at the reattachment point in all six scenarios. The lag of the pressure fluctuations within the upstream boundary layer with respect to the reference location is illustrated in figure 23. Even though the correlation coefficient is low, not exceeding 0.2, a constant velocity close to  $0.1U_{1}$ can be detected, implying the downstream propagation of larger-scale, low-speed structures. The origin of this disturbance is located precisely downstream from the incident shock in the first STBLI region, as evidenced by its identical displacement when the incident shock wave moves downstream by
 $10\ \text {mm}$. Tracing back further reveals that the ultimate source lies within the boundary layer at an even more upstream position, where the disturbance with propagation speed
 $0.51U_{1}$ originates, and continues to propagate downstream after deceleration through the first interaction zone.
Two-point cross-correlations of different regions within the incoming boundary layer with reference to the intermittent region in case A with (a)  $d=52\ \text {mm}$, (b)
 $d=41\ \text {mm}$.

In case B, when the two interaction regions are widely separated, the flows at the compression corner and the reference location are strongly correlated, as shown in figure 24(a). Additionally, at frequencies below  $2.0\ \text {kHz}$, a correlation exists between the shock oscillation at the compression corner and the nearby upstream flow. Furthermore, a relationship is evident between the separation shock in the first STBLI region and the interaction region at the compression corner; however, these correlations are relatively weak and do not exceed 0.3. No discernible correlation is observed in terms of flow between these two regions with respect to the reference position. The reduction in the spacing between the two interaction regions, as illustrated in figure 24(b), leads to a similar observation for the correlation in the high-frequency components compared to that in case A. In figure 24(c), a significant change is observed in the correlation between the flow at the compression corner and the upstream interaction region. Initially, the changes in the properties near the reference position are negligible; however, a noticeable increase occurs in the correlation coefficient between the reference position and the low-frequency oscillations induced by the upstream separation shock. Furthermore, a higher level of correlation is observed in the region between the separation shock and the compression corner. Finally, significant upstream expansion occurs in the area that is highly correlated with the high-frequency component centred around
 $22.0\ \text {kHz}$ at the reference position. The origin of this region coincides with the location at which vortex shedding occurs in the upstream STBLI, which also corresponds to the location of the reversal in
 $f_{{ch}}$ from a lower to a higher level, as shown in figure 19.
Coherence between the reference signal and the wall pressure at different streamwise locations in case B with (a)  $d=56\ \text {mm}$, (b)
 $d=45\ \text {mm}$, (c)
 $d=36\ \text {mm}$, (d)
 $d=25\ \text {mm}$.

In the subsequent scenarios, a clear separation is evident in the boundary layer between the two interaction regions, and a similar correlation distribution is observed. As the incident shock moves downstream, the dominant frequency of the highly correlated high-frequency components gradually decreases, which aligns with the results in figure 19. These highly correlated high-frequency fluctuations are attributed solely to unsteady shear layer flow. This observation confirms the coupling between the downstream pressure fluctuations and the low-frequency motion of the separation shocks as well as the high-frequency unsteady flow in the shear layer, enhancing our understanding of their interactions.
When the two interaction regions are far apart, as shown in figures 25(a) and 25(b), less of a correlation exists between the downstream flow and upstream separation shock, which aligns with the results in figure 23. A negative peak with positive maximum delay  $0.082\ \text {ms}$ occurs at T11 in the separation region, as shown in figure 25(a). The time delay decreases with increasing upstream distance, indicating an upstream-propagating perturbation, whereas the time delay increases with increasing downstream distance, suggesting a downstream-propagating perturbation. Both the upstream- and downstream-propagating disturbances originate at this location, which is consistent with the findings for shock-induced separated flows, where large structures that develop in the mixing layer occur near the middle of the bubble (
 $x-x_0= 0.5L_{{int}}$) (Dupont et al. Reference Dupont, Haddad and Debieve2006). Downstream from the first interaction region, the disturbance propagates at velocity
 $0.67U_{1}$. Although the fluctuations downstream from the interaction region exhibit certain delays relative to those in the upstream separation region, the correlation remains weak and does not exceed 0.3. In the subsequent scenarios, as the separation scale increases, the magnitude of the eddies evolving along the shear layer also increases. Following vortex shedding, larger-scale eddies propagate downstream at a reduced velocity.
Streamwise evolution of the two-point cross-correlation of different regions within the STBLI zone with reference to the intermittent region in case B with (a)  $d=56\ \text {mm}$, (b)
 $d=45\ \text {mm}$, (c)
 $d=36\ \text {mm}$, (d)
 $d=25\ \text {mm}$.

Similar to case A, the fluctuations are approximately in phase in the region surrounding the separation location; however, a phase shift  ${\rm \pi}$ exists within the separated flow. This finding aligns with the experimental results observed in the case of a reflected shock (refer to Dupont et al. Reference Dupont, Haddad and Debieve2006; Debieve & Dupont Reference Debieve and Dupont2009; Touber & Sandham Reference Touber and Sandham2009). Jenquin et al. (Reference Jenquin, Johnson and Narayanaswamy2023) also reported a phase shift
 ${\rm \pi}$ in wall pressure during the compression-ramp-induced STBLI. In summary, previous research indicates that regardless of the type of shock boundary layer interference, this phase alteration remains consistent and is associated with the expansion/contraction of the separation bubble. The pressure changes within the bubble, particularly at the vortex shedding location, occur before those at the other locations in the six scenarios considered. This finding is consistent with the shear layer entrainment–recharge mechanism proposed in numerous studies.
6. Discussion and conclusions
In this study, the interference between two STBLI regions was investigated experimentally. The separation or reattachment of an STBLI region can be affected by another interaction region. The dynamics of the STBLI, such as the distribution of the PSD, shock oscillation, evolution of the shear layer, and disturbance propagation, is also affected.
An analysis of the time-averaged characteristics of the two STBLI regions indicates that the separated flow can be influenced in two distinct ways. On the one hand, the additional STBLI region affects the local flow parameters at the separation shock and consequently affects the UI, as evidenced by the variations in the extent length. Moreover, consistent with the results of previous studies (Li & Chang Reference Li and Chang2021; Li et al. Reference Li, Chang, Xu, Yu and Bao2021), significant changes are observed in the shock foot position. On the other hand, the gradual approach of the additional separated STBLI region towards the downstream one is accompanied by the presence of a relaxing boundary layer between them that has a thickness equivalent to that of several tens of boundary layers. This relaxation process in the boundary layer further facilitates premature extension of the separation region, and induces alterations in the reattachment position. Consequently, predicting the sudden transfer of the heat-transfer peak caused by the reattachment becomes challenging due to the limited knowledge regarding both the extent of development of the relaxing boundary layer and its ability to withstand the adverse pressure gradient. The superposition of the pressure gradients increases the pressure downstream from the separated flow. This requires the development of a longer shear layer to achieve acceleration and obtain a higher pressure increase during reattachment, resulting in the expansion of the separation region. Time-resolved measurement techniques illustrate that the overall characteristics of the PSD evolution agree quite well with those from the forward-facing-step STBLI (Estruch-Samper & Chandola Reference Estruch-Samper and Chandola2018), impinging STBLI (Agostini, Larchevéque & Dupont Reference Agostini, Larchevéque and Dupont2015), and compression-ramp STBLI (Wu & Martin Reference Wu and Martin2008), when the two interaction regions are sufficiently separated or in close proximity. With specific spacings, the effects are manifested in three distinct forms.
First, the STBLI region can be influenced by an upstream interaction region through the decelerated boundary layer and flow distortion. The sharp decrease in shear stress caused by the upstream interaction region results in an upstream extension of the downstream UI as well as significant displacement of the UI wave. This finding is very similar to the results observed in previous studies of the shock train (Li & Chang Reference Li and Chang2021; Li et al. Reference Li, Chang, Xu, Yu and Bao2021). The downstream location near the interaction region exhibits a gradual decrease in the resistance of the boundary layer to the adverse pressure gradient as the UI wave moves upstream, thereby establishing a positive feedback mechanism. The offset in the upstream direction amplifies the shock oscillation by causing movement of the shock away from its original position.
Additionally, based on the r.m.s. streamwise velocity fluctuations, the PSD map, and the cross-correlation analysis, the high-frequency unsteadiness induced by the shear layer significantly influences the downstream interaction region. This effect is initiated at approximately  $x-x_0=0.5L_{{int}}$, coinciding with the occurrence of vortex shedding. The frequency of this instability decreases as the separation scale increases, aligning with the single-STBLI scenario. Within the shear layer, the vortex structures induce compression waves that subsequently lead to a gradual increase in pressure rather than an abrupt surge following the pressure plateau during the reattachment process.
Finally, the SPOD analysis reveals that low-frequency perturbations can propagate downstream through the flapping of the shear layer. This phenomenon is observed exclusively when the boundary layer separates downstream from the interaction region, even in cases without notable separation. The final observation is noteworthy as it pertains to the low-frequency oscillation mechanism of the STBLI. In the present study, a pressure change occurred at the separation shock foot before that inside the separation bubble in a weakly separated STBLI ( $L_{{int}}\approx 3\delta _1$), whereas in the strongly separated case (
 $L_{{int}}> 5\delta _1$), the reverse was observed. The scale of the separation regions for various studies investigating sources of unsteadiness has been summarised by Clemens & Narayanaswamy (Reference Clemens and Narayanaswamy2009). The findings in the current paper also align with the evaluation criteria outlined in this literature. Although a weak correlation between the fluctuations at the separation shock foot and in the upstream boundary layer was observed in case A, the significant influence of the boundary layer conditions must be acknowledged. The interactions between large-scale low- and high-momentum structures and the shock differed due to the profile associated with the high-momentum region being fuller than that associated with the low-momentum region, facilitating resistance against adverse pressure gradients in the former. Consequently, contraction of the separation bubble occurs at this specific moment. The findings in case B strongly support the notion that when the two interaction regions are widely separated, the low-frequency components of flow between them exhibit minimal magnitudes and weak correlations with the pressure fluctuations in the second STBLI region. However, a notable correlation is observed between the shock motions in the two regions. The oscillation of the separation bubble induces vertical movement of the mixing layer, leading to intermittent incomplete boundary layers downstream, and subsequently impacting the STBLI even further downstream. The present study not only unveils the interaction between the two STBLI regions, but also substantiates the dominance of the upstream and downstream mechanisms in different types of separated STBLI regions.
The analysis of multiple STBLIs presents significant challenges due to various influential factors, including incident shock configurations and geometric curvatures. However, the current research in this area is relatively limited. This study highlights the importance of considering the boundary layer state and offers references for future investigations into complex scenarios. To achieve a comprehensive understanding, further exploration is imperative.
Acknowledgements
The authors would like to express their sincere appreciation to the editor and the referees for their invaluable contributions in enhancing the paper's quality. Furthermore, special acknowledgments are extended to J. Yang, Y. Li, W. Huang, X. Liu and Y. Chen for their valuable assistance in conducting the experiments.
Funding
This work was supported by the National Natural Science Foundation of China (grant no. 12002281).
Declaration of interests
The authors report no conflict of interest.



