INTRODUCTION
Soybean has a great importance for Brazil and southern countries of South America (Mercosul), which appear among the top 10 soybean producers in the world (FAO, 2014). In this region, the main problem for obtaining high yield levels is droughts, which cause losses in grain yield, similar to the one in 2011/2012 crop season, when soybean had large yield losses due to reduced rainfall in southern Brazil caused by a “La Nina” event (Araújo et al., Reference Araújo, Féres and Reis2011).
For reducing yield losses caused by droughts, different crop characteristics and management can be used as drought-tolerant (DT) cultivars. Cultivars have different mechanisms to face droughts, which can be used for improving crop performance under such conditions. Husfstetler et al. (Reference Husfstetler, Boerma, Carter and Earl2007) observed for different soybean cultivars that the water use efficiency varied between 2.72 and 3.24 g of dry matter per kilogram of transpirated water. Sadras and Calviño (Reference Sadras and Calviño2001) observed an increase in soybean yield with the increase of roots until 0.60 m, improving water availability for the crop. Such characteristics can help the selection of more drought-tolerant cultivars, with higher yields under stress conditions.
Another way to identify crop characteristics related to drought tolerance is by using crop simulation models. By using this approach, Sinclair et al. (Reference Sinclair, Messina, Beatty and Samples2010) found that cultivars with lower leaf growth rate had better performance under water deficit, since plants with smaller leaves have less water consumption. On the other hand, such a characteristic is not interesting when there is enough water availability, since smaller leaf area reduces solar radiation interception, resulting in less photosynthesis, and therefore decrease in yield (Boote et al., Reference Boote, Jones, Batchelor, Nafziger and Myers2003).
Drought tolerance characteristics can be identified using specific indices obtained from field experiments and crop simulation models. For soybean, Oya et al. (Reference Oya, Nepomuceno, Neumaier, Farias, Tobita and Ito2004) classified the drought-tolerant cultivars using relative yield, which was obtained by the relationship between rainfed and irrigated yields. Andrioli and Sentelhas (Reference Andrioli and Sentelhas2009) used the FAO–Agroecological zone model, proposed by Kassam (Reference Kassam1977), and the yield response factor to water model, proposed by Doorenbos and Kassam (Reference Doorenbos and Kassam1979), to identify drought tolerance of maize cultivars in Brazil. These authors used water deficit sensitivity index (Ky) from a calibrated crop simulation model for classifying cultivars as of high and normal drought tolerance. The estimated yield showed a mean error ranging from −5.7 to +5.8% and a mean absolute percentage error of 10% when compared with observed maize yield data from different Brazilian states.
In Brazil, the FAO–Agroecological zone model and the water deficit yield depletion model have been used for many purposes, such as yield forecasting (Monteiro and Sentelhas, Reference Monteiro and Sentelhas2014), definition of the best sowing dates (Rolim et al., Reference Rolim, Sentelhas and Ungaro2001) and evaluation of climatic and agricultural efficiencies (Battisti et al., Reference Battisti, Sentelhs and Pilau2012, Reference Battisti, Sentelhs, Pilau and Wollmann2013). As indicated previously, this model also makes possible to identify drought tolerance of cultivars through Ky, which encompass all features associated with crop response to drought (Andrioli and Sentelhas, Reference Andrioli and Sentelhas2009).
Based on this, the aim of this study was to calibrate and evaluate a simple agro-meteorological yield model for 101 Brazilian soybean cultivars, and through the calibration of Ky to identify homogeneous cultivar groups in relation to drought tolerance to help breeders to identify the best genotypes for droughts tolerance as well as growers to select the best cultivars for each environment and sowing date, reducing yield gaps caused by water stress.
MATERIAL AND METHODS
Experimental data
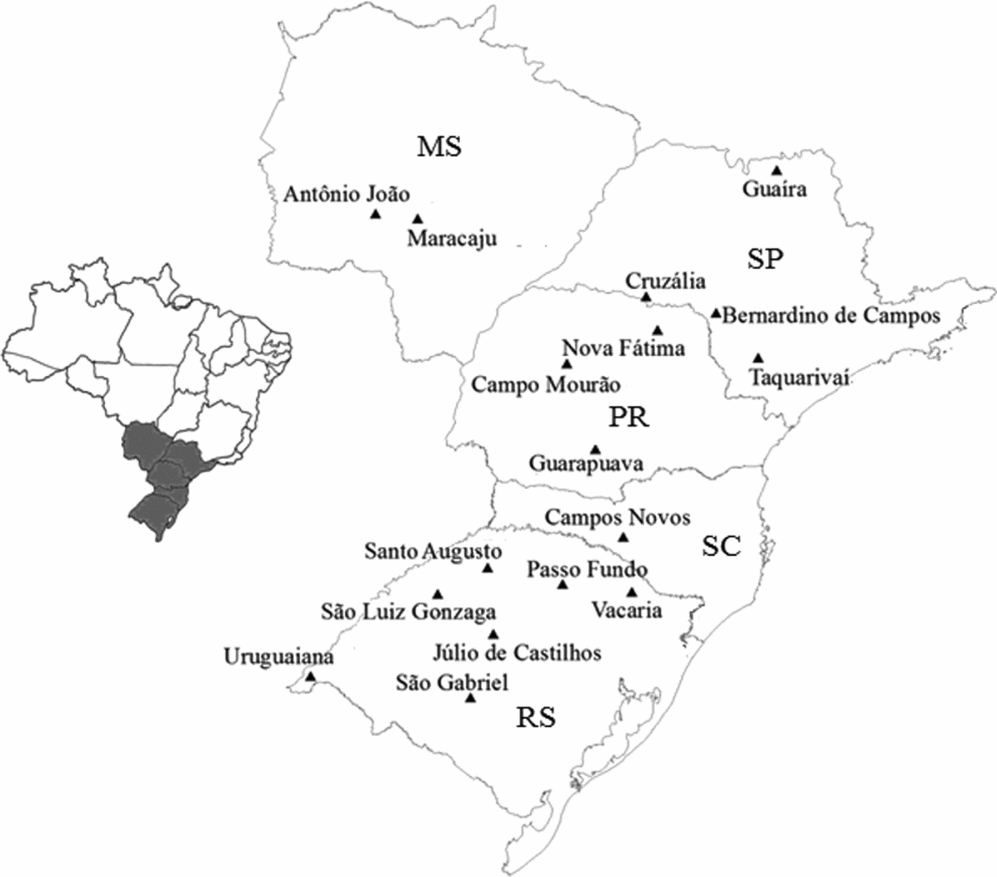
Soybean cultivars competition experiments were carried out by Pro-Seeds Foundation in 17 different counties in the states of Rio Grande do Sul, Santa Catarina, Paraná, São Paulo and Mato Grosso do Sul, Brazil (Figure 1) during the crop seasons from 2008/2009 to 2010/2011. The environmental and growing season data variability was used to evaluate the sensitivity of soybean cultivars to water deficit in order to determine their tolerance to drought (Carbone et al., Reference Carbone, Mearns, Mavromatis, Sadler and Stooksburry2003). In these field experiments, actual yield and emergence, first flower and maturity dates were determined for 101 Brazilian soybean cultivars, which were sown between 27 October and 24 December, within the main sowing period for southern Brazil. Plant density was 30 plants per square meter and fertilization was performed using 50 kg K2O ha−1 and 50 kg P2O2 ha−1. Seeds received insecticide and fungicide treatments and were inoculated with Bradyrhizobium.
Locations in Rio Grande do Sul (RS), Santa Catarina (SC), Paraná (PR), São Paulo (SP) and Mato Grosso do Sul (MS), Brazil, where the field experiments were conducted.

Weather data were obtained from the Brazilian Meteorological Service (INMET), Brazilian Water Agency (ANA) and Brazilian Agricultural Research Company (EMBRAPA) in a daily time-scale. Rainfall (R) data were obtained from the rain gauges installed in experimental fields, while average air temperature (T) and sunshine hours (n) were obtained from the closest weather station, with a distance no greater than 120 km from the experimental field, always considering the representativeness of climate conditions of these locations, based on the high resolution (1 ha) Köppen´s climate classification for Brazil done by Alvares et al. (Reference Alvares, Stape, Sentelhas, Gonçalves and Sparovek2013). The incoming solar radiation (Sr) and net radiation (Rn) were estimated by Angströn-Prescott equation (Sr = SRo × [0.25 + 0.50 × n/N]) and by an empirical equation (Rn = 0.5498 × Sr) respectively (Pereira et al., Reference Pereira, Angelocci and Sentelhas2002). Extraterrestrial solar radiation (SRo) and daylight period or photoperiod (N) were estimated as a function of latitude and day of year, using the equations recommended by Allen et al. (Reference Allen, Pereira, Raes and Smith1998).
Model calibration and evaluation
The crop yield model FAO–Agroecological zone (Kassam, Reference Kassam1977) was used to estimate potential yield (Yp), while the water deficit yield depletion model (Doorenbos and Kassam, Reference Doorenbos and Kassam1979; Rao et al. Reference Rao, Sarma and Chander1988) was used to estimate actual yield (Ya) and to determine Ky for 101 soybean cultivars. Yp was estimated considering only the interaction between the genotype and solar radiation, photoperiod and temperature according to the following equation:
 \begin{equation*}
{\rm Yp} = \sum\limits_{i = 1}^m {{\rm GP}} \; \times \;C_{{\rm LAI}} \times C_{{\rm RESP}} \times C_{\rm H} \times (1 - C_{\rm W} )^{ - 1} ,
\end{equation*}
where Yp is in kg ha−1; GP is the gross photosynthesis (kg DM ha−1 day−1); C LAI is the depletion coefficient to leaf area index (LAI); C RESP is the depletion coefficient associated to the maintenance respiration process as a function of air temperature; C H is the crop harvest index; C W is the water content in the harvested part of the plant; i is the day in the crop cycle; and m is the number of days of crop cycle from sowing to harvesting.
The gross photosynthesis was estimated for the fraction of the day with clear sky (GPc) and overcast (GPo), with daily GP obtained from their sum. GPc and GPo are given by the following equations:
 \begin{equation*}
{\rm GPc = (107}{\rm .2}\;{\rm + }\;{\rm 8}{\rm .604}\; \times \;{\rm SRo)}\; \times \;{\rm cTc}\; \times \;(n{\rm /}N),
\end{equation*}
 \begin{equation*}
{\rm GPo}\;{\rm = }\;{\rm (31}{\rm .7}\;{\rm + }\;{\rm 5}{\rm .234}\; \times \;{\rm SRo)}\; \times \;{\rm cTo}\; \times \;(1 - n{\rm /}N),
\end{equation*}
where SRo is measured as MJ m−2 day−1; and cTc and cTo are dimensionless coefficients associated with the efficiency of photosynthetic process, being a function of crop type and its metabolism with atmospheric CO2 fixation. Both coefficients are temperature-dependent and are calculated by the following equations for summer C3 plants:
 \begin{equation*}
{\rm cTo} = \left\{ {\begin{array}{ll}{\begin{array}{l}0.583 + 0.014\; \times \;{\rm T}\;{\rm + }\;{\rm 0}{\rm .0013}\; \times \;{\rm T}^{\rm 2}\\
\quad -\, 0.000037\; \times \;{\rm T}^{\rm 3}\end{array}} & {(16.5\;^\circ {\rm C} \le {\rm T} \le 37.0\;^\circ {\rm C})} \\
{\begin{array}{l} - 0.0425 + 0.035\; \times \;{\rm T}\;{\rm + }\;{\rm 0}{\rm .00325}\; \times \;{\rm T}^{\rm 2}\\
\quad -\, 0.0000925\; \times \;{\rm T}^{\rm 3} \end{array}} & {(16.5\;^\circ {\rm C}\;{\rm > }\;{\rm T}\;{\rm > }\;37.0\;^\circ {\rm C})} \hfill \\
\end{array}} \right\},
\end{equation*}
 \begin{equation*}
{\rm cTc} = \left\{ {\begin{array}{ll}
\begin{array}{l} - 0.0425 + 0.035\; \times \;{\rm T}\;{\rm + }\;{\rm 0}{\rm .00325}\; \times \;{\rm T}^{\rm 2} \\
\quad -\, 0.0000925\; \times \;{\rm T}^{\rm 3} \end{array} & {(16.5\;^\circ {\rm C} \le {\rm T} \le 37.0\;^\circ {\rm C})} \\
{\begin{array}{l} - 1.085 + 0.07\; \times \;{\rm T}\;{\rm + }\;{\rm 0}{\rm .0065}\; \times \;{\rm T}^{\rm 2}\\
\quad -\, 0.000185\; \times \;{\rm T}^3 \end{array}} & {(16.5\;^\circ {\rm C}\;{\rm > }\;{\rm T}\;{\rm > }\;37.0\;^\circ {\rm C})} \hfill \\
\end{array}} \right\}.
\end{equation*}
C RESP was 0.5 when the average temperature was equal or higher than 20 °C and 0.6 when the average temperature was lower than 20 °C (Doorenbos and Kassam, Reference Doorenbos and Kassam1979). C W index was considered as 13%, as recommended for storage soybean seeds. All observed yield data were converted to a grain water content of 13%. C H was calibrated as a function of mean actual yield for each county with all cultivars and for each cultivar with all counties by an iterative process together with Ky calibration. C LAI is the correction for crop development over time and leaf area (Kassam, Reference Kassam1977).
C LAI is determined in relation to the maximum crop growth rate during the middle of the total growing period. As crop growth is less at the start and the end of the growing period in relation to maximum growth, a correction is required, since for a standard crop, an active LAI = 5 is assumed. When LAI is less than 5, a correction must be applied; and when it is more than 5, the effect is small (Kassam, Reference Kassam1977). C LAI is calculated with the following equation:
 \begin{equation*}
C_{{\rm LAI}} = 0.0093\; + \;0.185\; \times \;{\rm LAI}_{{\rm max}} \; - \;0.0175\; \times \;{\rm LAI}_{{\rm max}^{\rm 2} } ,
\end{equation*}
where LAImax is the maximum leaf area index during the crop cycle. For LAImax ≥ 5.0, C LAI = 0.5 (Pereira et al., Reference Pereira, Angelocci and Sentelhas2002). LAImax was obtained as a function of vegetative phase duration (VF), from emergence to first flower, by an equation developed with the data from Rodrigues et al. (Reference Rodrigues, Teixeira, Didonet, Lambhy, Bertagnolli and Luz2006):
 \begin{equation*}
{\rm LAI}_{{\rm max}} = 0.0851 \times {\rm VF}\;{\rm + }\;{\rm 0}{\rm .6598}\;{\rm (SEE}\;{\rm = }\;{\rm 0}{\rm .56;}\,r^2 = 0.57).
\end{equation*}
After calculating Yp, Ya was estimated by considering the effect of water deficit on crop growth. Ya was estimated with the equation presented by Doorenbos and Kassam (Reference Doorenbos and Kassam1979) and Rao et al. (Reference Rao, Sarma and Chander1988):
 \begin{equation*}
{\rm Ya} = {\rm Yp}\; \times \;\prod\limits_{i\;{\rm = }\;{\rm 1}}^n {\left( {{\rm 1 - Ky}_i \;{\rm \times }\;\left( {{\rm 1} - \frac{{{\rm ETa}_i }}{{{\rm ETc}_i }}} \right)} \right)} ,
\end{equation*}
where Ya is in kg ha−1; Kyi is the water deficit sensitivity index; ETai is the actual evapotranspiration determined by the crop water balance (Thornthwaite and Mather, Reference Thornthwaite and Mather1955); ETci is maximum crop evapotranspiration; i is the crop phase considered; and n is the total of crop phases during the soybean crop cycle.
The maximum crop evapotranspiration was obtained by the product of reference evapotranspiration, estimated by the Priestley and Taylor (Reference Priestley and Taylor1972) method, and crop coefficient (kc) for each i crop phase: establishment (kcS–V2 = 0.56); vegetative growth (kcV2–R1 = 1.21); flowering/yield formation (kcR1–R5 = 1.5); and maturity (kcR6–R8 = 0.9) (Farias et al., Reference Farias, Assad, Almeida, Evangelista, Lazzarotto, Neumaier and Nepomuceno2001; Fehr and Caviness, Reference Fehr and Caviness1977). Soil water holding capacity was determined for each type of soil by pedotransfer functions, presented by Lopes-Assad et al. (Reference Lopes-Assad, Sans, Assad and Zullo2001) and Reichert et al. (Reference Reichert, Albuquerque, Kaiser, Reinert, Urach and Carlesso2009).
Actual yield was estimated with Ky calibrated for each crop phenological phase and using the values recommended by FAO (KyS–V2 = 0.0; KyV2–R1 = 0.2; KyR1–R5 = 0.9; KyR6–R8 = 0.0) (Doorenbos and Kassam, Reference Doorenbos and Kassam1979), which were also used for starting the calibration process. The calibration of Ky aimed to minimize the mean absolute error between observed and estimated Ya for each cultivar by using an iterative process. The calibration of the crop model considered 984 soybean actual yield values, whereas for the evaluation of the model, 143 independent actual yield data were used, being selected randomly among different regions, seasons and cultivars.
Model evaluation
For evaluating the crop yield model performance, several statistical indices were employed, such as: determination coefficient (r 2); Willmott agreement index (d) and performance index (c). Coefficient r 2 is a measure of precision whereas d is a measure of accuracy. Both r 2 and d indices range from 0 to 1, where 0 means no precision or agreement, and 1 means perfect precision or agreement. Index d is calculated by the following equation: d = 1 – [Σ(Pi – Oi)2/Σ(|Pi – O| + |Oi – O|)2], in which Pi is the estimated Ya; Oi is the observed Ya and O is the average observed Ya. Performance index c also ranges from 0 to 1, and is obtained by c = √r 2 × d (Camargo and Sentelhas, Reference Camargo and Sentelhas1997). Performance index (c) can be classified as excellent (>0.85); very good (0.76–0.85); good (0.66–0.75); reasonable (0.61–0.65); poor (0.51–0.60); very poor (0.41–0.50) and extremely poor (<0.40). Ya mean absolute error (MAE), which gives the magnitude of error, and mean error (ME), which indicates the tendency of error, were also determined.
Grouping drought-tolerant cultivars
The degree of tolerance of each cultivar to water deficit was measured by the magnitude of Ky values, since low Ky represents a high drought tolerance and vice versa. For grouping cultivars in relation to drought tolerance, a matrix with calibrated Ky values was built for each phenological phase (column) and each soybean cultivar (line). With such a matrix, groups of homogeneous drought tolerance were determined with cluster analysis through the Ward's method, with the Euclidean distance index used to share groups. High values of Euclidean distance represent less similarity in soybean cultivars to drought tolerance and vice versa. This analysis was made on software Statistica 8.0 (Statsoft, 2008). To define the groups of drought tolerance, a pre-analysis with 2, 3 and 4 groups was made, evaluating the average Ky in the R1–R5 phase, which was the most sensitive phase to water deficit. With Ky, Yp and C H calibrated for each group, a simulation of the relative crop yield loss as a function of water deficit during R1–R5 phase was performed to evaluate the response of each group of cultivars to water stress.
RESULTS
Model calibration and evaluation
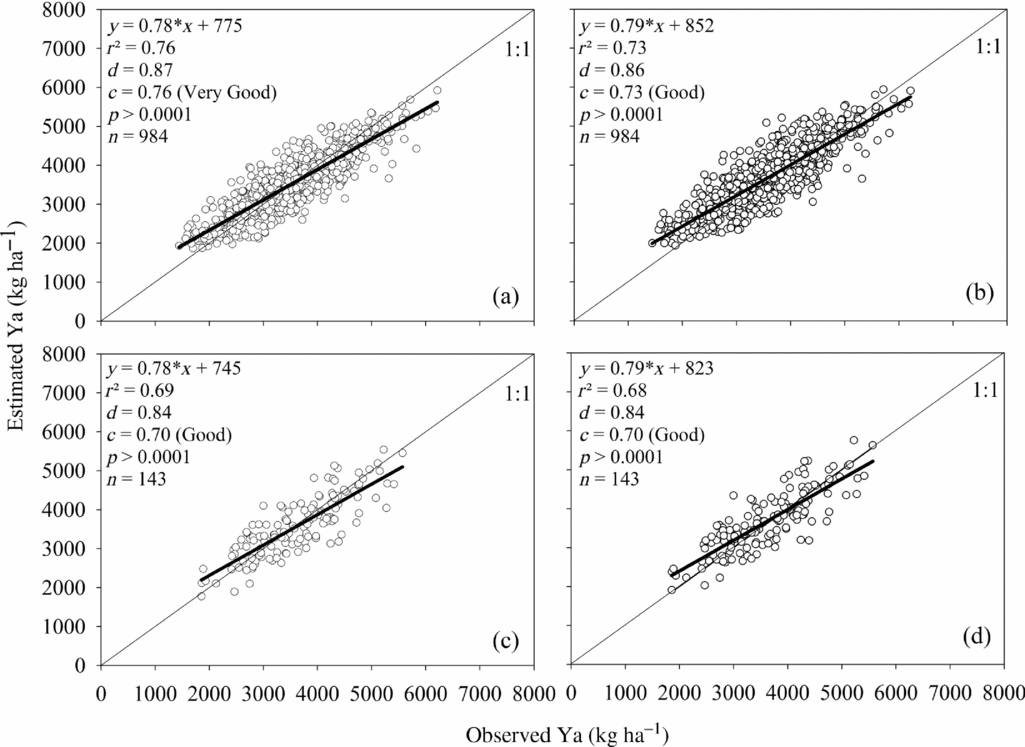
The soybean yield model showed better performance results when Ky values were calibrated for each cultivar. The performance under this condition was considered very good (c = 0.76), while Ky values from FAO resulted in a good performance (c = 0.73) (Figures 2a and b). Soybean yield estimates with calibrated Ky also presented a slight reduction in data dispersion (r 2 = 0.76) when compared with the estimates of Ky from FAO (r 2 = 0.73). Agreement index had a similar result for each crop yield simulation, being between 0.84 and 0.87, which shows a high accuracy of model to estimate actual yield. In addition, the estimates with calibrated Ky also resulted in lower values of MAE (284 kg ha−1) and ME (7 kg ha−1). The estimated Ya values were 3544 kg ha−1 and 3652 kg ha−1 respectively to the calibrated and FAO Ky, while the average observed Ya was 3351 kg ha−1. In the phase of evaluation of the crop yield model with independent data, the performance was considered good, independent of the Ky value used (Figures 2c and d).
Relationship between observed and estimated soybean actual yield (Ya) for 101 Brazilian cultivars for the calibration phase (a and b), and the evaluation phase (c and d), using Ky values proposed (a and c), and recommended by FAO (b and d).
Groups of drought-tolerant cultivars
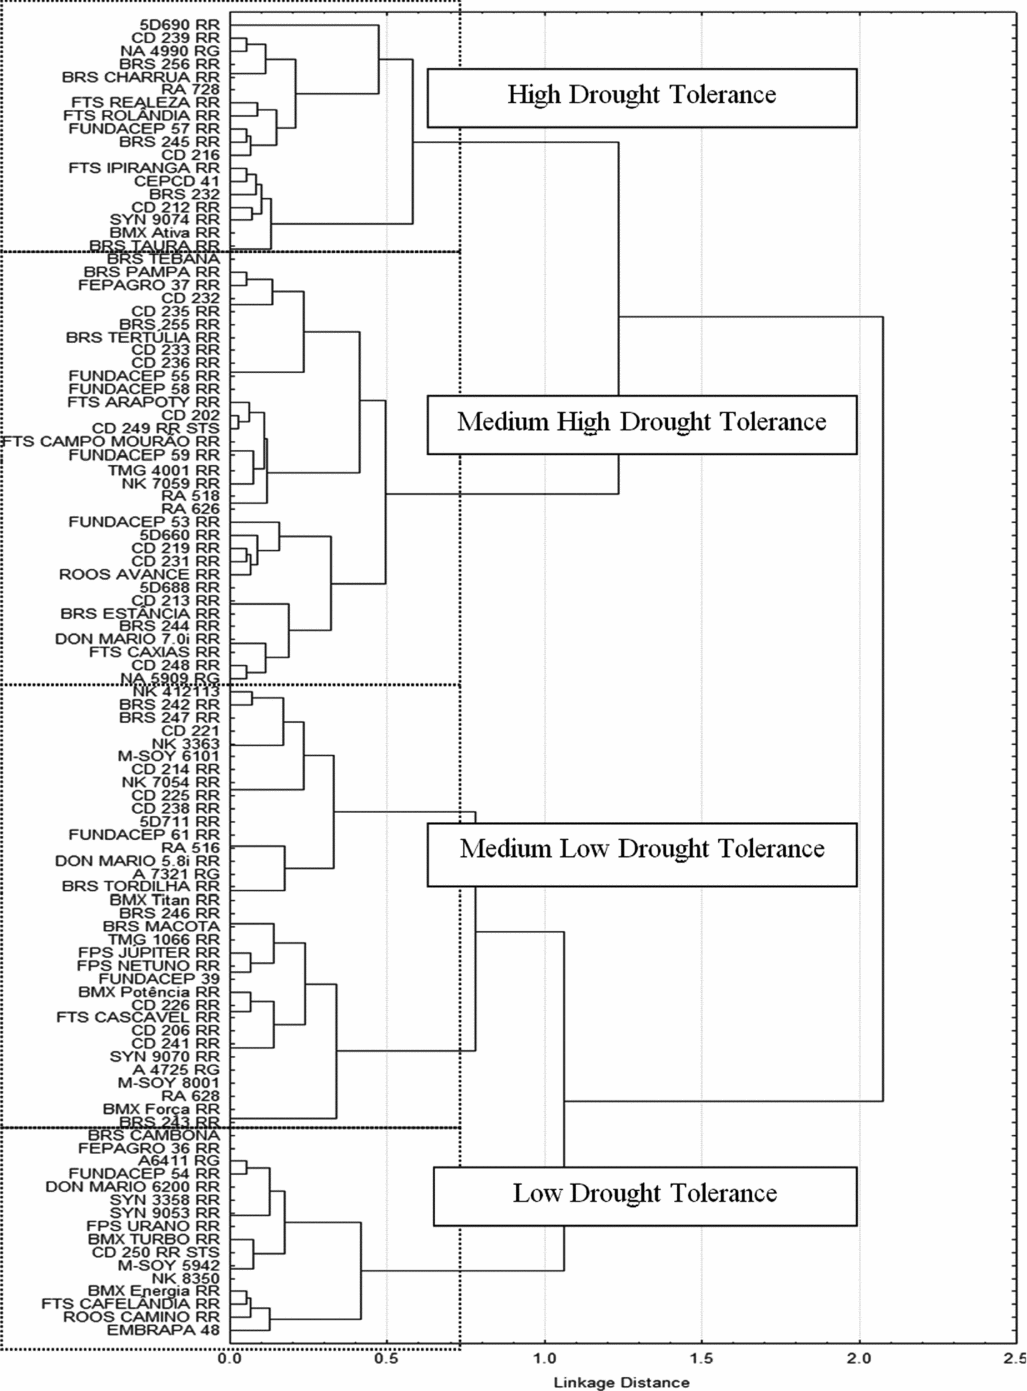
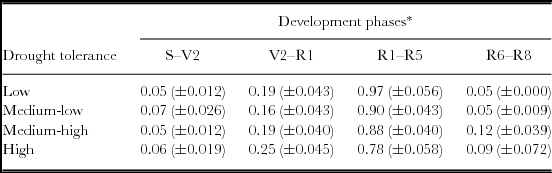
Considering the calibrated Ky values for all phenological phases of each soybean cultivar, a cluster analysis was applied to classify these cultivars in terms of their tolerance to drought. The cultivars were divided into four groups: high, medium-high, medium-low and low drought tolerance (Figure 3). The main difference among the groups was observed for the flowering/yield formation phase, which presented the highest Ky values. For the establishment phase, Ky ranged from 0.05 to 0.07 (Table 1), with very similar values in drought-tolerant groups and few effects on yield when compared with other phases. In the vegetative phase, the average Ky was very close to the value recommended by FAO, which is 0.20, but ranging between 0.16 and 0.25 (Table 1). For the maturity phase, Ky values varied between 0.05 and 0.12 (Table 1).
Cluster analysis determined by the Ward's method, with Euclidean distances used to define drought-tolerant (DT) groups, based on water deficit sensitivity index (Ky) calibrated to each phenological phase of 101 Brazilian soybean cultivars.
Average water deficit sensitivity index (Ky) and standard deviation for Brazilian soybean cultivars groups in each phenological phase.
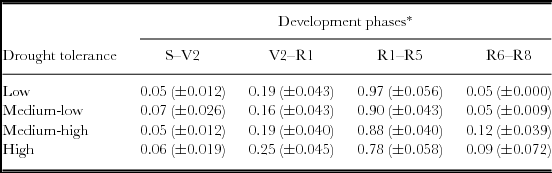
*Establishment (S–V2), vegetative growth (V2–R1), flowering/yield formation (R1–R5) and maturity (R6–R8).
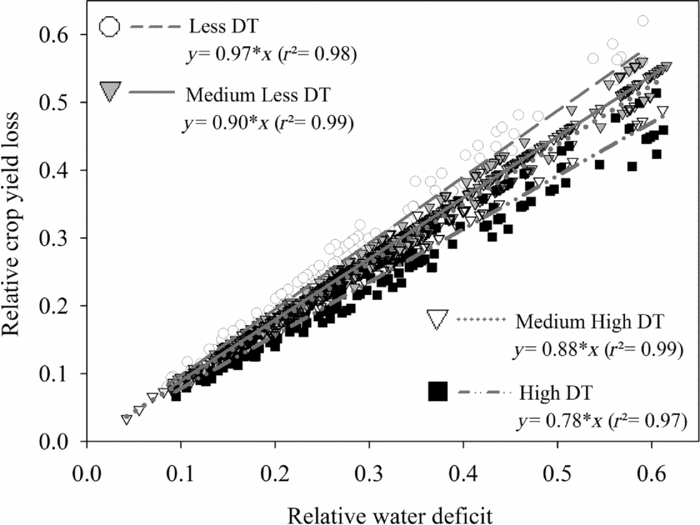
The most sensitive phenological phase to water deficit was flowering/yield formation with Ky of 0.97, 0.90, 0.88 and 0.78 respectively for the groups with low, medium-low, medium-high and high drought tolerance (Table 1). The Ky values of this phase were different among groups. Differences in Ky among cultivars for flowering/yield formation phase resulted in different relative yield losses among drought-tolerant groups (Figure 4). When relative water deficit is close to zero, the relative crop yield loss is approximately zero for all drought-tolerant groups. With the increase of relative water deficit, the groups tend to have different levels of yield losses according to the slope of regression line (Figure 4). For the extreme water stress condition observed in field experiments, with relative water deficit of 60% during flowering/yield formation phase, the relative crop yield losses were 58, 54, 53 and 47% respectively for the groups with low, medium-low, medium-high and high drought tolerance.
Relationship between relative crop yield loss (1 – Ya/Yp) and relative water deficit (1 – ETa/ETc) during flowering/yield formation phase (R1–R5) for the drought-tolerant (DT) groups of Brazilian soybean cultivars.
Interaction between drought tolerance and harvest index (CH)
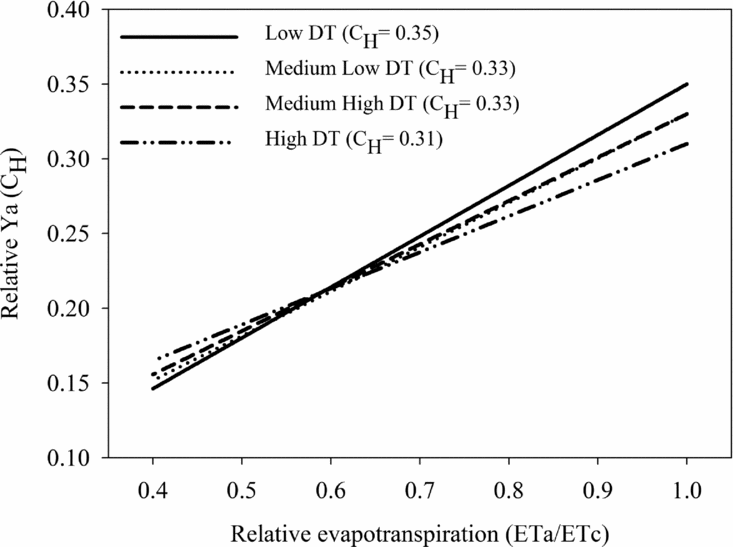
Notwithstanding the differences in Ky values for the flowering/yield formation phase among drought-tolerant cultivar groups, C H also varied among these groups, ranging from 0.31 to 0.35 respectively for the group of high to low drought tolerance (Figure 5). Majority of the experiments used in this study had soil water availability of above 60% of field capacity during flowering/yield formation phase, favouring high yields for the group of low drought tolerance, which presented the actual yield of 3688 kg ha−1, followed by medium-low, medium-high and high drought-tolerant groups, with 3617, 3525 and 3425 kg ha−1 respectively. These results are in agreement with cluster analysis (Figure 3), corresponding to what was simulated by the crop yield model (Figure 5).
Relationship between relative evapotranspiration during flowering/yield formation phase (R1–R5) and relative actual yield (represented by C H = total grain mass/total mass) for drought-tolerant (DT) groups of Brazilian soybean cultivars.
DISCUSSION
The performance of the soybean yield model used in the present study was superior to those obtained by other authors. Moraes et al. (Reference Moraes, Camargo, Mascarenhas, Miranda and Pereira1998), using the same soybean yield model with a general Ky, obtained MAE between 322 kg ha−1 and 994 kg ha−1, whereas Monteiro and Sentelhas (Reference Monteiro and Sentelhas2014) found MAE of 300 kg ha−1, both for Brazilian conditions, showing that the present model has acceptable performance. Besides improvement in the crop yield model performance, another advantage when using calibrated Ky for each cultivar is the possibility of identifying different groups of drought tolerance through this index. According to Kaboosi and Kaveh (Reference Kaboosi and Kaveh2010), the Ky value has more influence on estimating yield than crop evapotranspiration, and one of the factors that affect Ky is the cultivar characteristics. Andrioli and Sentelhas (Reference Andrioli and Sentelhas2009) also observed acceptable estimates of actual yield for maize crop using the same model. They concluded that the model has potential to be used as yield forecaster and for crop zoning, choice of best sowing dates and identifying the level of drought tolerance in different cultivars. These results make possible to use such crop model to estimate soybean yield in diverse conditions of Brazil by considering different crop cycles, cultivars and locations.
The most sensitive crop phase to water deficit was flowering/yield formation one, which is proved by the highest Ky values obtained for this phase. Water deficit during such crop phase is mainly responsible for soybean yield gaps, as also observed in other studies (Confalone et al., Reference Confalone, Bernardes, Costa, Righi, Dourado-Neto, Martin, Manfron and Pereira2010; Dogan et al., Reference Dogan, Kirnak and Copur2007; Karam et al., Reference Karam, Massad and Sfeir2005). It is explained by the highest total leaf area in this phase, resulting in 1.5 times more water consumption than the reference crop used for the calculation of evapotranspiration (ETo). Moreover, during this phase there is an intense pod (R3) and seed (R5) growth, more sensitive sub-phases within flowering/yield formation phase (Dogan et al., Reference Dogan, Kirnak and Copur2007).
During the establishment phase, the smallest effect of water deficit on soybean yield was observed, which is associated with the fact that soybean plants can compensate losses in this phase since the conditions in next phases become favourable for growth (Karam et al., Reference Karam, Massad and Sfeir2005). In the vegetative phase, Ky values are low due the phenotypic plasticity of soybean crop, which allows the plants to recover from yield losses if the soil water conditions become more favourable in next phases (Confalone et al., Reference Confalone, Bernardes, Costa, Righi, Dourado-Neto, Martin, Manfron and Pereira2010; Karam et al., Reference Karam, Massad and Sfeir2005; Neyshabouri and Hatfield, Reference Neyshabouri and Hatfield1986). In spite of low values observed in the maturity phase, the best performance of the models occurs when yield was penalized in this phase, since high yield cultivars keep accumulating dry matter in seeds and increasing yield even during this period (Liu et al., Reference Liu, Jin, Herbert, Zhang and Wang2005).
The obtained values of Ky and C H show that when considering two cultivars with the same total dry matter, considering a mean C H value, obtained from model calibration, the one from the group of low drought tolerance should be preferred, where the relative evapotranspiration is above 60% during flowering/yield formation phase, since the relative yield is the highest among other groups. Nevertheless, if relative evapotranspiration is lower than 60%, then the cultivar from the group of high drought tolerance should be chosen.
These results indicate that cultivars with high potential yield, represented by the highest C H in the model, can have its yield drastically reduced under intense water deficit, mainly during reproductive phase. Catuchi et al. (Reference Catuchi, Vitolo, Bertolli and Souza2011), working with soybean cultivars CD 202 and CD 226 RR, found total dry matter (TDM) was similar between cultivars when both were irrigated; however, CD 226 RR presented more pod dry matter (PDM) than CD 202. Under water deficit condition, the PDM was similar between cultivars. The authors observed that cultivar CD 202 had a relationship between PDM and TDM, which increased under water deficit condition, while for CD 226 RR this relationship was similar for both irrigated and rain-fed conditions.
Oya et al. (Reference Oya, Nepomuceno, Neumaier, Farias, Tobita and Ito2004), while studying soybean drought tolerance through relative yield, given by the ratio between water limited and irrigated yields, observed that actual yield is not only defined by drought tolerance but also by C H and TDM of cultivars, which are their response to environmental conditions. Evaluating two Brazilian soybean cultivars, these authors found that cultivar BRS 134 was more productive than cultivar EMBRAPA 48 under irrigation, with the respective yields of 4150 kg ha−1 and 3570 kg ha−1. Under rainfed conditions, with water deficit occurring during the reproductive phase, the cultivars had similar yields (≈1000 kg ha−1), proving that cultivar BRS 134 is less tolerant to water deficit than cultivar EMBRAPA 48, which was also associated to higher C H of the former one. These results agree with our findings, which show that cultivars with high grain yield potential under good conditions of soil water availability can perform poorly, with high yield gap, when submitted to water deficit. So the analysis of actual soybean yield in different regions should consider interaction between cultivar characteristics and local conditions (weather and soil) and also between TDM and C H, since these can vary according to genotype, the length of yield formation phase and the cultivar versus environment interactions (Boote et al., Reference Boote, Jones, Batchelor, Nafziger and Myers2003).
CONCLUSIONS
The calibrated and evaluated soybean yield model proved to be an efficient tool for identifying drought tolerance in soybean cultivars. According to the crop model, the Brazilian soybean cultivars were classified into four drought-tolerant groups, considering the Ky index during the flowering/yield formation phase as the criteria for such discrimination: high tolerance with 18 cultivars; medium-high tolerance with 33 cultivars; medium-low tolerance with 34 cultivars and low tolerance with 16 cultivars. The interaction observed between soybean drought-tolerant groups and C H is an important means to choose the best cultivar for a specific environment in order to reduce yield gaps, and also to guide plant breeders for selecting drought-tolerant genotypes.