Current literature indicates that stimulating and nurturing environments in childhood may enhance the growth and resilience of the brain and protect against cognitive decline later in life (Wilson et al., Reference Wilson, Barnes and Bennett2003; Anstey, Reference Anstey2013). As such, fewer years of education has emerged consistently as a key risk factor for dementia worldwide (Caamaño-Isorna et al., Reference Caamaño-Isorna, Corral, Montes-Martinez and Takkouche2006; Sharp and Gatz, Reference Sharp and Gatz2011). Years of formal education is therefore often favored as a straightforward measurement to capture childhood cognitive enrichment. However, in certain ethnic minorities and Indigenous groups, such as Aboriginal Australians, quality as well as quantity of formal education may be reduced. Other measures may be necessary to assess early environmental influences on cognitive reserve (Manly and Mayeux, Reference Manly, Mayeux, Anderson, Bulato and Cohen2004), which is the capacity to maintain cognitive function despite the existence of brain pathology associated with dementia (Stern, Reference Stern2009). It is reasonable to assume that enriching activities (informal education), such as traditional cultural practices, games, sport, community involvement, reading, art, and music, may also protect against dementia and cognitive impairment in late life (Kramer et al., Reference Kramer, Bherer, Colcombe, Dong and Greenough2004).
Considering the higher rates of dementia among Aboriginal Australians, it is important to understand the level of formal and informal education in this population. Dementia prevalence has been found to be three to five times higher in Aboriginal Australians than in the general Australian population (Smith, 2008; Radford et al., Reference Radford2015). In non-Indigenous populations, age, female gender, and lack of education have been consistently associated with greater risk of dementia (Meng and D'Arcy, Reference Meng and D'Arcy2012). Other psychosocial risk factors have also been identified, such as childhood trauma (Majer et al., Reference Majer, Nater, Lin, Capuron and Reeves2010; Pesonen et al., Reference Pesonen2013) and low socioeconomic status in childhood including living in rural areas (Borenstein et al., Reference Borenstein, Copenhaver and Mortimer2006; Hall and Hendrie, Reference Hall and Hendrie2012). Such risk factors may also increase the vulnerability of older Australian Aboriginal people to dementia, but the impact of childhood environment on health, aging, and dementia risk requires further investigation in this population.
Engagement in cognitively enriching activities in childhood may have impact on cognitive reserve (Jefferson et al., 2013). However, there is currently no retrospective measure of childhood enrichment that incorporates informal education, such as traditional Indigenous learning and engagement, which could capture a different or additional type of childhood enrichment that conventional measures like “years of education” would not. The Retrospective Indigenous Childhood Enrichment (RICE) scale was designed to assess the extent to which older Australia Aboriginal people participated in, or were exposed to, traditional culture, social and community engagement, physical activity, and other forms of stimulation outside of school during their childhood. The aim of the study was to determine the factor structure and test–retest, inter-method, and inter-rater reliability of a newly developed measure of childhood enrichment relevant to Aboriginal Australians, as well as to explore the construct validity of the scale in relation to other measures of childhood environment. It was hypothesized that higher scores on the RICE scale and subscales would correlate with more years of education, growing up in urban areas, and lower scores on a measure of childhood trauma. It was also hypothesized that age and gender would not necessarily be correlated with scores on the scale, given the wide range and mostly general nature of activities included in the scale.
Method
Participants
The RICE scale was validated in two distinct studies. These studies were part of a broader epidemiological project, the Koori Growing Old Well Study (KGOWS), investigating aging and dementia in Aboriginal Australians from urban and rural communities. The exclusion criteria were consistent with KGOWS and therefore included stroke within the last three months and current incarceration (Radford et al., Reference Radford2014). Study 1 involved a population-based sample of 336 Australian Aboriginal people aged 60 years and older living in in New South Wales who participated in KGOWS (Radford et al., Reference Radford2014). Data from four participants with long-standing cognitive impairment related to other mental health conditions were excluded from analyses as a future aim of this research is to ascertain the effectiveness of the RICE scale as a predictor of the onset of dementia or mild cognitive impairment. Study 2 included a convenience sample of 38 participants aged 50 years and over living in Sydney who were identified as Aboriginal Australian. Approvals were obtained from the Aboriginal Health and Medical Research Council (615/07) and the University of New South Wales Human Ethics Committee (HREC08003). All participants provided written-informed consent.
Measures
Retrospective Indigenous Childhood Enrichment (RICE) scale
The RICE scale was developed by Indigenous and non-Indigenous researchers in collaboration with Aboriginal communities and consists of items about participation in, and exposure to, various childhood activities and environments. A copy of the final version of the scale is provided (Appendix A). A broad range of activities was selected drawing on existing literature (Scribner and Cole, Reference Scribner and Cole1973; Kramer et al., Reference Kramer, Bherer, Colcombe, Dong and Greenough2004), including cognitive, social, and physical activities, as well as traditional cultural activities. Input and advice was sought and generously provided by older Aboriginal Australians from Sydney in New South Wales, who were community representatives and/or participants in an initial pilot study (n = 30), in order to refine the face validity of the scale. The original set of items contained 26 questions. Five of these were excluded from the current scale; two questions inquired about activities that continued into adulthood and three questions asked participants to provide more detail on the nature of any art, craft, or musical activities. The final scale, used in this study, had 21 items. The questions asked about exposure to and participation in (i) traditional Aboriginal cultural activities, such as art, stories, ceremonies, (ii) community events, (iii) physical activity, (iv) reading, and (v) playing games. Each question was scored using a 5-point Likert scale (1 = Never, 5 = Very Often or 1 = None, 5 = A lot). When completing the RICE Scale, all participants were asked to think about their life up to age 15 years (inclusive). For items asking about traditional Aboriginal activities, participants were instructed to define “traditional” in a way that was appropriate to them.
Other measures
Participants provided demographic details including age, sex, geographical area where they lived for most of their childhood (coded as urban or regional/remote) and education level. Total years of formal education was calculated based on the highest educational level completed. For example, if a person left school mid-way through Year 8, highest educational level completed would be Year 7 (7 years). If a person completed a bachelor's degree, years of education was calculated as 15 years (12 years of school and 3 years of university). Study 1 also included the Childhood Trauma Questionnaire (Bernstein and Fink, Reference Bernstein and Fink1997): a valid and reliable retrospective self-report measure of childhood abuse and neglect. It consists of 25 items (and three minimization screening questions, not included in the total score) rated on a 5-point Likert scale (1 = Never True to 5 = Always True).
Procedure
In Study 1, the RICE scale was administered by structured interview as part of a longer assessment (Radford et al., Reference Radford2014). In Study 2, participants completed the RICE scale via interview (answering the questions asked by a health worker or researcher), or via self-administration (using the same form with pen and paper). Mode of administration was determined by participant preference or necessity (e.g. visual or manual impairment). Test–retest reliability was assessed by re-administration of the scale 14 days later (M = 14.11, SD = 6.78). Inter-rater reliability was assessed by asking a blinded second rater to listen to the recorded interviews and fill out Likert-scale responses on the form used in the interview setting.
Statistical analysis
A statistical software package (IBM – SPSS version 23) was used to analyze data, with statistical significance set at α = 0.05. Exploration of Study 1 data, using the Keiser–Meyer–Olkin Measure of Sampling Adequacy (KMO) (0.805) Bartlett's Test of Sphericity was significant (χ2 (210) = 1.514.76, p < 0.001) and showed the RICE Scale met criteria for parametric analyses with a KMO value above the recommended level of 0.6 (Tabachnick & Fidell, Reference Tabachnick and Fidell1996). Forty-two participants had missing values on one or more of the RICE items. Missing values were assessed visually for any systematic reason for data loss. Random loss was verified using Little and Rubin's (1987) Missing Completely At Random Test (MCAR). List-wise deletion was used. Data for 294 participants were included in analyses. There were no significant differences in years of education and sex distribution between the 294 included and 42 excluded participants in Study 1. Those whose data was excluded were older on average (M =70.02, SD = 8.57) than those whose data was included (M = 66.15, SD = 5.73, p = 0.007).
The RICE scale structure was examined by factor analyses to identify highly correlated items and, in turn, identify underlying subconstructs that may be being measured by groups of items (Study 1). These initial analyses were carried out using Eigenvalues of greater than 1 and Oblimin Rotation to allow non-orthogonal solutions. A scree plot of eigenvalues was used for visual confirmation of likely solutions. Subsequent extractions of likely factor solutions were undertaken using Varimax Rotation. Internal consistency reliability was used to examine the extent to which the instrument measures the same construct (Cronbach's α). Convergent validity was assessed by correlations (Pearson's r) between the RICE scores (Total and Factors) and years of formal education. Construct validity was also explored by examining associations with demographic factors and with other measures of childhood environment using independent t-tests to examine between-group differences in total scores according to childhood residential setting (urban versus rural or remote), formal education (median cut-off: 10 years) and CTQ score (cut-off: 36, scores higher than which suggest a childhood affected by neglect or abuse). We also assessed associations of RICE scores with current age (median cut-off: 65) and gender.
Further reliability analyses were performed using data obtained in Study 2. First, test–retest reliability was assessed for the total and factor scores obtained at Time 1 and 2 using intra-class coefficients (ICC). Second, inter-rater reliability was also assessed using intra-class coefficients for total, factor, and item scores. Third, inter-method reliability was tested using independent t-tests to compare mean scores obtained using different modes of administration (interview and self-administration) for total and factor scores.
Results
Participants
The mean age of participants in Study 1 (n = 294) was 66.61 years (SD = 6.3) and 177 (60.2%) were women. One hundred and twenty eight (43.5%) currently lived in urban communities (i.e. major cities). Ninety two (31.3%) lived in major cities as children. One hundred and seventy six (59.8 %) had fewer than 10 years of formal education (overall sample M = 9.3, SD = 2.9). Women were more likely than men to have 10 or more years of formal education (n = 88 (44%) vs. n = 44 (32%), χ2 1, n = 46) = 115.5, p < 0.001). The mean childhood trauma score on the CTQ was 36.67 (SD = 16.78).
The mean age of participants in Study 2 (n = 38) was 70.15 years (SD = 8.38). Twenty five (65.8%) were women. One participant chose not to complete the RICE at Time 2 due to bereavement, leaving 37 participants’ data included in the reliability analysis.
Questionnaire structure
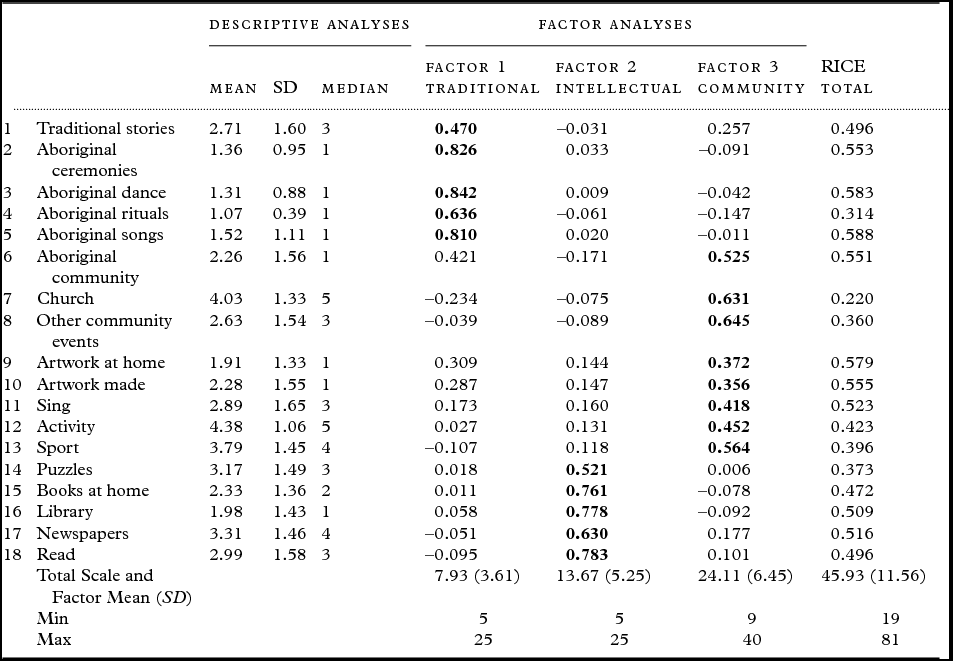
The distribution of Study 1 data was close to normal with a skewness of 0.28 (SEM 0.142) and kurtosis of –0.094 (SEM 0.283). The final factor analysis extracted three factors (based on the scree plot). This solution suggested the removal of three items, which loaded below 0.3 on all factors: Music (How often was music played in your home or on the radio?), Pretend (How often did you play “make believe” or pretend/role play games?), and Instrument (How often did you play an instrument?). This reduced the number of items to 18. Five (5) items measuring frequency of involvement in traditional Aboriginal cultural learning or activities loaded together on Factor 1 (Traditional). Five (5) items loading on Factor 2 described reading and information gathering activities (Intellectual) and eight items loading on Factor 3 described activities and exposure to social and interpersonal activities (Community). Two items, Art at home (Item 9) and Art made (Item 10), loaded similarly on Factor 1 (Traditional) as well as Factor 3 (Community). These two items were maintained as part of Factor 3 (Community) given qualitative data obtained during administration of the scale: art making was often undertaken as a social activity (women's craft circles) or as part of teaching children about Aboriginal traditions (e.g. older men teaching boys how to make boomerangs). Table 1 shows loadings for the three-factor solution using 18 items and descriptive statistics (means and standard deviations) for each item, the total RICE scale and the three factors.
Retrospective Indigenous Childhood Enrichment scale (RICE): Descriptive Statistics (Mean, SD, Min, Max) and factor loading of the items

N = 294.
Bolded values indicate loading of items on each factor.
The internal consistency of the scale as a whole was good with Cronbach's α of 0.79. All but two items (Item 4 Rituals and Item 7 Church) contributed positively to the reliability of the scale. Those items, if deleted, increased alpha by only 0.001 and so were retained. The internal consistency of the subscales was moderate with Cronbach's α of 0.72 for Factor 1 (Traditional) and 0.76 for Factor 2 (Intellectual). Cronbach's α for Factor 3 (Community) was acceptable at 0.69.
Items were significantly correlated (p<0.05) with other items, but mean inter-item correlation for the total RICE scale was low at 0.18. Mean inter-item correlations were similarly low for the individual factors, i.e. Factor 1 (Traditional) was 0.19, Factor 2 (Intellectual) was 0.19 and Factor 3 (Community) was 0.18, confirming that items within subscales measured different aspects of childhood enrichment.
Response categories
In Study 1, the full range of responses (i.e. 1 through 5) was used for every item. Two people (0.6%) scored the minimum of 19, and one person scored the maximum of 81 (0.3%). The mean and median responses to each item described this cohort as physically active, church going with relatively less frequent involvement in traditional Aboriginal Cultural activities. The most frequently endorsed item on Factor 1 (Traditional) was Item 1 Stories suggesting a strong oral culture among families and community members. The most frequently endorsed item on Factor 2 (Intellectual) was Item 17 Newspapers, which suggested some kind of reading material was available in the homes of most participants growing up (e.g. newspapers, comics, and magazines). The most endorsed items on Factor 3 (Community) were Item 12 Activity, Item 13 Sport, and Item 7 Church, which suggested strong community relationships and routines as well as an emphasis on sporting games and competitions.
Reliability
Test–retest reliability (n = 37) analyses revealed an intra-class coefficient of 0.95 (95% CI 0.90–0.97) between total scores at Time 1 (M = 50.81, SD = 8.23) and Time 2 (M = 50.43, SD = 7.60). The mean interval between Time 1 and Time 2 testing was 14.11 days (SD = 6.78). Test–retest reliability for each of the three RICE factors was also excellent with intra-class correlations of 0.95 (95% CI, 0.90–0.97) for the Community factor, 0.94 (95% CI, 0.88–0.97) for the Intellectual factor, and 0.97 (95% CI 0.93–0.98) for the Traditional factor.
Inter-rater reliability was excellent, as shown by intra-class correlations for items included in the Total (0.99, CI 95% 0.997–0.999), Traditional factor (0.096, CI 95% .990–998), Community factor (0.998, CI 95% 0.996–0.999), and Intellectual factor scores (ICC=1.0).
Scores were not affected by the mode of administration (Interview or Self-Administration) according to t-tests showing the mean score differences were not statistically significant for Total Score and three factor scores. (Table 2)
Inter-method reliability for RICE total and factor scores

N = 38.
Convergent validity
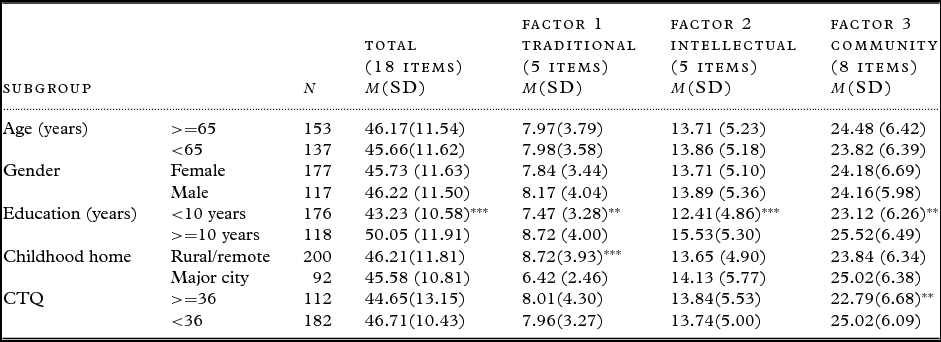
Total RICE scores were positively associated with years of education (r = 0.32, p<0.001), with Pearson's correlations of 0.19 (p<0.001) for the Traditional factor, 0.22 (p<0.001) for the Community factor, and 0.29 (p<0.001) for the Intellectual factor. Table 3 shows the results of RICE scale scores for subgroup comparisons by age (median cut-off: 65 years), sex, childhood residence (major city vs. regional, rural or remote, formal education (median cut-off: 10 years), and CTQ scores (cut-off score: 36). The RICE was not sensitive to age or gender, however, significantly different mean scores were found on total and/or factors scores depending on years of education, childhood residence, and CTQ scores.
Convergent validity of mean RICE scores using subgroup comparisons

Note: *p < 0.05, **p < 0.01, ***p < 0.001; Education = years of formal education including tertiary; CTQ = Childhood Trauma Questionnaire (Bernstein and Fink, Reference Bernstein and Fink1997).
Age and education median cut-offs were used to split the sample.
Discussion
The aim of the study was to assess the psychometric properties of the newly developed RICE scale with a group of older Aboriginal Australians. Factor analyses revealed an 18-item scale with three factors: (1) Traditional (engagement with traditional Aboriginal culture), (2) Intellectual (independent intellectual pursuits such as reading), and (3) Community (social and community participation). The RICE Scale has good internal consistency (Cronbach's α 0.79), and excellent test–retest reliability (ICC= 0.95, 95% CI 0.90–0.97) and inter-rater reliability (0.99, CI 95% 0.997–0.999). No significant differences were found between self-administration (pen and paper) or researcher administration (interview) results, indicating inter-method reliability. Higher scores on the RICE scale were related to more years of formal education, rural/remote childhood residence (Traditional factor), and lower childhood trauma scores (Community factor), indicating convergence with other measures of childhood environment. There were no sex or age differences for RICE total or factor scores, suggesting the scale is similarly valid and appropriate for use across older Aboriginal men and women.
The RICE scale is the first scale to measure childhood enrichment experienced by older Aboriginal Australians. Its three factors provided a rich picture of the childhood activities of our cohort of older Aboriginal Australians (aged 60–92 years). The Community factor indicated a robust and physically active group of children who enjoyed organized sport and regularly attended community events such as church and Sunday school. The Intellectual factor suggested most participants lived in homes where reading material was commonly available. By contrast, participant responses to the Traditional items indicated most had few opportunities to engage with traditional Aboriginal cultural activities as children, particularly in urban (city) settings. While there are some similarities with other recently developed measures of cognitive reserve (e.g. Nucci et al., 2012), its cultural sensitivity and inclusion of a broad range of activities relevant to this population are two important advantages of the RICE scale.
The RICE scale is an easily administered scale which may, in future research studies, provide a richer understanding of the types of enrichment in childhood that are the most beneficial for reducing the risk of cognitive decline and dementia in Aboriginal Australians. It was developed with assistance from a pilot cohort of older Aboriginal people and other community members in urban and regional settings. Reports from participants indicated the scale was an enjoyable experience that provided an opportunity for older Aboriginal Australians to reminisce about the activities and experiences of childhood.
The RICE scale can be self-administered or administered by interview: one allows convenience and may reduce response bias associated with the interview situation or researcher, while the other accommodates visual impairment and lower literacy levels. Additionally, it allows freedom for participants to interpret items about traditional cultural engagement as they feel appropriate, in order to foster sensitivity to those people who felt the loss of cultural knowledge as a result of discrimination and racism. As a result, some participants defined Traditional Stories as those shared by extended family, while others defined these as Aboriginal dreamtime stories. This flexible administration is a strength of the RICE scale since it allowed for the dynamic and shifting nature of culture among Aboriginal Australians.
We are aware that the current study has limitations. First, it is likely that the responses of the older participants were affected by recall bias given the events recalled were in the distant past. This is a widespread challenge for studies of the impact of childhood environment on the health and well-being of older populations. Second, the validation was conducted with participants from five large rural, regional, and urban Aboriginal communities in NSW. As a result, it is uncertain whether these results will generalize to Aboriginal and Torres Strait Islanders communities in other parts of Australia, particularly to people in remote areas, or indeed to Indigenous populations in other countries. While our study showed the RICE scores to be associated with formal education and other childhood factors previously linked to dementia risk (i.e. childhood rural residence (Hall and Hendrie, Reference Hall and Hendrie2012) and childhood trauma (Majer et al., Reference Majer, Nater, Lin, Capuron and Reeves2010; Pesonen et al., Reference Pesonen2013)), further research is required to examine the validity of the RICE scale as a measure of cognitive reserve, and its ability to predict those at higher risk of dementia.
In conclusion, the RICE scale provides an alternative measurement of cognitive engagement in childhood as recalled by older Aboriginal Australians, in addition to conventional measures of formal education, which may be less appropriate in some minority populations (Manly and Mayeux, Reference Manly, Mayeux, Anderson, Bulato and Cohen2004; Sharp and Gatz, Reference Sharp and Gatz2011). The RICE Scale has good psychometric properties, is easy to administer and, in future, may enhance understanding of cognitive reserve in Aboriginal Australians and supplement existing knowledge about the importance of cognitive engagement in early life.
Conflict of interest
None.
Description of authors’ roles
C. Minogue designed the study, collected and analyzed the data, and wrote the paper. K. Delbaere assisted with design, analysis of the data, and writing the paper. K. Radford assisted with design, data analysis, and writing the paper. W-S. Forder contributed to design and collecting the data. T. Broe contributed design and writing the paper. S. Lah assisted with design, analyzing the data, and writing the paper.
The RICE (Retrospective Indigenous Childhood Enrichment) Scale