I. INTRODUCTION
Poly(l-lactic acid) (PLLA) is one of the most studied biopolymers nowadays. Due to its good mechanical properties, it is a good alternative to many petroleum-derived commodity plastics.Reference Abe, Kikkawa, Inoue and Doi1–Reference Baratian, Hall, Lin, Xu and Runt4 Differential scanning calorimetry (DSC) has been largely used to characterize the glass transition, melting, and crystallization of PLLA.Reference Huang, Lisowski, Runt, Hall, Ken, Buehler and Lin5, Reference Loomis, Murdoch and Gardner6 Temperature-modulated DSC (TMDSC) has also been used for this purpose.Reference Zuza, Ugartemendia, López, Meaurio, Lejardi and Sarasua7, Reference Pyda and Wunderlich8 TMDSC has proved to be a very useful technique to understand thermal events where standard DSC fails to separate some overlapping processes.Reference Wunderlich9 To obtain the right conclusions, it is very important to take into account the thermal history imposed to the sample along any DSC experiment. That is also true and even more important in TMDSC where, apart from the underlying linear heating, there is also an amplitude and a period of oscillation. Proper combination of those factors is crucial to get a good insight. On the contrary, a bad combination of the heating–cooling parameters may lead to wrong conclusions. For example, in a melting study, combinations of underlying heating rate, period, and modulation amplitude leading to cyclic heating–cooling steps should be avoided to prevent multiple melting–crystallization processes. On the other hand, there is a possibility to choose combinations of those parameters so that there is an instant in each cycle where the heating rate is zero, allowing to obtain kinetic information. Those experimental conditions will be referred here as “heat only.”
In this work, thermal transitions of PLLA are studied by TMDSC. Different results will be obtained using different modulation conditions. It will be shown how a correct selection of the experimental conditions will provide a very useful information. Particularly, the heat capacity change at the cold crystallization will be accurately measured and the double melting peak of PLLA will be explained through the existence of three crystalline structures.
II. EXPERIMENTAL
A PLLA with M n value of 70,000 and M w value of 116,000, determined by gel permeation chromatography, will be used in this work. It was manufactured by Cargill Dow LLC Chemical Co. (Minnetonka, MN).
The tests were performed in a TA Instruments Q-2000 TMDSC (New Castle, DE), calibrated according to manufacturer procedures. Sapphire was used for heat capacity calibration. Depending on the processes under study, the following experimental setups were used:
For the study of the glass transition with enthalpy relaxation: heating rate of 2 °C/min, period of 60 s, and amplitude of 0.32 °C
For the cold crystallization: heating rate of 0.5 °C/min, period of 120 s, and amplitude of 0.16 °C
For the study of the double melting peak: heating rate of 1 °C/min, period of 120 s, and amplitude of 0.32 °C in heat only mode
Some additional experiments were done. Their experimental conditions are indicated along the text.
III. RESULTS AND DISCUSSION
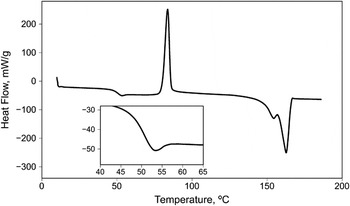
Figure 1 shows the heat-flow curve obtained in a 10 °C/min heating standard DSC from a PLLA sample, which underwent a 40 °C/min cooling from the melt. It is well known that PLLA is a thermoplastic with a slow crystallization kinetics and, thus, in this case the original crystallinity is expected to be not more than 10%. Typical thermal events of PLLA can be observed on the heat-flow curve. The inset shows how the glass transition is overlapping with enthalpy relaxation in the 40–60 °C range. The enthalpy relaxation is due to the different cooling and heating rates to which the sample was subjected and to the period of time where the sample was below the glass transition temperature (T g), evolving to a lower energy content state. The cold crystallization results from the fact that the sample was not allowed to completely crystallize during the relatively fast cooling preceding the heating experiment. The double melting peak was largely reported and will be discussed later.
Heat-flow curve obtained in a 10 °C/min heating standard differential scanning calorimetry from a poly(l-lactic acid) sample, which underwent a 40 °C/min cooling from the melt.

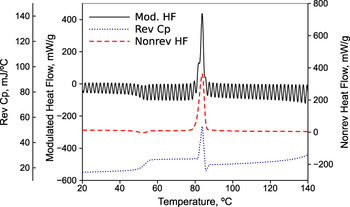
A first TMDSC trial is done with the aim to separate the glass transition from enthalpy relaxation, as well as to find out how the heat capacity changes along the cold crystallization process. That change of heat capacity is expected to be linked to the crystallization since the heat capacity of crystals is lower than the heat capacity of the corresponding glasses. To meet the heat only requirements, the following conditions were chosen for this experiment: heating rate of 2 °C/min, period of 60 s, and amplitude of 0.32 °C. The results are shown in Fig. 2.
Reversing Cp, nonreversing heat flow and, modulated heat flow obtained with heating rate of 2 °C/min, period of 60 s, and amplitude of 0.32 °C.

A perfect separation of the glass transition and the enthalpy relaxation can be observed in Fig. 2. The glass transition is visible as a step change on the reversing heat capacity (Cp rev) signal while the enthalpy relaxation appears on the nonreversing heat-flow curve. Nevertheless, the Cp rev curve shows unexpectedly peaks at the cold crystallization that should not be taken as a realistic expression of the material heat capacity. Looking at the modulated heat-flow curve, one can realize that there is not enough number of cycles along the transition (minimum is four) to perform a good separation according to the TMDSC method. Thus, the number of cycles is increased by lowering the heating rate to 0.5 °C, keeping the same period of 120 s and an amplitude of 0.16 °C. The heat only conditions are also satisfied.
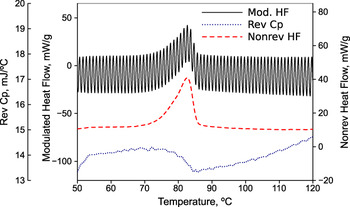
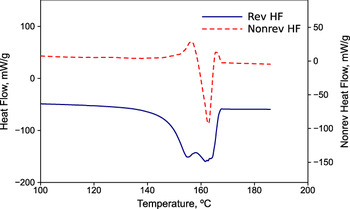
It can be observed in Fig. 3 how, with these new experimental conditions, the change of heat capacity is tracked along the cold crystallization process. A decrease of Cp rev is observed along the crystallization, which is related to a decrease of molecular movement. Then, after the cold crystallization, an increase of Cp rev is observed. This increase seems to be accelerated in the range above 100 °C suggesting the beginning of the forthcoming melting process. A new experiment was performed to investigate the melting process. In this case, the range under study was increased up to 190 °C, and heating rate and period conditions were chosen in accordance to other reports: heating rate of 2 °C/min and period of 60 s. An amplitude of 0.32 °C was chosen to meet the heat only requirements. The results are shown in Fig. 4. The two classical melting peaks of this material can be observed on the reversing heat-flow curve.Reference Yasuniwa, Tsubakihara, Ohoshita and Tokudome10–Reference Gunaratne and Shanks15 The nonreversing heat-flow curve shows two exotherms with a bigger endotherm in the middle, as reported in other works.Reference Orozco, Brostow, Chonkaew and López16 This is an unexpected result and deserves further analysis. Crystallization is a kinetic process with characteristic time higher than tenths of seconds. Conceptually, since the observation time used here is only 60 s, crystallization should be π/2 degrees out of phase with respect to the heating rate. Thus, crystallization should appear as exotherm, but not as endotherm, on the nonreversing curve. On the other hand, the characteristic time of melting is usually much lower and may be about tenths of seconds. With observation time of 60 s, a part of the melting is observed on the reversing signal and the other part on the nonreversing one. This is what happens in this case and in other cases where the period was not specified.Reference Orozco, Brostow, Chonkaew and López16 If we want to send all the melting to the reversing signal, the observation time has to be increased. Thus, the period was increased to 120 s. The heating rate was lowered to 1 °C/min to have a sufficient number of cycles along the transition. An amplitude of 0.32 °C was kept since it allows for heat only conditions. Figure 5 shows the results obtained with these new conditions. The double melting peak is observed on the reversing heat-flow curve. But now the nonreversing signal shows only two endotherms, whose peaks appear approximately at the same temperature than the corresponding ones on the reversing signal.
Reversing Cp, nonreversing heat flow, and modulated heat flow obtained with heating rate of 0.5 °C/min, period of 120 s, and amplitude of 0.16 °C.

Reversing heat flow and nonreversing heat flow obtained with a 2 °C/min heating rate, a period of 60 s and, an amplitude of 0.32 °C.

Reversing heat flow and nonreversing heat flow obtained with a 1 °C/min heating rate, a period of 120 s, and an amplitude of 0.32 °C.

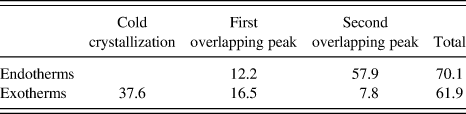
Two theories were proposed for the double melting peak: the lamellar thickness modelReference Cebe and Hong17, Reference Bassett, Olley and Raheil18 and the melting–recrystallization model.Reference Lee, Porter and Lin19, Reference Jonas, Russell and Yoon20 The double lamellar thickness model considers that the double endothermic behavior is due to the existence of two kinds of crystal lamellae with different thicknesses. So, the melting of the thinner lamellae would be related to the lower temperature endotherm, and the melting of the thicker lamellae to the higher temperature endotherm. On the other side, the melting–recrystallization model proposes that the lower temperature endotherm is produced by the melting of the lamellae initially present. The partially melted amorphous material would recrystallize into a more perfect lamellae, which would melt at higher temperatures. Nevertheless, in view of Fig. 5, obtained under suitable modulation conditions, a different explanation can be given. The existence of two exotherms at practically the same temperatures than the endotherms is an indication of two simultaneous melting–crystallization processes. As the cold crystallized material melts, the molecules arrange in more perfect lamellae, which again melt and recrystallize in an even more perfect lamellae. This model implies the existence of three crystalline forms: the one corresponding to the cold crystallization and the two corresponding to the nonreversing exotherms. The melting of those three crystalline structures is reflected in only two strongly overlapping peaks as their melting processes are strongly overlapped. To estimate the heat involved in each of the overlapping melting and crystallization peaks, a convolution method based on a previous work was applied.Reference Artiaga, Lopez-Beceiro, Tarrio-Saavedra, Gracia-Fernandez, Naya and Mier21, Reference López-Beceiro, Gracia-Fernández, Gómez-Barreiro, Castro-García, Sánchez-Andújar and Artiaga22 Accordingly, each peak is assumed as a time derivative of a generalized logistic function, and the baseline changes proportionally to the conversion at each point. The estimated peaks are shown in Fig. 5. Table I shows the measured and estimated enthalpy values of the observed crystallization and melting processes.
Measured and estimated enthalpy values (in J/g) of the observed crystallization and melting processes
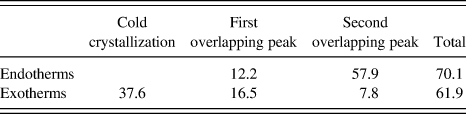
It can be observed that the total heat of melting is higher than the sum of all the observed heats of crystallization. The difference is about 11.8% with respect to the total melting area. This means that the sample developed an important degree of crystallization during the 40 °C/min cooling ramp, which preceded the measuring heating ramp. In view of these results, it is not possible to establish a relation between the amounts of sample involved in each of the single processes. Nevertheless, considering the peak areas, it is clear that the first melting peak represents a different fraction of the sample than the one involved in the first overlapping crystallization process and that the second endotherm corresponds to most of the crystalline structures, including those formed in both overlapping exotherms.
IV. CONCLUSIONS
In TMDSC, modulation conditions should be adapted to each individual process under study, especially when complex processes are involved. In the PLLA case, optimal conditions are different for the study of the glass transition, cold crystallization, and the double melting peak. It is particularly important to set up periods larger than the characteristic time of the processes under study. At the same time, a minimum of four cycles per transition can be accomplished by adjusting the average heating rate. This was not always done in reported works and explains extraneous results such as nonreversing heat-flow curves with two exotherms and a bigger endotherm in the middle.
The use of adequate experimental conditions allowed to identify three different crystallization processes in the case of PLLA: the classical cold crystallization and two processes associated to the nonreversing exotherms.
A new model is proposed for the crystallization–melting processes of PLLA, which explains previous results as well as the findings of this work.
ACKNOWLEDGMENTS
This work was partially funded by the Spanish Ministerio de Educacion y Ciencia MTM2008-00166 and MAT2010-21342-C02-01.