Democratic accountability is premised on the concept of responsibility. According to principal–agent models of representation, elected officials are granted power to carry out policies to enhance public welfare. Citizens, in turn, use their vote to sanction policy makers who do not perform to standards. This relationship rests on an assumption that voters know who is responsible for policy outcomes. In many of the world’s newer democracies, however, this assumption would appear to rest on shaky ground. Vulnerability to external shocks and a complex set of stakeholders in the national economy – the International Monetary Fund (IMF), World Trade Organization (WTO), credit rating agencies, developed-world trading partners, and so on – may confound the voter’s ability to evaluate the efficacy of government actions. Whether and how voters attribute policy responsibility in complex, information-sparse environments is not well understood. In this article, we present the first analysis of how voters in developing democracies incorporate information about the influence of the wider political-economic environment when assigning responsibility for economic performance.
Analyses of public opinion in Britain and the United States have shown that, rather than simple retrospective assignment of reward or blame to the government,Footnote 1 voters distribute responsibility across a range of actors, including businesses, workers and markets.Footnote 2 Work on economic voting in the developing world, for its part, generally overlooks questions of dispersed responsibility.Footnote 3 While some researchers highlight the extent to which voters distribute responsibility to elites both in and out of government,Footnote 4 and do so in ways which diverge from simple reward–punishment processes,Footnote 5 no work examines the possibility that voters in emerging market economies might systematically sanction non-elected actors. This possibility, however, is very real and of great consequence for the consolidation of electoral democracy. When voters grant responsibility to non-elected actors, they lighten the burden placed on the government’s policy choices and execution. This can provide a window of opportunity for politicians, enabling them to deflect responsibility for underperformance by highlighting the effect of international shocks. In this way, politicians can shirk responsibility, undermining democratic accountability.
When it comes to the assignment of responsibility, we conceive of the voter’s task as one of extracting signals about the sources of economic outcomes under complexity. Complexity stems from an environment in which government decisions affect economic outcomes alongside decisions made by a host of other actors, public and private, domestic and foreign. Based on the relative strength of signals from these many actors, voters then assess ‘who’s responsible’. To do so, the voter must steer among these many potential responsibility targets – the real effects of which are not known with certainty. Reducing uncertainty is thus essential. Our argument is that citizens in the developing world seek to reduce uncertainty in the assignment of blame and reward by drawing on what they know about their country’s position in the international system.
The argument is tested using public opinion data from seventeen middle-income and low-income countries. Study results confirm our expectations that in the developing world attributions of responsibility are not idiosyncratic or due solely to individual dispositions, but can be explained in terms of international factors. Analyses of public opinion data show that citizens distribute attributions for policy outcomes broadly among government policy makers, domestic civil society, and forces in the global economy. Research findings thus establish how international structures, domestic political actors and individual preferences jointly determine voter assignment of policy responsibility in developing economies.
The next section presents a theory of the distribution of responsibility in emerging democracies which emphasizes the diversity of potential ‘targets’ of responsibility. Drawing on work on the political economy of development, particularly on a renewed interest in dependency relations, we then propose a set of hypotheses about how individuals distribute responsibility along two dimensions: public–private and domestic–international. We next introduce our data and measures. Research claims are tested using multi-level statistical analyses combining individual and international structural variables. Given the incentives to avoid blame, we also provide a test of whether political elites amplify or moderate signals sent from international forces as a means to shirk responsibility. We conclude with a discussion of the study’s implications for the consolidation of new democracies.
International structures and attributions of responsibility in developing countries
How do voters make sense of the many possible sources of economic outcomes necessary to assign responsibility? The most sophisticated approach to this question models the influence of the government’s competence on voter utility when the voter is faced with extracting information under conditions of uncertainty.Footnote 6 Alesina and Rosenthal, for instance, conceive of the voter’s tendency to assign responsibility of performance outcomes to politicians – as opposed to non-elected actors – as a random shock equal to the deviation of observed growth from the expected ‘natural’ growth rate.Footnote 7 This shock, in turn, can be partitioned into two components. The first component pertains to the level of administrative competence accorded to government policy makers. This is the competency shock. The second component pertains to the set of exogenous factors influencing growth independent of the government’s skill and effort. The first component is observed but the second is not. Voters must, therefore, draw on what they have learned in the past about variations in policy competence attributable to government policy makers and to non-governmental actors in order to assign responsibility for the current state of affairs rationally.
To illustrate, suppose that observed growth is less than the natural rate, a common situation among the cases we analyse below. In this case, a competency model predicts that the likelihood that the government will be blamed for a poor economy depends on the volatility of the government’s competency shock compared to that of an exogenous shock. If variations in the competency shock are large, then the rational voter should assign responsibility for an underperforming economy to the sitting government. If, in contrast, the variance on the competency shock is low relative to the exogenous shock, then the voter has good reason not to blame the government for the country’s economic problems.
Duch and Stevenson have recently developed a competency model along these lines to theorize about how incumbent incentives and exogenous forces affect links between economic perceptions and vote choice.Footnote 8 They modify Alesina and Rosenthal’s formulation by distinguishing between two types of decision makers. The first, ‘electorally dependent decision makers’, refers to elected officials who make up the national government. The second, ‘non-electorally dependent decision makers’, refers to everyone else whose decisions might influence the economy, ‘including individuals, firms, interest groups, nonelectorally dependent (entrenched) bureaucrats, foreign leaders, the WTO, and many more’.Footnote 9 By making this distinction, competency shocks are assigned to the decisions of the electorally dependent actors, and exogenous shocks are assigned to the cumulative decisions of everyone else. Duch and Stevenson’s model is attractive in its emphasis on how voters distinguish the signals they receive from governmental and non-governmental actors. In doing so, it generalizes intuitions about how electoral outcomes are shaped by the arrangement of domestic political institutions, the dispersion of policy control, the influence of the world economy, and many other factors that vary across countries and over time.Footnote 10
Our theory is informed by these studies. First, like Alesina and Rosenthal, we believe a consideration of government administrative competency is essential for developing expectations about responsibility attributions. And secondly, like Duch and Stevenson, we maintain that assigning responsibility requires voters to separate economically consequential decision makers who are dependent on voters from those who are not. The literature on competency signals and rational voters, however, makes little mention of the distribution of responsibility beyond tendencies to reward or blame political incumbents.Footnote 11 But if voters do in fact distribute responsibility, rather than just evaluate outcomes and assign or not assign them to incumbents and other political parties, then we must add a third consideration: specifically, we must consider the range of responsibility ‘targets’ – that is, governmental and other actors whom voters may identify as responsible for observed economic performance.
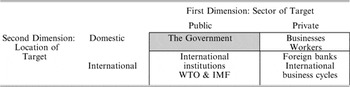
Targets of responsibility may be classified on two dimensions (see Table 1). The first is a public–private dimension that distinguishes targets according to sector. This dimension characterizes distributions of reward and blame among government and non-governmental actors, whereby the latter include businesses, workers and other actors in domestic civil society. This distinction appears in the public opinion and political psychology literatures in political science. Works by Gomez and Wilson and by Rudolph, for example, show that many Americans assign responsibility to these actors, even though they do not directly decide on US economic policy.Footnote 12 The second dimension separates responsibility targets according to the location of origin. Domestic targets include one’s national government as well as domestic civil society, thereby cutting across the public–private divide. International targets include a host of actors which originate, at least in part, from outside the polity. While this dimension has been mentioned elsewhere,Footnote 13 no previous study has empirically addressed – as we do below – the question of whether voters shift attributions onto international actors. And, as discussed below, lessons from the political economy of development literature give us good reason to focus explicitly on the impact of extra-national forces. Together, these two dimensions provide a more exhaustive assessment of the range of possible targets of responsibility than was previously considered.
Targets of Responsibility for the Economy in Developing Democracies

Note: The shaded area represents target of responsibility as assumed by standard models of electoral accountability.
What matters for distributing responsibility? the role of international structures in developing economies
With such a broad menu of possible targets, what affects the voter’s choice to identify different types of actors responsible for policy outcomes? As regards the developing world, lessons from the political economy of globalization and from structural theories of (under) development offer insight into this question. Beginning with the dependency school in the 1970s, many scholars have examined the uneven effects of the global capitalist economy on developing polities.Footnote 14 With increased liberalization during the 1990s, scholars called attention to how globalization reduced the degrees of freedom of policy makers in these countries.Footnote 15 The effects of international forces on economic (under) development remain prominent in current research. Kaufman and Segura-Ubiergo, for example, demonstrate that trade liberalization has a distinct negative impact on welfare state arrangements in Latin America.Footnote 16 Wibbels shows how income shocks stemming from international business cycles have a greater effect on lesser developed countries (LDC) than in OECD economies.Footnote 17 And Archer et al. reveal how credit rating agencies can hinder or facilitate developing countries’ access to capital.Footnote 18
While not addressing mass politics, work on the political economy of development provides a foundation for our argument. Insights from these studies can be extended to inform expectations about how structural factors reach through governments to influence mass politics in general and attributions of responsibility in particular. Specifically, past research has emphasized that increased exposure to world markets, experience with international lending institutions and incurring foreign debt have significant impact on developing economies.Footnote 19 We posit that these three factors are also salient to the voter.
As is well known, exposure to international markets in the developing world increased dramatically with the reforms of the 1980s and 1990s. Triggered by failed import-substitution industrialization (ISI) and fostered by international organizations, countries that previously had some of the world’s highest tariff rates have liberalized commerce. Drawing from the globalization literature, we expect exposure to trade to explain variation in citizens’ evaluation of how the economy works.Footnote 20 Just as opening up to international competition decreases the influence of national government decisions on observed growth, so too should openness affect responsibility attributions. The more the economy is exposed to international markets, the more likely voters will perceive economic performance to result from non-governmental agents. Expressed in terms of competency signals, the number and size of actors shaping variations in growth attributable to exogenous shocks should grow in size while the number of public sector actors affecting economic outcomes should decline. This should be so whether voters directly observe the visible impact of trade as consumers, or whether such beliefs are deliberately fostered by domestic elites seeking to shirk responsibility.Footnote 21
Interactions with international lenders should also matter for perceptions of political control and, by extension, the locus of responsibility. Here, the International Monetary Fund has played a prominent role. Since 1982, the IMF has wielded considerable influence due to its status as the chief international lender of last resort.Footnote 22 Reform packages and structural adjustment programmes frequently come with high social and political costs for national politicians.Footnote 23 And the IMF, together with the World Bank, is unique among financial institutions in that it can require borrowers to adopt certain reforms in exchange for financial aid. IMF conditionality typically mandates privatization, deregulation and austerity measures.Footnote 24 Creditors, both public and private, take their cue from the IMF’s assessment of a country, often offering new lines of credit only if the state in question has adhered to Fund-recommended reforms. Thus, even though IMF loans make up a small percentage of the total of foreign debt in the developing world relative to private, bilateral and other multilateral sources of financing, the Fund has amassed a reputation as fiscal gatekeeper for developing economies.Footnote 25 Accordingly, the IMF’s sustained presence in a country should affect how voters distribute responsibility across the two dimensions. Changes in economic performance will be more likely to be attributed to extra-national actors – or internationally-originating targets – in countries with an experience of being subjected to IMF conditionality.
The third factor we expect to shape the distribution of responsibility is foreign debt. Developing countries, it is well known, are highly vulnerable to international creditors,Footnote 26 and while the twenty largest debtor countries in the world are members of the OECD, historically only developing economies have been at risk of facing destabilizing crises triggered by high levels of external debt.Footnote 27 Differences in debt sustainability – i.e., the degree to which future payments on loans are met without incurring further debt – explain the different treatment financial agents grant to industrial and emerging markets. Thus, even though external borrowing is commonly used as a ‘mechanism for coping with fiscal crisis in countries around the world’, such practice can become dangerously reckless in developing economies.Footnote 28 Given its salience, citizens from countries with high levels of foreign debt have reason to attribute economic performance to international targets. Citizens in heavily indebted countries should be more likely to hold actors such as financial institutions and the global economy responsible for national economic performance while those in countries free from high levels of external debt should be more willing to attribute variations in economic performance to domestic actors, including government policy makers and civil society.
Our expectations about international structural factors and the distribution of responsibility can be summarized with reference to Table 1. All else being equal, we expect that citizens will be more likely to attribute responsibility for the economy to private rather than to public actors (first dimension) and to international rather than domestic actors (second dimension) when residing in countries with high levels of exposure to international trade (Hypothesis 1), with sustained experiences with the IMF (Hypothesis 2), and with high levels of external debt (Hypothesis 3).
Data and measures
Data to test these hypotheses are from Latin American experience during the first years of the twenty-first century. Though limiting the analyses to Latin America arguably constrains our ability to generalize to the developing world overall, this choice has several merits.Footnote 29 First, the problems of economic management during this time in Latin America were particularly acute. Annual growth rates for the region between 2000 and 2003 averaged less than 1.2 per cent of gross domestic product (GDP), considerably lower than any other world region.Footnote 30 Public assessments were equally dire: in region-wide public opinion surveys conducted in 2002 and 2003, less than 7 per cent overall classified the economic situation of their country as ‘good’ or ‘very good’, while nearly 60 per cent said it was either ‘bad’ or ‘very bad’ (2002 and 2003 Latinobarómetro Survey). Hence, the economy figured as highly salient among voters. Secondly, much of this discontent may rest with turbulent experiences in the world markets and international institutions, ranging from the era of ISI to the ‘Washington Consensus’ model and, more recently, a movement back towards more state-led attempts at economic management. Thirdly, despite broad trends characterizing the region, variation among structural factors makes Latin America an ideal setting for testing our argument.Footnote 31
Data on individual responsibility assignments are from public opinion surveys conducted in 2002 and 2003 by Latinobarómetro.Footnote 32 The surveys provide information on respondents in seventeen low-income and middle-income countries: Argentina, Bolivia, Brazil, Chile, Colombia, Costa Rica, Ecuador, El Salvador, Guatemala, Honduras, Mexico, Nicaragua, Panama, Paraguay, Peru, Uruguay and Venezuela. For our main variable of interest, attributions of responsibility, we use the following item: ‘Given the economic problems in [country], from the following list of institutions and actors, which do you think are responsible?’Footnote 33 Respondents were then read a list of nine targets:
(1) Government’s economic policy
(2) Lack of entrepreneurial initiative
(3) Lack of individual initiative
(4) Lack of domestically produced goods
(5) The banks
(6) International Monetary Fund
(7) World Trade Organization
(8) Globalization
(9) No one is directly responsible.
This item is well suited to the task at hand. First, it provides a larger set of response options than is found in previous analyses of attributions of responsibility. Secondly, it provides for more realistic results – especially given our focus on the distribution of attributions – since respondents were allowed to select as many of the targets as they liked. There seems little doubt that limiting responses to just one or two would result in biased findings: while 43 per cent of those surveyed identified only one target, 25 per cent said two, 15 per cent said three, and 6 per cent said four or more.Footnote 34 Most importantly, these response categories match the two dimensions of responsibility targets. ‘Government’s economic policy’ falls in the upper left-hand quadrant of Table 1; ‘lack of entrepreneurial initiative’, ‘lack of individual initiative’ and ‘lack of domestically produced goods’ are classified as domestic and private (upper right-hand cell); the IMF and the WTO are international and (indirectly) public, and ‘the banks’ and the amorphous ‘globalization’ are international and private.
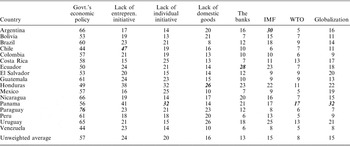
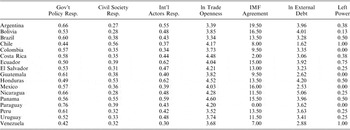
Table 2 reports the percentage of respondents overall who identified each of these entities as responsible. Results make it clear that Latin Americans distribute responsibility across many actors. While many blame the government, large proportions – half or more in Venezuela, Chile, Honduras and Ecuador – do not cite government economic policy as even partially responsible for their countries’ economic problems.
Targets of Responsibility for Economic Problems

Source: 2002 and 2003 Latinobarómetro Surveys.
Notes: Cells report country mean responses to the question: ‘Given the economic problems in [country], from the following list of institutions and actors, which do you think are responsible?’ Figures in bold italic indicate countries where the greatest percentage of respondents selected the category. The table excludes respondents who answered ‘No one is responsible’, ‘Other’, ‘Don’t know’, or who did not respond (10.5 per cent overall).
These outcomes fit well with our expectations as regards developments in Latin American countries. Argentinian respondents, for example, are the most likely to identify the IMF as being responsible for national economic problems. Considering that the surveys were in the field shortly after news of an IMF-brokered ‘mega’ loan and the ensuing financial collapse of the country, it comes as little surprise that many would blame the IMF when the high profile loan failed to stave off the crisis that immediately preceded it. In contrast, Chile during this period had a relatively stable economy, low foreign debt levels and a consistently open trade policy since the 1970s. Not surprisingly, Chileans rank as those least likely to blame the IMF for poor economic performance and most likely to place responsibility on a lack of entrepreneurial initiative. The largest percentage of respondents blaming ‘the banks’ for their economic troubles is found in Ecuador. This also fits with what we might expect; the decision in 2000 to peg the currency to the US dollar had tumultuous results and the banking sector was a crucial actor in the process.Footnote 35
We use the eight response options to this survey item to develop three groups of dichotomously-measured targets of blame: one pertaining to the policy choices of elected officials (public-domestic), one to civil society (private-domestic), and one to extra-national actors (international, both public and private).Footnote 36 Government’s Policy Responsible is a variable coded 1 if the respondent said that the ‘government’s economic policy’ was one of the actors responsible for the economic problems in her country and 0 otherwise. Civil Society Responsible taps the respondent’s propensity to hold private sector actors responsible for the economy and is coded 1 if the respondent responds with ‘lack of entrepreneurial initiative’ ‘lack of individual initiative’ and/or ‘lack of domestically produced goods’. And International Actors Responsible equals 1 for non-governmental actors which can be ascribed to the international sphere. These response categories include ‘the banks’, the IMF, the WTO and ‘globalization’.Footnote 37 In addition to fitting with the responsibility target dimensions (Table 1), the results of exploratory data analyses support these three response groupings.Footnote 38
As per the hypotheses, structural variables of interest are measures of exposure to the world economy, experience with the IMF and incurrence of foreign debt.Footnote 39 We use a standard measure of exposure to the world economy as the natural log of imports plus exports as a percentage of GDP.Footnote 40 The role of the IMF is assessed with a measure which tallies the number of years since 1982 – the year in which the foreign debt crisis in Latin America began – that the country has been under an IMF agreement.Footnote 41 We measure external debt levels as the natural log of the country’s percentage share of GDP owed to non-resident creditors. The measure includes total debt instruments under international law plus the official debt for each country and is equal to the external market instruments plus foreign banks loans plus official debt. The source is the Inter-American Development Bank’s CLYPS dataset on public debt level and composition in Latin America.Footnote 42 Summary statistics are found in Appendix Table A1.
We also control for other factors, both macro and micro, that may influence the attribution of responsibility. To control for the influence of government partisanship, we include a measure of the strength of the left in the executive and legislative branches of national government of each country. Left Power takes on a value of 0.5 if the president’s ideology is left-of-centre and an additional 0.25 if the share of left-of-centre parties in the legislature (lower house if bicameral) is between 25 and 50 per cent of total seats or 0.5 if the latter lies above 50 per cent.Footnote 43 When summed, the presidential and legislative scores produce a measure taking on values 0 (unified non-left control), 0.25, 0.5 (divided government), 0.75 or 1 (unified left control). To examine the effects of the government on the economy, we include a spending variable, measured as (the natural log of) government spending divided by GDP per capita.Footnote 44 We also control for any unaccounted period effects by way of an indicator variable for 2002.Footnote 45 Finally, models include a battery of individual-level variables developed from survey items. Self-placed Ideology is equal to 1 if the political executive and the respondent are both identified on the same side of the left–right scale and 0 otherwise.Footnote 46 Our expectation is that those who share the same partisan leanings as the president ought to be less likely to blame the government for their countries’ economic problems. Other individual-level controls are education (seven-point standardized scale), socio-economic status (five-point scale, interviewer assessed), gender and age (four-category ordinal scale).Footnote 47
Analysis
We test our hypotheses by regressing the three sets of responsibility targets on contextual and individual-level predictors. The data structure nests individual respondents within country-level contextual units. Disregarding the hierarchical nature of the data could create barriers to statistical inference, including non-constant variance across contextual units and the clustering of errors within contexts. If individuals from the same country share common features on unmeasured variables, then the assumption of independence of error variance across units will be violated. Standard methods of estimation used in the study of public opinion will therefore underestimate standard errors at the contextual level – precisely the level we care about most. Therefore, we estimate models using a maximum likelihood multi-level regression model with varying intercepts and binary logit link functions. Such models allow us to model potential sources of cross-unit heterogeneity without assuming that no other forms of heterogeneity exist.Footnote 48
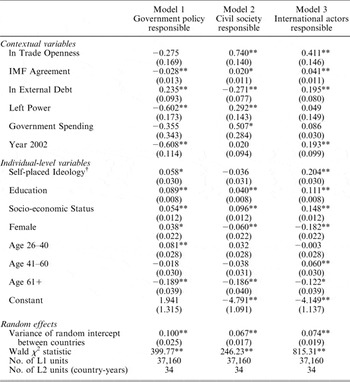
Table 3 reports the results. The dependent variable is Government Policy Responsible in Model 1, Civil Society Responsible in Model 2, and International Actors Responsible in Model 3.Footnote 49 According to referendum models of accountability, when things go badly, voters punish governments who fail to deliver acceptable economic outcomes. An examination of Table 3, however, shows that this cause–effect relationship is not automatic. Rather, structural factors affect whether the government is identified as responsible. Consider first the effects of international trade. Results show that while trade levels have no direct effect on assigning responsibility to the government (Model 1), greater exposure to world competition increases the likelihood of blaming domestic businesses, workers and producers (Model 2) as well as international institutions and markets (Model 3). Country interactions with the IMF also matter for responsibility attributions, and do so in ways we would expect: in all models, coefficients on IMF Agreement are precisely estimated, negatively signed in the Government Policy Responsible model and positively signed in models for civil society and international actors.
Attribution of Blame in Latin America

Source: 2002 and 2003 Latinobarómetro Surveys.
Notes: Cells report coefficients with standard errors in parentheses from multi-level non-linear regression models with binary logit link function. Models estimated using STATA 10.0’s xtmelogit command. **p < 0.05, *p < 0.01, two-tailed test.
†The variable equals 1 if the political executive and the respondent are both identified on the same side of the left–right scale and 0 otherwise.
With respect to Hypothesis 2, a relationship with international lenders shifts the distribution of responsibility away from the government and on to private sector and international actors. The third causal factor, external debt, appears to have a more nuanced impact on public assessments. We expect, with respect to Hypothesis 3, debt levels to increase citizen tendencies to target international actors. Furthermore, the debt burden may have the opposite effect on targeting civil society actors; that is, voters might be less likely to blame a poor economy on the poor efforts of individuals, entrepreneurs and domestic producers when the country’s economic performance is compromised by high levels of external debt. Both of these arguments are supported in the statistical results (see coefficient on External Debt in Models 3 and 2, respectively). However, the coefficient on External Debt in Model 1 is positive, suggesting that debt levels increase voter propensities to distribute responsibility to national policy makers. We return to this finding below.
In order to provide a more substantive interpretation of results, estimates from Table 3 can be expressed in terms of the probability that a given individual attributes responsibility to the government’s policy, to civil society or to international actors across particular values for the international structures of interest. Figure 1a–1c displays the expected probabilities in terms of the probability that each of the target groupings equals 1 as each of the structural contexts – Trade Openness, IMF Agreement and External Debt – ranges from low to high values.Footnote 50 Probabilities displayed are those for a hypothetical respondent having mean or modal values on all non-manipulated covariates.Footnote 51 Post-estimation uncertainty is incorporated by taking 10,000 draws from the estimated variance–covariance matrix and using the mean and standard deviations of the resulting distribution of probabilities to draw 95 per cent confidence intervals.
International structures and responsibility attributions in Latin America. Notes: Figures report expected probability that respondent attributes responsibility for the target. Expected probabilities produced by using estimates reported in Table 3, models 1–3, and iteratively manipulating variables of interest for a hypothetical respondent with mean or median values on all independent variables with the exception of the variable in question. Lines report mean expected probabilities from a post-estimation simulation that takes 10,000 draws from the estimated coefficients and variance-covariance matrix. Dashed lines report 95% confidence intervals.

Figure 1a shows how exposure to world markets matters for the attribution of responsibility. Results provide strong support for Hypothesis 1. At low levels of trade exposure – the sort experienced by Argentina (22 per cent of GDP, or e 3.09) or Brazil (27 per cent) in 2001 – there is only a one-in-three probability that the respondent would blame international actors for their country’s economic problems (see line with triangles). Under this ‘closed-economy’ scenario, government policy bears the brunt of the blame with a probability of 0.60. But as objective levels of exposure increase, responsibility attributions are redistributed and probabilities change. The probability of identifying the government as responsible is reduced and citizens become more and more likely to blame the private sector or international actors. At levels of commercial integration akin to exports plus imports totalling 60 per cent (e 4.1) or more of GDP, the probability of blaming the government’s actions is no greater than assigning blame to unelected, unaccountable actors in world markets and in civil society, as shown by overlapping 95 per cent confidence intervals. This scenario characterizes over 40 per cent of the country’s cases in the sample. All this is consistent with Hypothesis 1.
Figure 1b charts attribution probabilities to different targets as years under an agreement with the IMF increases from 0 (as was the case for Paraguay) to 18 (approaching that of Argentina). For a country with no history of formal involvement with the Fund, the hypothetical respondent attributes responsibility to government policy with a probability of 0.61 and to civil society or international actors both with about 0.30.Footnote 52 The distribution of responsibility among the three target groups changes, however, as experience with the IMF increases. For example, over the range of values for IMF Agreement, the probability of attributing responsibility to government policies declines 14 percentage points (from 0.61 probability when IMF Agreement = 0 to 0.47 when it equals 18). At the same time, the probability of assigning blame to the world economy increases by 20 percentage points (from 0.25 to 0.45).Footnote 53 Hypothesis 2 thus receives solid support.
Figure 1c displays the distribution of responsibility given the different levels of External Debt. A greater debt burden increases the probability that voters will assign blame for national economic problems to the IMF, WTO and global market forces, ranging from about a one-third probability at low debt levels (e.g., Chile) to one-half at high levels (such as for Nicaragua). As debt levels increase, the probability that the respondent attributes responsibility for economic problems to the government, if anything, increases. This supports a modified version of Hypothesis 3: voters are more likely to attribute responsibility for the economy to international actors in countries with high levels of external debt; however, national politicians appear not to benefit from this reallocation of blame. Rather, the attribution of responsibility shifts away from private sector actors in countries incurring high levels of foreign debt. These results confirm our expectations, informed by competency models of voter utility and by the political economy of development, about the effect of international structures on the attribution of responsibility in developing economies.Footnote 54 Voters receive signals from the global economy and are sufficiently aware of their government’s (lack) of political control as well as of their country’s ties to international structures so as to reallocate blame (and credit) accordingly. The effect of this awareness by Latin American citizens is twofold: first, it shapes who and what gets blamed for (poor) economic outcomes; secondly, it determines how attribution is distributed between actors along the two dimensions of responsibility. Our results imply that voters in Latin America’s developing democratic systems do not, in standard principal–agent models of accountability, uniformly assign responsibility for the economy to elected officials. Rather, blame is distributed between several actors in ways consistent with insights from the political economy of development. This finding makes an important contribution to what we know about mass politics in emerging democracies.
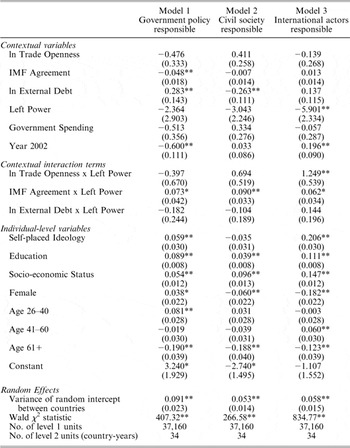
These analyses can be extended, however, to learn more about the mechanisms behind the redistribution of responsibility assignments. Our focus has been on how mass publics make use of international structures to distribute blame. Political elites, however, may well condition whether and how voters distribute blame. Indeed, results reported in Table 3 indicate that elite partisanship matters: the coefficient on Left Power is negative and statistically significant in Model 1 and positive (and again significant) in Model 2, implying that when the left is in office citizens are less likely to blame government and more likely to identify the private sector as responsible for the economic performance. Our chief interest, however, is in the consequences of international structures. To what extent can political elites shape the perceived effects of international structures, and to what extent can they use this influence to their benefit?
Our expectation is that elite propensities to tout the constraints of private sector and international actors depend on partisanship. Specifically, after a decade of economic liberalization implemented mostly by right-leaning and centrist politicians, the political left in Latin American has frequently blamed their countries’ economic problems on ties to the world economy. While few have fully reversed the market reforms implemented in the 1990s, ‘new left’ leaders characteristically have espoused anti-globalization rhetoric when seeking culprits for the economic crises that afflicted the region in the early 2000s. Historically, the Latin American left denounced the 1980s foreign debt as illegitimate in that it had been accrued mostly under right-wing military governments. And the new left, growing in strength at the beginning of the 2000s,Footnote 55 has frequently clashed with the IMF due to the latter’s conditionality rule, under which loans are dispersed only if austerity programmes are adopted.Footnote 56 Do messages from left-of-centre politicians amplify the connections voters draw between private sector actors or international forces and responsibility for national economic conditions?
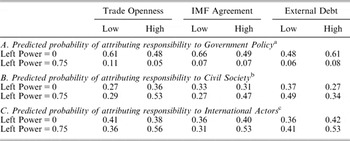
To investigate this question, we re-estimate the models above but specify the effects of Trade Openness, IMF Agreement and External Debt to be conditional on the political strength of the left (Left Power). Table 4 reports model estimates. A comparison with the models in Table 3 reveals several differences. To interpret the conditioning effect of Left Power on international structures in the context of the non-linear model more precisely, we present results in terms of predicted probabilities. Table 5 reports the probability that our hypothetical respondent attributes blame to government policy, to civil society and to international actors given the varying levels of Left Power in combination with different levels of exposure to trade, the IMF and external debt. For illustrative purposes, we set Left Power at 0 (implying that the left holds less than 25 per cent of the seats in the lower house and does not hold the presidency) and at 0.75 (implying that the left controls the presidency and at least 25 per cent of the legislative seats).Footnote 57 We set each of the three structural variables to their 10th and 90th in-sample values to reflect ‘low’ and ‘high’ levels.
Attribution of Blame in Latin America Conditioned on Left Power

Source: 2002 and 2003 Latinobarómetro Surveys.
Notes: Cells report coefficients with standard errors in parentheses from multi-level non-linear regression models with binary logit link function. Models estimated using STATA 10.0’s xtmelogit command. **p < 0.05, *p < 0.01, two-tailed test.
Conditional Effects of Left Power on Attributions of Blame in Latin America

Source: 2002 and 2003 Latinobarómetro Surveys.
Notes: Predicted probabilities produced using estimates from Table 4. Values on independent variables held to the following values: Year 2002 = 1, Government Spending = 2.9, Self-placed Ideology = 0, Education = 4, Socio-Economic Status = 2, Female = 1, Age 26–40 = 1, Age 41–60 = 0, Age 61+ = 0. All non-manipulated contextual variables held at their sample median values. References to ‘high’ and ‘low’ for the structural variables refer to values on the variables at the 90th and 10th percentiles in the sample.
aPredicted probabilities produced using estimates from Table 4, Model 1.
bPredicted probabilities produced using estimates from Table 4, Model 2.
cPredicted probabilities produced using estimates from Table 4, Model 3.
Table 5 displays several findings that highlight the influence of elite cues. Regarding government policy, the top third of the table shows that regardless of the international structural context, citizen propensities to blame government policy for economic problems are reduced when the left is in power (compare rows Left Power = 0 and Left Power = 0.75). Looking at results for External Debt, we see that this reductive effect of the left is magnified when the country has incurred a high amount of foreign debt. This result is noteworthy in that it clarifies what appeared in Table 3 as anomalous: incurring debt increases the probability of blaming the government, but only for non-left governments. The strength of the left also affects the probability of holding private sector actors responsible for the economy. When the left is strong, attributing economic problems to the (in)action of entrepreneurs and individuals is more likely to be influenced by trade openness and history with the IMF and less likely to be affected by incurring foreign debt. The strongest effect of left-party strength, however, is that of tendencies to blame international actors. The bottom third of Table 5 shows that left-party strength increases the effects of ties to the IMF and, especially, of international trade. Specifically, the model predicts that if the country’s exposure to trade is equal to 90 per cent of GDP (similar to that of Costa Rica at the time) and if the left controls national political debate (i.e.: the presidency and at least a quarter of the legislature are controlled by left parties), then the hypothetical citizen will attribute responsibility to international actors with a probability of 0.56.Footnote 58 The magnitude of these effects foretells a strong role for government partisanship in cueing the signals voters use to help assess ‘who’s responsible’. More generally, results offer insight into the mechanisms linking macro structures to individual attributions of responsibility by showing that political elites can skilfully use blame avoidance strategies to maintain their hold on power.Footnote 59
Conclusion: the attribution of responsibility and avoidance of blame in new democracies
How do citizens in the developing world distribute policy responsibility among what appears to be an ever-increasing set of actors? Previous research has focused on individual attributes to explain variation in the target of responsibility. This focus is far too narrow. We extend scholars’ growing interest in how macro-structures affect individual behaviour by showing that international context, and not just domestic institutions, matters for mass politics.Footnote 60 Combining lessons from the globalization and dependency literatures in international political economy with competency signalling models of voter utility highlights the importance of extra-national factors for popular assessments of how economics influences politics. Judgements about responsibility in developing countries are more dispersed, involve more actors, and – we believe – carry larger implications for democracy than in relatively stable, established systems like Britain or the United States. Nonetheless, in the light of recent events – which have revealed the extent to which rich countries are also vulnerable to financial crisis – we expect our argument, with certain modification, to characterize evaluations of responsibility in advanced economies as well.
While focused on mass behaviour, this study’s results reveal important implications for the strategic behaviour of political elites in fostering (or impeding) democratic consolidation. Though our assumption has been that voters draw on perceptions of policy-maker competence in the face of extra-governmental, extra-national forces to distinguish between good and bad politicians, analyses of the conditional effect of Left Power suggests a role for elite manipulation of these signals. If, through their cues, political elites can redirect attributions of responsibility from elected policy makers to unelected entities, then a loophole in the principal–agency relationship is created. Elected officials can thus foster and exploit the perception that they have little room to manœuvre policy, and thus they do not deserve to be blamed for poor outcomes.
It may be the case that voters in new democracies, lacking prior experience in distinguishing between signals, face a learning curve mediated by further electoral experience. Over time, voters may learn to discriminate between politicians’ strategies to avoid blame and real policy constraints in determining the source of lacklustre economic performance.Footnote 61 As the democracies of Latin America endure, voters may be able to discriminate more effectively between external shocks and blame-avoidance rhetoric, thereby improving the working of democratic accountability. As political elites compete for citizens’ votes, and as strong performers improve public welfare in spite of international constraints, the utility of deflecting responsibility for future politicians may decline.
But blame-avoidance strategies also have a downside for office-seeking politicians. Attributing responsibility to non-governmental actors makes it more difficult to claim credit when things go well. When politicians carry out successful policies and are recognized for such accomplishments, overcoming foreign constraints becomes the new standard for future political performance. Ricardo Lagos’s highly praised administration in Chile (2000–06) made blame-avoidance strategies ineffective for his successor – Michelle Bachelet (2006–10), while Argentine President Carlos Menem’s (1989–99) high-profile, unconditional (and ultimately failed) alignment with international financial institutions made them viable for his post-crisis successors. Now that Argentina, Brazil and Venezuela have repaid in full their IMF loans, it seems unlikely that future administrations will be able to deflect responsibility by blaming the Fund.Footnote 62 Future work should examine the limits of blame-avoidance strategies. Given that politicians in many new democracies have been unable to complete their terms in office, more research is needed to explain why in some cases political executives succeed in deflecting blame, while at other times they fail.
Summary Statistics: Country Means on Responsibility Attributions and Structural Variables

Source: 2002 and 2003 Latinobarómetro Surveys.