Implications
An investigation of the genomic variation within a breed is an important prerequisite in maintaining the breed’s integrity and in the design of appropriate conservation plan. The aim of this work was to study the genomic structure and the population evolution of Barbaresca sheep. All the investigated parameters showed a comparatively narrow genetic base, indicating endangered status for Barbaresca. Attention should be given to conservation of this breed because of its critical conservation status. In this context, genomic information may play a crucial role in the management of small and endangered populations.
Introduction
An investigation of genomic variation within a breed is an important prerequisite to maintain its integrity and to ensure appropriate conservation. The application of recently developed genomic technology has great potential to increase our understanding of the genetic architecture of complex traits, to improve selection efficiency in domestic animals through genomic selection, and to conduct association studies (García-Gámez et al., Reference García-Gámez, Sahana, Gutiérrez-Gil and Arranz2012). The success of these applications depends on the extent of linkage disequilibrium (LD) across the genome. Linkage disequilibrium describes the non-random association of alleles at different loci and can result from processes such as migration, selection and genetic drift in finite populations (Wang, Reference Wang2005). Linkage disequilibrium is often used to determine the optimal number of markers required for fine mapping of quantitative trait loci, the evolutionary history of the populations (Hayes et al., Reference Hayes, Visscher, McPartlan and Goddard2003), and the regions influenced by natural selection. Today, the extent of LD has been reported for common and important sheep breeds, but there is little information about the degree of genome-wide LD in local sheep breeds (Mastrangelo et al., Reference Mastrangelo, Di Gerlando, Tolone, Tortorici, Sardina and Portolano2014), especially for small populations. Moreover, the study of LD could be used to infer effective population size (N e ) (Hayes et al., Reference Hayes, Visscher, McPartlan and Goddard2003). The N e is a general indicator of the risk of genetic erosion, contains relevant information for the monitoring of the genetic diversity, and helps to explain how populations evolved (Tenesa et al., Reference Tenesa, Navarro, Hayes, Duffy, Clarke, Goddard and Visscher2007). The pattern of historical N e can also help us to understand the impact of selective breeding strategies on the genetic variation present in populations and can provide insight into the level of inbreeding in populations for which pedigree data are incomplete or unavailable (Corbin et al., Reference Corbin, Blott, Swinburne, Vaudin, Bishop and Woolliams2010). Moreover, other methods can be used to estimate genetic diversity using marker data, such as observed and expected heterozygosity, runs of homozygosity (ROH) and Wright’s F statistic (F ST). In particular, ROH are contiguous lengths of homozygous genotypes that are present in an individual due to parental transmission of identical haplotypes to their offspring (Gibson et al., Reference Gibson, Morton and Collins2006). Because recombination events interrupt long chromosome segments, long ROH (~10 Mb) will arise as a result of recent inbreeding (up to five generations ago), whereas shorter ROH (~1 Mb) can indicate a more distant ancestral effect (up to 50 generations ago).
During the last century, erosion of livestock genetic resources was observed as the result of massive replacement of low-productivity local breeds with highly productive ones. Italians have a long history of sheep breeding and, despite a dramatic contraction in numbers, still raise several local sheep breeds that may represent a unique source of genetic diversity (Ciani et al., Reference Ciani, Ciampolini, D’Andrea, Castellana, Cecchi, Incoronato, D’Angelo, Albenzio, Pilla, Matassino and Cianci2013a). In fact, most local breeds are the result of particular adaptation to a singular, sometimes harsh environment, and in many cases no other breed could survive in that habitat (Fernández et al., Reference Fernández, Meuwissen, Toro and Mäki-Tanila2011). Therefore, the conservation and monitoring of the genetic diversity of these local breeds are fundamental to meet future breeding needs, especially in the context of global climate change.
An interesting situation is represented by Barbaresca, an ancient Sicilian sheep breed that is listed as endangered. The breed seems to originate from crosses between Tunisian Barbary sheep from North Africa and the Pinzirita breed. The endangered status of the Barbaresca breed is linked to the following peculiarities: in the year 1980, the population consisted of 35 000 heads, but by 20 years later almost 70% of the pre-existing population had disappeared. Nowadays, about 1300 animals in 20 herds are recorded in the Herd Book (ASSONAPA, 2014). Barbaresca sheep are reared in a very restricted area in central Sicily on small- and medium-sized farms under a semi-extensive farming system. Barbaresca is a dual-purpose breed; it is reared both for its milk (and the resultant local dairy products) and for its meat.
The aim of this work was to study the genomic diversity and population evolution in Barbaresca sheep using data generated from an Illumina OvineSNP50K array. Moreover, genetic diversity within the breed and its relationship with other breeds were investigated. This paper represents a case study that could have relevance for the conservation of other local endangered livestock breeds and highlights how genomic data may be used to ascertain population structures of small and endangered breeds.
Material and methods
DNA sampling, genotyping and quality control
Blood samples were collected from 40 individuals of the Barbaresca breed (36 ewes and four rams) from 10 different flocks to capture a representative sample of within-breed genetic diversity. For this breed, pedigree data were not available. All animals were genotyped for 54 241 single nucleotide polymorphisms (SNPs) using the Illumina OvineSNP50K array. Genotyping was performed by Dipartimento Scienze Agrarie e Forestali, University of Palermo, following standard operating procedures recommended by the manufacturer. Markers were filtered to exclude loci assigned to unmapped contigs. Therefore, only SNPs located on autosomes were considered for further analyses. Moreover, quality control included: call frequency≥0.95, minor allele frequency (MAF) ≥0.05 and Hardy–Weinberg equilibrium (P-value>0.001). Single nucleotide polymorphisms that did not satisfy these quality criteria were discarded. Animals with more than 5% missing SNPs were also removed from the analysis.
Linkage disequilibrium
As measurement of LD, the squared correlation coefficient of allele frequencies at a pair of loci (r 2) was estimated for all pairwise combinations of syntenic SNPs using the LD plot function in HAPLOVIEW v. 4.2 software (Barrett et al., Reference Barrett, Fry, Maller and Daly2005). For each chromosome, a pairwise r 2 was calculated for SNPs between 0 and 50 Mb apart. To examine the decay of LD with physical distance, SNP pairs on autosomes were sorted into bins based on their inter-marker distance, and average values of r 2 were calculated for each bin. Moreover, r 2 was also estimated between adjacent SNPs on each chromosome using the PLINK command --chr x --r 2 --ld-window 2 --ld-window-r 2 0 (Purcell et al., Reference Purcell, Neale, Todd-Brown, Thomas, Ferreira, Bender, Maller, Sklar, de Bakker, Daly and Sham2007). Because a relatively small number of genotyped individuals was surveyed, a corrected r 2 was calculated as (r 2−1/N)/(1−1/N), where N is twice the number of individuals (Hill and Robertson, Reference Hill and Robertson1968).
Effective population size
The r 2 values combined with the distance between markers can be used to estimate the approximate effective population size (N t ) at a given point in time (t). The N t was determined on the basis of r 2 values at different distances and assuming a model without mutation, as described by Sved (Reference Sved1971) and rearranged by Corbin et al. (Reference Corbin, Blott, Swinburne, Vaudin, Bishop and Woolliams2010), N t =(1/4c)×(1/r 2−1), in which r 2 is the mean value of LD at a given distance and c the distance between SNPs in Morgans (assuming 1 Mb=0.01 Morgans). Each genetic distance c corresponds to a value of t generations in the past, and this value was calculated as t=1/(2c). The N t was estimated at nine-time points from 250 to five generations ago. Moreover, the contemporary effective population size (N e ) was estimated using NEESTIMATOR v. 2 (Do et al., Reference Do, Waples, Peel, Macbeth, Tillett and Ovenden2014) according to the random mating model of the LD method. We used a method described by Waples and Do (Reference Waples and Do2008) to add a bias correction into the original LD method and a threshold of 0.05 as the lowest allele frequency to derive the least biased results. We reported our estimates with±95% confidence intervals.
Runs of homozygosity detection
Runs of homozygosity were defined using PLINK with the following criteria: (i) the minimum length that constituted an ROH was set to 1 Mb to ensure the exclusion of very short and common ROH that occur prevalently throughout the genome due to LD; (ii) two missing SNPs were allowed in the ROH; (iii) one heterozygous SNP was allowed; (iv) minimum density was set at 1 SNP for every 100 kb; and (v) the maximum gap between consecutive SNPs was 1 Mb. To minimize the number of false-positive findings, the minimum number of SNPs that constituted each ROH (l) was calculated by a method similar to that proposed by Lencz et al. (Reference Lencz, Lambert, De Rosse, Burdick, Morgan, Kane, Kucherlapati and Malhotra2007)
 $$l{\,\equals\,}{{\log _{e} {\alpha \over {n_{s} \cdot n_{i} }}} \over {{\rm log}_{e} (1{\minus}{\rm het})}}$$
where n s is the number of SNPs per individual, n i the number of individuals, α the percentage of false-positive ROH (set to 0.05 in the present study) and het the heterozygosity across all SNPs. Runs of homozygosity were estimated for each individual and then categorized on the basis of ROH length (1 to 5, 5 to 10, 10 to 15, 15 to 20 >20 Mb). The mean number of ROH per individual (M NROH), the average length of ROH (L MROH) and the sum of all ROH segments per animal were estimated. Moreover, the percentage of chromosomes covered by ROH was also calculated.
Genetic diversity and genomic inbreeding coefficients
PLINK was used to estimate basic genetic diversity indices, including observed and expected heterozygosity (H o and H e, respectively) and MAF (≥0.05).
The inbreeding coefficient (F) on the basis of ROH (F ROH) for each animal was calculated as follows
 $$F_{{{\rm ROH}}} {\,\equals\,}\,{{L_{{{\rm ROH}}} } \over {L_{{{\rm aut}}} }}$$
where L ROH is the total length of all ROH in the genome of an individual, L aut the specified length of the autosomal genome covered by SNPs on the chip (2452.06 Mb). Alternative estimates of inbreeding and coancestry coefficients were also calculated as follows: (i) the genomic inbreeding coefficient, on the basis of difference between the observed and expected numbers of homozygous genotypes (F HOM) using PLINK; (ii) the molecular coancestry coefficient (f ij ) between individuals i and j (Caballero and Toro, Reference Caballero and Toro2002); and (iii) the molecular inbreeding coefficient (F i ) of individual i, calculated as F i =2 f ii −1 (f ii is the molecular self-coancestry).
Analysis of genetic relationships and population structure among breeds
Genotypes from 10 other sheep breeds were considered in these analyses to clarify the genetic relationships, levels of gene flow and the admixtures within and between them. Data of six breeds were taken from the International Sheep Genomics Consortium (Kijas et al., Reference Kijas, Lenstra, Hayes, Boitard, Porto-Neto, Cristobal, Servin, McCulloch, Whan, Gietzen, Paiva, Barendse, Ciani, Raadsma, McEwan and Dalrymple2012) (Castellana n=23, Chios n=23, Lacaune n=64, Leccese n=24, Merinos n=50 and Sarda Black n=20); data of Sicilian breeds (Comisana n=48, Pinzirita n=70, Valle del Belice n=47) were taken from Mastrangelo et al. (Reference Mastrangelo, Di Gerlando, Tolone, Tortorici, Sardina and Portolano2014); and samples of Sarda White (n=30) were genotyped by the Dipartimento Scienze Agrarie e Forestali, University of Palermo.
PLINK software was used to calculate pairwise identical-by-state (IBS) distances between breeds, graphically represented by multidimensional scaling (MDS) analysis. The graphical representation was depicted using statistical R software (R Development Core Team, 2013) with the RColorBrewer package. The extents of all population substructures were evaluated through the model-based clustering algorithm implemented in ADMIXTURE (Alexander and Lange, Reference Alexander and Lange2011). The most probable number of populations in the data set (K) was estimated using the default (fivefold) cross-validation procedure in ADMIXTURE, by which estimated prediction errors are obtained for each K value by adopting a kind of ‘leave one out’ approach. The K value that minimizes the estimated prediction errors is then assumed to be the most suitable. Graphical representations were visualized using R software (R Development Core Team, 2013). GENEPOP software (Raymond and Rousset, Reference Raymond and Rousset1995) was used to estimate population relatedness using pairwise estimates of F ST among all breeds. Phylogenetic relationships among populations were also explored using Reynolds genetic distances. Neighbor networks were constructed from the estimated genetic distances using SPLITSTREE (Huson and Bryant, Reference Huson and Bryant2006).
To detect common ancestry and/or gene flow among populations, we investigated the extent of pairwise haplotype sharing between Barbaresca and the other sheep breeds reared in Sicily (Valle del Belice, Comisana, Pinzirita and Sarda White). The approach is based on the estimated Pearson correlation of signed r values for the same pair of SNPs in two breeds as measures of LD (de Roos et al., Reference de Roos, Hayes, Spelman and Goddard2008). The correlation of r between breeds was estimated for SNPs separated by <10, 10 to 25, 25 to 50, 50 to 100, 100 to 150 and 150 to 250 kb.
Results
Distribution of single nucleotide polymorphisms
Of a total of 54 241 genotyped SNPs, 378 were unmapped and 1450 were located on sex chromosomes. Thus, 52 413 SNPs mapped onto 26 sheep autosomes were used; after filtering, the final number of individuals and the number of SNPs retained for analyses were 36 and 41 857, respectively. The major point for SNP exclusion was MAF, for which 10 102 SNPs were rejected. The distribution of SNPs per chromosome (OAR) is reported in the Supplementary Table S1 and ranged from 593 on OAR24 to 4656 on OAR1.
Linkage disequilibrium
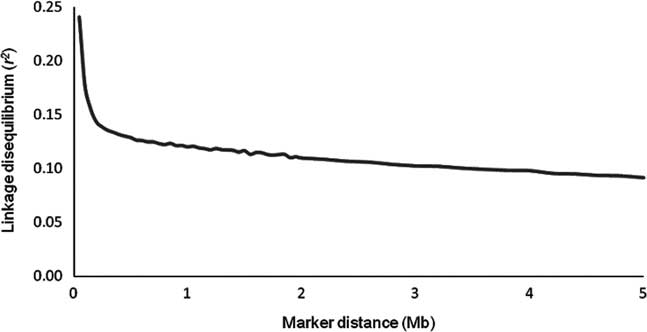
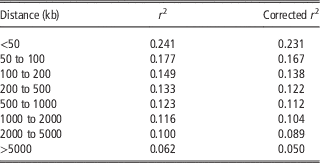
To examine the decay of LD with physical distance, SNP pairs on autosomes were sorted into bins on the basis of their inter-marker distance; then, average values of r 2 were calculated for each bin and plotted as a function of genomic distance between markers. Levels of pairwise LD decreased with increasing genomic distance between SNPs, and the most rapid decline was seen over the first 0.05 Mb (Figure 1). Short-range LD was observed in Barbaresca sheep. Overall autosomes, the average r 2 values were 0.241, 0.133 and 0.062 for SNPs up to 50 kb, SNPs separated by 200 to 500 kb and SNPs separated by >5000 kb, respectively (Table 1). The extent of LD was also evaluated for each adjacent SNP pair per chromosome (Supplementary Table S1). The mean average r 2 for all pairwise adjacent SNP combinations pooled overall autosomes was 0.215±0.018, with an average distance between adjacent SNP pairs of 63.93 kb. The r 2 ranged from 0.189±0.231 for OAR24 to 0.259±0.286 for OAR10. When the decay of r 2 with distance was plotted separately for each chromosome, the highest value was observed in OAR6 (r 2=0.270) for the 0- to 50-kb inter-marker distance; when moving from 50 to 500 kb, the chromosome with the highest mean values for r 2 was OAR10 (r 2=0.150).
Distribution of r 2 between syntenic single nucleotide polymorphism pairs across the genome as a function of physical distance (Mb) in Barbaresca breed.

Average linkage disequilibrium measured as the squared correlation coefficient of allele frequencies at a pair of loci (r 2) and corrected r 2 (Hill and Robertson, Reference Hill and Robertson1968) among syntenic single nucleotide polymorphisms over different map distances (kb) in Barbaresca sheep breed

Effective population size
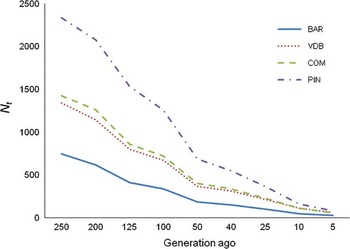
A graphical representation of the approximate N t values at each time point t, from 250 to five generations ago, is shown in Figure 2. Moreover, to enable comparison, the N t values for other Sicilian sheep breeds (Mastrangelo et al., Reference Mastrangelo, Di Gerlando, Tolone, Tortorici, Sardina and Portolano2014) are also shown. The estimated N t for Barbaresca ranged from 747 animals 250 generations ago to 28 animals five generations ago. Among the breeds examined, Barbaresca showed the lowest values. The contemporary effective population size (N e ) was 25.
Past effective population size (N t ) over the past generations based on linkage disequilibrium from 26 autosomes in Barbaresca (BAR) and other Sicilian sheep breeds (COM=Comisana; PIN=Pinzirita; VDB=Valle del Belice).

Detection of runs of homozygosity
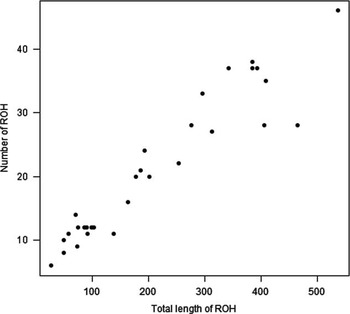
A total of 637 ROH were identified, and all individuals displayed at least six ROH. The mean number of ROH per individual was 15.9 and the average length of ROH was 10.03 Mb. There were considerable differences among individuals in the number of ROH and the length of the genome covered by ROH segments (Figure 3). The three animals with the highest level of homozygosity belonged to different farms and showed 408.2, 464.5 and 536.7 Mb of their genome classified as ROH, respectively, representing close to 20% of the total genome length. Most of the ROH were short (67%) and ranged from 1 to 10 Mb (Supplementary Table S2). The number of ROH was greater in the first three chromosomes and tended to decrease with chromosome length. The maximum size of a ROH was 59.4 Mb with 956 SNPs in OAR1. The largest percentage of the genome in ROH was observed on OAR11 (at 25.3%), whereas the lowest coverage was observed on OAR6 (7.9%).
Relationship between the total number of runs of homozygosity (ROH)>1 Mb and the total length (Mb) of genome in such ROH for individuals.

Genetic diversity indices and genomic inbreeding coefficients
Genetic diversity indices and inbreeding and coancestry coefficients, which were estimated using different approaches and which are key parameters in the genetic management of populations, were used to determine the levels of genetic variability in the breed (Table 2). The results revealed that Barbaresca tended to display lower variability than other Sicilian breeds. In fact, Mastrangelo et al. (Reference Mastrangelo, Di Gerlando, Tolone, Tortorici, Sardina and Portolano2014) reported higher values of MAF (from 0.290 to 0.301), N e (from 369 to 685) and gene diversity (H e) (from 0.379 to 0.390), and lower inbreeding (from 0.016 to 0.055) in these breeds.
Estimates of genetic diversity indices and genomic inbreeding coefficients of Barbaresca breed

MAF=average minor allele frequency; H o=observed heterozygosity; H e=expected heterozygosity; N e =effective population size; F ROH>1 Mb=inbreeding coefficient based on runs of homozygosity; F HOM=inbreeding coefficient on the basis of the difference between observed v. expected number of homozygous genotypes; F i =molecular inbreeding coefficient of individual i; f ij =molecular coancestry coefficient between individuals i and j.
Analysis of genetic relationship and population structure among breeds
Genotyping data from Barbaresca samples were merged with those of other sheep breeds. The whole data set consisted of 435 individuals from 11 populations genotyped for 42 351 SNPs spread over all autosomal chromosomes.
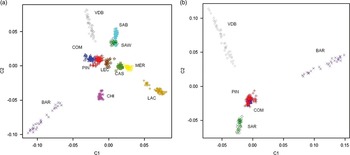
We used an MDS plot of the pairwise IBS distance to compare the Barbaresca individuals with the other populations. The results showed that most sheep breeds formed non-overlapping clusters and were clearly separate populations (Figure 4a), with the breeds separated according to their geographic origin. In particular, the first dimension (C1) distinguished Barbaresca from other breeds. Moreover, the Barbaresca individuals showed more spread clusters, which is typical of breeds that show admixture with other breeds. To explore in detail the relatedness, an MDS plot was also created for the Sicilian and Sarda White sheep breeds (Figure 4b). The results indicated isolation and greater genetic distance among Barbaresca and the other breeds reared in Sicily and an absence of gene flow among them.
(a) Genetic relationship defined with multidimensional scaling analysis among 11 sheep breeds and (b) among Barbaresca and the sheep breeds reared in Sicily. BAR=Barbaresca; CAS=Castellana; CHI=Chios; COM=Comisana; LAC=Lacaune; LEC=Leccese; MER=Merinos; PIN=Pinzirita; SAB=Sarda Black; SAR=Sarda; SAW=Sarda White; VDB=Valle del Belice.

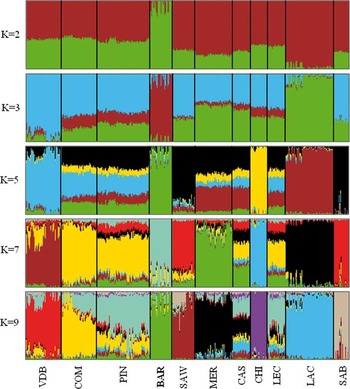
Results from within the population substructure, according to admixture analysis and considering a range of 2 through 20 potential clusters (K), indicated that the most probable number of inferred populations was K=9. A graphic representation of the estimated membership coefficients for the nine clusters is shown in Figure 5, where model-based clustering partitions the genome of each sample into a predefined number of components. The first breed to be differentiated from the others was Barbaresca (K=2). These results corroborate the findings on the basis of MDS plot for all breeds. At K=9, each breed tends to have its own distinct cluster, but some differences persist. In fact, some breeds showed a complex admixture-like pattern, notably, the Sicilian breeds (Comisana and Pinzirita), Leccese and Castellana.
Model-based clustering of 11 sheep breeds analyzed in each of the inferred clusters (K), from K=2 to K=9. BAR=Barbaresca; CAS=Castellana; CHI=Chios; COM=Comisana; LAC=Lacaune; LEC=Leccese; MER=Merinos; PIN=Pinzirita; SAB=Sarda Black; SAW=Sarda White; VDB=Valle del Belice.

The degree of genetic differentiation between pairs of breeds is reported in the Supplementary Table S3. With respect to pairwise F ST among all populations, Barbaresca was the most divergent breed. The highest F ST value was seen between Barbaresca and Chios (F ST=0.145) and the lowest value was for Comisana v. Pinzirita (F ST=0.021). To provide additional insight into the relationships and the origin of Barbaresca, we constructed a neighbor-net graph based on Reynolds genetic distances (Supplementary Figure S1) between pairs of breeds. The Pinzirita showed the lowest value for genetic distance from Barbaresca (Supplementary Table S3). In agreement with the MDS plot, the graph showed some clear clusters and relationships between breeds that originated from the same region or area, notably, the Sicilian, Sardinian and European ones. Barbaresca branched between Chios and Valle del Belice. The shortest branch was observed for Pinzirita, whereas the longest one was found for Barbaresca and Chios.
The Pearson correlations for the signed r values among Sicilian breed pairs are shown in Supplementary Table S4. In particular, the table reports the correlations for pairs of SNPs separated by <10 kb and by 150 to 250 kb. Similar to r 2, r decreased as the distance between markers increased. The haplotype sharing analysis (0 to 10 kb), which presumably reflects the oldest historical relationship between breeds, showed that Barbaresca had a consistently high degree of haplotype sharing with Pinzirita and a low degree of haplotype sharing with Sarda White. Among all breeds, the highest level of haplotype sharing was found between Pinzirita and Valle del Belice. As expected due to their history, haplotype sharing by the Sicilian dairy sheep breeds was by far the highest. The same trends were reported for pairs of SNPs separated by 150 to 250 kb.
Discussion
The advent of high-throughput genotyping arrays has greatly facilitated the study of genetic structure in livestock species, but whereas much effort has been devoted to uncovering genetic differences and population structure within dominant commercial breeds, local breeds, which are less widely used, are generally understudied (Beynon et al., Reference Beynon, Slavov, Farré, Sunduimijid, Waddams, Davies, Haresign, Kijas, MacLeod, Newbold, Davies and Larkin2015). This study provides the first overview of population structure estimates of the Barbaresca sheep from a genome-wide perspective.
The average LD estimates in Barbaresca breed were quite variable. The variation for the average r 2 between chromosomes (Supplementary Table S1) was probably attributable to variations in recombination rates between and within chromosomes, genetic drift and selection (Qanbari et al., Reference Qanbari, Pimentel, Tetens, Thaller, Lichtner, Sharifi and Simianer2010). A typical LD pattern was observed, with higher LD for markers close to each other that quickly decayed with increasing inter-marker distance. Our findings can be compared directly with results from other studies conducted using a similar LD measure and SNP panel. For example, García-Gámez et al. (Reference García-Gámez, Sahana, Gutiérrez-Gil and Arranz2012), in Spanish Churra sheep, reported an average r 2 of 0.061 for SNPs separated by 200 to 500 kb. Mastrangelo et al. (Reference Mastrangelo, Di Gerlando, Tolone, Tortorici, Sardina and Portolano2014) reported an average r 2 for adjacent SNP pairs of 0.155, 0.156 and 0.128 in the Valle del Belice, Comisana and Pinzirita breeds, respectively. These studies of LD in dairy sheep breeds showed lower values than those seen for Barbaresca, indicating that LD decay was breed-specific. Recently, Kijas et al. (Reference Kijas, Porto‐Neto, Dominik, Reverter, Bunch, McCulloch, Hayes, Brauning and McEwan2014), in a study of five sheep breeds that used a high-density SNP chip, found an average r 2 ranging from 0.080 to 0.224 for SNPs up to 70 kb apart and reported that LD decayed faster and at a much shorter genomic distance. Consistent with our results, Al-Mamun et al. (Reference Al-Mamun, Clark, Kwan and Gondro2015) reported that the maximum average LD was located between adjacent SNPs on OAR10 and a higher average LD was seen in meat sheep breeds. Values of r 2 for adjacent SNP pairs were also similar to the values observed in other livestock species such as cattle (r 2=0.20 for SNPs with an average distance of 68 Kb) (Bohmanova et al., Reference Bohmanova, Sargolzaei and Schenkel2010) and goats (r 2=0.11 to 0.29 for SNPs with physical distance ranging from 53 to 73 kb) (Brito et al., Reference Brito, Jafarikia, Grossi, Kijas, Porto-Neto, Ventura, Salgorzaei and Schenkel2015), although these were lower than those observed in pigs, where one study reported an average r 2 of 0.41 to 0.46 for SNPs <50 kb apart (Veroneze et al., Reference Veroneze, Lopes, Guimaraes, Silva, Lopes, Harlizius and Knol2013), and in horses (Corbin et al., Reference Corbin, Blott, Swinburne, Vaudin, Bishop and Woolliams2010), which showed r 2 values remaining >0.3 for distances up to 185 kb. The relatively small number of genotyped Barbaresca individuals may have resulted in an overestimation of r 2, which could explain the differences in the LD values v. the other Sicilian sheep breeds (Mastrangelo et al., Reference Mastrangelo, Di Gerlando, Tolone, Tortorici, Sardina and Portolano2014). The same consideration was reported by Veroneze et al. (Reference Veroneze, Lopes, Guimaraes, Silva, Lopes, Harlizius and Knol2013) to explain the differences in the r 2 values in pig breeds. However, it should be emphasized that several studies have reported LD analysis in sheep (Kijas et al., Reference Kijas, Lenstra, Hayes, Boitard, Porto-Neto, Cristobal, Servin, McCulloch, Whan, Gietzen, Paiva, Barendse, Ciani, Raadsma, McEwan and Dalrymple2012; Ciani et al., Reference Ciani, Crepaldi, Nicoloso, Lasagna, Sarti, Moioli, Napolitano, Carta, Usai, D’Andrea, Marletta, Ciampolini, Riggio, Occidente, Matassino, Kompan, Modesto, Macciotta, Ajmone-Marsan and Pilla2013b) in which, despite a higher number of breeds, the number of individuals per breed was similar to those involved in our study. To address this concern, a corrected r 2 was calculated; the differences between estimated and corrected r 2 values were small (about 0.01 units; Table 1 and Supplementary Table S1). Therefore, we decided to present the non-corrected values in the main text. The decay of LD in a genome determines the power of quantitative trait loci detection in association mapping studies and helps to determine the number of markers required for successful association mapping and genomic selection. In fact, species with extensive LD will require lower marker density to capture most of the genetic variation than species with low levels of LD. Qanbari et al. (Reference Qanbari, Pimentel, Tetens, Thaller, Lichtner, Sharifi and Simianer2010) considered an r 2 threshold of 0.25 as a useful LD value for association studies. Corbin et al. (Reference Corbin, Blott, Swinburne, Vaudin, Bishop and Woolliams2010) reported that an average r 2 above 0.3 should be employed for genome-wide association study. An average r 2 below 0.25 was found in the Barbaresca breed for markers located up to 50 kb apart, whereas when the average distance between adjacent SNP pairs was 63 kb, the average r 2 was 0.215. Our results support the need to use denser SNP panels to ensure high power association mapping in future breeding programs for this local sheep breed. However, the relatively low levels of LD detected in Barbaresca might be explained by an effect of ascertainment bias, given that this breed was not used to set up the Illumina OvineSNP50 BeadChip.
The r 2 values, combined with marker distances, were used to infer approximate N t at any given point t in the past. This important parameter helps predict rates of loss of neutral genetic variation, fixation of deleterious and favorable alleles, and any increase in inbreeding experienced by a population (England et al., Reference England, Cornuet, Berthier, Tallmon and Luikart2006). As pointed out in Hayes et al. (Reference Hayes, Visscher, McPartlan and Goddard2003), LD at small distances reflects N t in the distant past, whereas LD at large distances reflects N t in the recent past. In fact, the higher r 2 observed in Barbaresca could be the result of a smaller N t in the more recent past compared with other Sicilian sheep breeds (Mastrangelo et al., Reference Mastrangelo, Di Gerlando, Tolone, Tortorici, Sardina and Portolano2014) (Figure 2). The N t values have declined rapidly over time. The estimate of N t 50 generations ago was ~183 individuals. Consistent with our results, Ciani et al. (Reference Ciani, Crepaldi, Nicoloso, Lasagna, Sarti, Moioli, Napolitano, Carta, Usai, D’Andrea, Marletta, Ciampolini, Riggio, Occidente, Matassino, Kompan, Modesto, Macciotta, Ajmone-Marsan and Pilla2013b), in a genome-wide analysis of Italian sheep breeds, reported a low past N e value of 224 in Altamurana, which, like Barbaresca, is an endangered breed that has experienced a dramatic census contraction. Kijas et al. (Reference Kijas, Lenstra, Hayes, Boitard, Porto-Neto, Cristobal, Servin, McCulloch, Whan, Gietzen, Paiva, Barendse, Ciani, Raadsma, McEwan and Dalrymple2012), in a genome-wide analysis of the world’s sheep, reported high previous N e for many breeds, with 25 breeds exceeding 500 individuals; only six breeds (Wiltshire, Soay, Dorset Horn, Valais Red, East Friesian Brown and Sakiz) showed evidence of a comparatively narrow genetic base (<200 individuals) like that displayed in Barbaresca. It should be emphasized that the estimates of N e might be strongly biased when the sample size is small, probably as a result of the LD generated by the sampling process. England et al. (Reference England, Cornuet, Berthier, Tallmon and Luikart2006) showed that N e estimates from the most commonly used LD-based estimator will be substantially biased with small sample sizes, unless the true N e is smaller than the sample size used to estimate it. Actually, none of the formulas proposed to date for estimating past N e from r 2 provides reliable predictions (Corbin et al., Reference Corbin, Liu, Bishop and Woolliams2012), probably because they all rely on simplifications or assumptions. For example, in all models, estimates of N e were highly sensitive to thresholds imposed upon MAF and to a priori assumptions about the expected r 2 for adjacent markers (Corbin et al., Reference Corbin, Liu, Bishop and Woolliams2012). To infer N e in the present study, we also used a method described by Waples and Do (Reference Waples and Do2008), which is considered to correct for bias in estimates of N e based on LD data. The N e reported for Barbaresca was very low (25). This could have resulted from population bottlenecks caused by the geographic isolation of some farms and reduced interest from breeders. Recently, Al-Mamun et al. (Reference Al-Mamun, Clark, Kwan and Gondro2015), in a study of Australian sheep on the basis of SNP data and using the same method, showed higher values of N e for all investigated breeds that ranged from 140 to 348. Generally, high selection pressure and the use of artificial insemination are the main reasons for the low N e , but in local breeds, where selection is absent and uncontrolled mating of related animals is common, inbreeding and low genetic diversity, as observed in Barbaresca, are a consequence of the low N e . As already mentioned, the reduction of N e in this breed could also have been caused by reduced interest from breeders. In the previous years, selection programs have strongly emphasized production traits; this has led to increased specialization for traits such as milk yield and quality, meat, and wool (Tolone et al., Reference Tolone, Mastrangelo, Rosa and Portolano2012). This has led to greater reliance on a small number of sheep breeds and a decline in the genetic diversity of livestock. Frankham et al. (Reference Frankham, Bradshaw and Brook2014) recommended that short-term and long-term N e should be equal to 100 and 1000, respectively, individuals to control the inbreeding rate and maintain the evolutionary potential of the population. Therefore, if we consider 100 as the minimum acceptable N e to conserve a population, the estimate for Barbaresca is below the critical value, meaning that the viability of the population may be compromised.
According to the ROH analysis, evidence of recent inbreeding was strong in this breed. In fact, although most of the ROH detected in Barbaresca were in the shorter length categories (1 to 10 Mb), as also reported in studies of cattle populations (Mastrangelo et al., Reference Mastrangelo, Tolone, Di Gerlando, Fontanesi, Sardina and Portolano2016), the individuals showed a total length of ROH characterized by the presence of large segments (23% of ROH>10 Mb). In general, estimates of ROH are rare in local breeds, and to the best of our knowledge, few studies have been conducted in sheep. However, similar results were reported by Al-Mamun et al. (Reference Al-Mamun, Clark, Kwan and Gondro2015) for the mean number and length categories of ROH. F ROH provided a good measure of individual genome-wide autozygosity, and compared with the alternative estimates of inbreeding and coancestry coefficients, it allows researchers to distinguish between recent and more distant inbreeding (McQuillan et al., Reference McQuillan, Leutenegger, Abdel-Rahman, Franklin, Pericic, Barac-Lauc, Smolej-Narancic, Janicijevic, Polasek, Tenesa, Macleod, Farrington, Rudan, Hayward, Vitart, Rudan, Wild, Dunlop, Wright, Campbell and Wilson2008). Estimates of inbreeding coefficients depend on the methods used. In fact, F coefficients estimated using allele frequencies (F HOM) showed considerable variation within the breed with respect to the other estimates (F ROH and F i ) and had the highest CV. Molecular inbreeding (F i ) and molecular coancestry (f ij ) coefficient values were much higher than the other coefficients because these two methods (which are obtained on a SNP-by-SNP basis) do not discriminate between alleles that are identical by descent (IBD) or IBS (Rodríguez-Ramilo et al., Reference Rodríguez-Ramilo, Fernández, Toro, Hernández and Villanueva2015). Moreover, the strong correlation between the pedigree inbreeding coefficient and the sum of ROH reported by several authors (Purfield et al., Reference Purfield, Berry, McParland and Bradley2012) indicates that the estimates of F ROH are a good reflection of IBD and suggests that, in the absence of an animal’s pedigree data, as may be the case for local endangered breeds, the extent of a genome under ROH may be used to infer aspects of recent population history, even from relatively few samples. In agreement with the low N e , relatively higher genomic F coefficients and less gene diversity (H e) were found in Barbaresca than in other Sicilian sheep breeds (Mastrangelo et al., Reference Mastrangelo, Di Gerlando, Tolone, Tortorici, Sardina and Portolano2014). All values were consistent with the range observed by other authors in other endangered sheep breeds (Kijas et al., Reference Kijas, Lenstra, Hayes, Boitard, Porto-Neto, Cristobal, Servin, McCulloch, Whan, Gietzen, Paiva, Barendse, Ciani, Raadsma, McEwan and Dalrymple2012; Ciani et al., Reference Ciani, Crepaldi, Nicoloso, Lasagna, Sarti, Moioli, Napolitano, Carta, Usai, D’Andrea, Marletta, Ciampolini, Riggio, Occidente, Matassino, Kompan, Modesto, Macciotta, Ajmone-Marsan and Pilla2013b). The results were expected given the decline in population size during the past 30 years and confirmed the findings of a previous study conducted on the genetic structure of Sicilian sheep breeds based on microsatellite markers (Tolone et al., Reference Tolone, Mastrangelo, Rosa and Portolano2012) that reported the lowest values of genetic diversity for Barbaresca. In sum, all the investigated parameters indicated an endangered status and confirmed the threat of extinction for this local sheep breed.
Determination of genomic structure can be valuable in prioritizing populations for conservation and for developing suitable management practices. The results indicated that Barbaresca was the most distant group and emphasized the clear genetic differences v. the other breeds considered in this study. In fact, the MDS clearly separated Barbaresca from the other breeds, and this was in agreement with neighbor-networks, F ST, and model-based clustering (K=2). The breed showed a low level of admixture with other breeds, indicating that there is less genetic data remaining from any other ancestral breed that may have interacted with it, which may be considered as a typical signal of inbreeding (Ciani et al., Reference Ciani, Lasagna, D’Andrea, Alloggio, Marroni, Ceccobelli, Delgado Bermejo, Sarti, Kijas, Lenstra and Pilla2015). Recently, Falush et al. (Reference Falush, van Dorp and Lawson2016) reported a simulation with human data where one of the populations was admixed and just one of the ancestral populations of the mixture was sampled, and the pattern reported by ADMIXTURE for K=2 was the same as the one found in our breed. The authors showed that if admixture events or genetic drift affect all members of the sample equally, the ADMIXTURE algorithms simply shifts the allele frequencies of the inferred ancestral population to reflect the fraction of admixture that is shared by all individuals and this can result in misinterpretation of the true admixture history, particularly when applied to data sets where there is little prior knowledge on the relationships between groups. Therefore, the results of ADMIXTURE and the MDS plot, where the Barbaresca showed a diagonal pattern against the center of the plot, could be misinterpreted and the amount of admixture may be not small at all. Moreover, considering the Barbaresca as an admixed breed, the estimation of F ST can be biased because computed between a pair of breeds of which one of them is inbred with a distant breed. Consequently, high values of F ST will not necessary mean that the breed has high inbreeding, but also that one of the ancestral populations is genetically far away from the group (Peter, Reference Peter2016). It should be mentioned the possibility of admixture with other populations not investigated in this study. In fact, it may be that we found no admixture because the used sample was imperfect and because there were not sheep breeds from North Africa included (Barbarian breed) in the studied populations, but just European ones. Therefore, despite there were several results that showed the high inbreeding of the Barbaresca breed such as ROH analysis, it is important to underline that some of the statistics used in this study can be biased because the Barbaresca is an admixed breed.
The long branch observed for Barbaresca was typical of differentiated and isolated populations with small effective population sizes (Kijas et al., Reference Kijas, Lenstra, Hayes, Boitard, Porto-Neto, Cristobal, Servin, McCulloch, Whan, Gietzen, Paiva, Barendse, Ciani, Raadsma, McEwan and Dalrymple2012). To evaluate the degree of haplotype sharing between breeds, the extent of LD was characterized by signed r. In a previous study of sheep breeds (Kijas et al., Reference Kijas, Lenstra, Hayes, Boitard, Porto-Neto, Cristobal, Servin, McCulloch, Whan, Gietzen, Paiva, Barendse, Ciani, Raadsma, McEwan and Dalrymple2012), a high degree of conservation of LD was observed between the Sicilian breeds for SNP pairs separated by 10 kb or less. The results of haplotype sharing analysis between the Barbaresca and Pinzirita breeds, for SNP pairs separated by 150 to 250 kb, indicated that the phase relationship among alleles was similar in both populations. High correlation of r between breeds within long intervals implies that they share the same long haplotypes (de Roos et al., Reference de Roos, Hayes, Spelman and Goddard2008). The results were consistent with their relationships and evolutionary history. In fact, the Barbaresca breed seems to derive from crosses between the Tunisian Barbary from North Africa and Pinzirita, along with posterior selection for growth performance (Tolone et al., Reference Tolone, Mastrangelo, Rosa and Portolano2012). These results suggest a common ancestry between these breeds. In fact, although the F ST values indicated very strong differentiation between Barbaresca and other breeds, the lowest F ST was found between Barbaresca and Pinzirita (0.071). Moreover, a hypothesis of coancestry between these two breeds was also supported by the lowest Reynolds genetic distance. However, there are robust procedures which reveal key information about ancestral relationships among individuals (Lawson et al., Reference Lawson, Hellenthal, Myers and Falush2012; Maples et al., Reference Maples, Gravel, Kenny and Bustamante2013) that, if needed, can be used to estimate the proportions of admixture of the two breeds with high accuracy.
Another interesting result was found for the Pinzirita. This breed always displays the lowest Reynolds genetic distance with all breeds and seems to share some ancestry with most of them (Figure 5). This would indicate that Pinzirita is ancestral to other Italian breeds.
The consistency of the results among the several approaches used (MDS, Bayesian clustering, F ST, neighbor networks and haplotype sharing) suggests that our conclusions are robust.
The population structure and the low genetic diversity presented here should be useful in creating conservation strategies. The term conservation management implies a compromise between control of global genetic diversity, avoidance of high inbreeding levels and maintenance of a certain degree of differentiation (Fernández et al., Reference Fernández, Toro and Caballero2008). The studied breed showed a defined genetic structure, a relatively lower genetic diversity (0.371) and contemporary effective population size (25), and a higher level of inbreeding (0.062) compared with other Sicilian sheep breeds. If reproductive isolation within groups of the same flock and area is maintained in subsequent generations, the short-term rate of inbreeding will increase dangerously, resulting in a decrease in the effective population size and seriously damaging the breed’s future. Thus, efforts should be made to improve genetic diversity in this breed. In particular, mating decisions will play an important role in limiting inbreeding and will increase the size of this breed. However, since the two ancestral populations (Tunisian Barbary and Pinzirita) still exist, the genetic heritage of the Barbaresca breed could perhaps be reconstructed, although the blood levels of the two breeds in Barbaresca are unknown.
Additional factors should be taken into account when defining conservation priorities, including economic and ecological aspects. Local populations play an important role in the utilization of marginal agricultural resources and contribute to environmental and socio-economic stability, but local farmers struggle because they cannot take advantage of economies of scale in breeding and marketing programs. Many typical high-quality dairy (ricotta and pecorino) and meat products can be obtained from the Barbaresca breed, and their use represents an important chance of survival for this breed. Consequently, another important aspect of conservation is recognition of the special value of these typical products. To ensure profitability, this marketing link between Barbaresca and its products should be defended against fraudsters who include milk or meat from other populations.
There are numerous potential uses for genomic information that make routine genotyping desirable for the management of small populations. However, whereas our study describes an example of the Barbaresca breed, the applied genome-wide analyses are valid for all small and endangered breeds. Therefore, we recommend the continuous collection of genotypes and their use in breed monitoring and improvement, particularly for local breeds.
Acknowledgments
The authors would like to thank four anonymous referees for valuable comments, which helped to improve the manuscript.
This research was financed by PON02_00451_3133441, CUP: B61C1200076005 funded by MIUR.
Supplementary material
To view supplementary material for this article, please visit https://doi.org/10.1017/S1751731116002780