Hospital-acquired infection (HAI) data are reported by hospitals to the Centers for Disease Control and Prevention (CDC), and these data are made public on websites such as the Centers for Medicare and Medicaid Services (CMS) Hospital Compare website (http://medicare.gov/hospitalcompare). Public reporting of hospital quality data, including HAI data, is a key element of the Patient Protection and Affordable Affordable Care Act 1 and other US healthcare legislation.Reference Colmers 2 The goals of reporting quality-of-care data include allowing patients to make informed decisions regarding the hospital they go to, rewarding high-performing hospitals, and increasing the quality of healthcare.
Our previous work has shown that patients have difficulty correctly interpreting HAI data as it is currently presented on the CMS Hospital Compare website. We found that study participants were not able to accurately identify better-performing hospitals when presented with numeric HAI data.Reference Masnick, Morgan and Sorkin 3 This is not unexpected because correct interpretation of the tables on the CMS Hospital Compare website requires understanding of rates and ratios. Such quantitative literacy (“the knowledge and skills needed to identify and perform computations using numbers that are embedded in printed materials”Reference Kutner, Greenberg, Jin, Boyle, Hsu and Dunleavy 4 ) and health literacy are low in the United States, with 55% of Americans having basic or below-basic quantitative literacy.Reference Kutner, Greenberg, Jin, Boyle, Hsu and Dunleavy 4 The new method for presenting HAI data developed for this study utilizes a visual representation of the data; others have shown that this type of technique may improve patient understanding.Reference Zipkin, Umscheid and Keating 5 , Reference Garcia-Retamero and Hoffrage 6
In this paper, we present the results of a randomized controlled trial in which we compared a new method for presenting HAI data to the current presentation method used on the CMS Hospital Compare website. Both data presentation methods can be seen in the Online Supplement to this paper.
METHODS
We conducted a randomized controlled trial with newly admitted hospital patients comparing a new HAI data presentation method to one of the methods currently used on the CMS Hospital Compare website. Study participants were asked to complete a survey in which they compared 2 hypothetical hospitals based on HAI data presented with either the new method (experimental arm) or the CMS Hospital Compare method (control arm).
Development of New Method for Presenting Data
The new method for presenting the HAI data was developed based on best practices for user-centered designReference Garrett 7 and visual presentation of data.Reference Tufte 8 – Reference Few 10 The new presentation method was improved iteratively through one-on-one testing with naïve users (people who had not seen HAI data previously).Reference Masnick 11
Survey Instrument
The survey instrument consisted of the following 3 sections (see the Online Supplement and Table 1 for details):
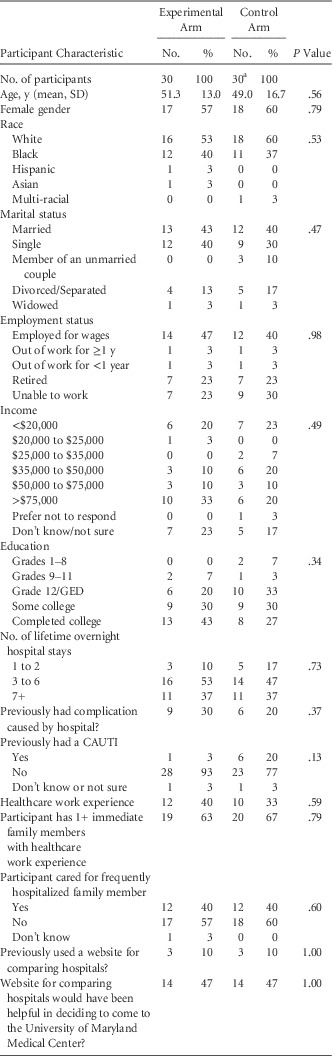
Demographics and Characteristics of Participants Who Completed the Survey (n=60) by Study Arm

NOTE. GED, general equivalency degree (or diploma); CAUTI, catheter-assoicated urinary tract infection.
a One participant in the control arm was interrupted during the interview and did not complete the survey; thus, these data were not available for this participant and they were therefore excluded from this table.
The (1) introductory information section of the survey provided a self-administered explanation of catheter-associated urinary tract infections (CAUTI) to participants. CAUTI was chosen as a representative HAI for the purposes of this study because it is comparatively simple to explain and a greater percentage of patients are at risk for CAUTI than for any other HAI reported on the CMS Hospital Compare website.
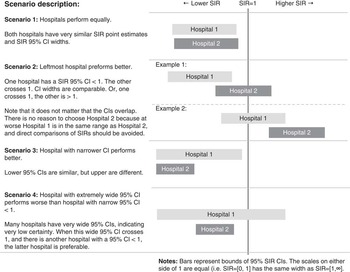
The (Reference Colmers2) hospital comparison section consisted of 4 scenarios (Figure 1) with 3 questions each (a total of 12 questions):
Scenarios for comparing hospitals based on healthcare-associated infection (HAI) data.

Scenario 1: The 2 hypothetical hospitals performed equally well.
Scenario 2: One hospital was better than the other hospital.
Scenario3: Both hospitals were above-average, but one performed better due to a narrower 95% CI.
Scenario 4: One hospital had a very wide 95% CI.
These 4 scenarios occur frequently in comparisons of hospitals in health referral regions 12 (data not shown). Each question presented the participant with HAI data for 2 hypothetical hospitals and asked them, “Which hospital would you choose based only on the CAUTI information [presented above]?” The multiple-choice response options for all questions were (a) Hospital 1; (b) Hospital 2; (c) Either; or (d) Not sure. The underlying data were identical for all participants, but the data presentation differed by study arm. Participants were randomly assigned to 1 of the 2 arms. This section of the survey was self-administered on an iPad (Apple, Inc, Cupertino, CA). Participants were blinded (ie, not aware which data presentation method was new). The interviewer was not blinded but did not provide any assistance to participants beyond basic use of the iPad. The interviewer collected data for the (Reference Masnick, Morgan and Sorkin3) demographic and healthcare experience sections from each participant.
Study Population and Inclusion/Exclusion Criteria
Data were collected from patients ≥18 years of age admitted to the University of Maryland Medical Center (UMMC), a 760-bed tertiary referral hospital in Baltimore, Maryland. Patients were randomly selected within 24 hours of admission using a methodology that has been successful previously.Reference Masnick, Morgan and Sorkin 3 Data were not collected from areas of the hospital where patients were unlikely to be capable of completing a survey (eg, medical or surgical intensive care) or where conducting the survey would disrupt patient care (eg, obstetrics, psychiatry). If patients were unavailable initially (eg, a healthcare worker was in their room), the interviewer returned later that day to reattempt enrollment. Participants unavailable after 2 enrollment attempts were excluded from the study, as were those patients who were discharged prior to enrollment, were physically or mentally unable to participate, were unable to read or speak English, or were on airborne or enhanced contact precautions. Patients were not provided an incentive for completing the survey. This study was reviewed by the University of Maryland Institutional Review Board. Power calculations indicated that a sample size of 26 per arm was sufficient for detecting an improvement (or decline) of 20% between the control and experimental arms with 80% power at α=0.05.
Randomization
After enrollment, participants were randomized automatically on an iPad using variable block sizes of 2, 4, 6, or 8 into (a) the experimental arm (using the new data presentation method) or (b) the control arm (using HAI data as presented on the CMS Hospital Compare website).
Data Analysis
The prespecified primary endpoint was the difference in average number of correct answers between study arms (see Online Supplement, questions 1–12). This difference was compared using a 2-sided Student t test. Analysis was performed according to an intention-to-treat paradigm. Analyses were performed blinded to study arm.
Demographic and health experience variables were compared between study arms using Pearson’s χ2 tests for categorical variables and 2-sided Student t tests for continuous variables.
RESULTS
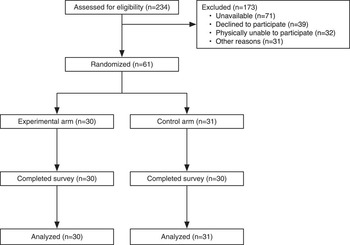
A total of 234 inpatients were assessed for eligibility to participate in the study (Figure 2). Of these, 173 were excluded or declined to participate. Ultimately, 61 were enrolled in the study, and 60 completed the survey between May 15, 2015, and June 2, 2015. One participant in the control arm was interrupted during the interview and did not complete the survey; following an intention-to-treat paradigm, this participant’s incomplete answers to the hospital comparison questions were counted as incorrect for analysis.
Participant flow in trial of 2 methods for presenting public data on healthcare-associated infection (HAI).

No statistically significant differences in demographics between study arms were detected (Table 1). While not statistically significant, there were differences in educational attainment between study arms (eg, 43% completed college in the experimental arm versus 27% in the control arm); we performed a secondary analysis adjusting for educational attainment to address this difference, described below. In both arms, 10% of participants said they had previously used a website for comparing hospitals; 47% in both arms said that a website for comparing hospitals would have been useful in choosing a hospital.
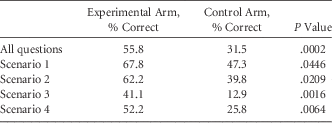
The experimental arm performed better than the control arm for all scenarios individually and for the primary endpoint of all questions combined (Table 2). For the latter, participants got 55.8% of questions correct on average in the experimental arm and 31.5% correct in the control arm (P=.0002). Excluding the control arm participant who did not complete the survey, the mean percentage correct in the control arm was 31.9% (P=.0002).
The Mean Percentage of Correct Answers to Questions Regarding Healthcare-Associated Infection (HAI) DataFootnote a by Participants Comparing 2 Hypothetical Hospitals

a Results are presented for all hospital comparison questions and for subsets of questions by scenario (see Figure 1). P values are from 2-sided Student t tests.
On average, participants took 10.9 minutes (SD, 4.4) to complete the survey in the experimental arm compared with 9.4 minutes in the control arm. This difference was neither statistically significant (by 2-sided Student t test, P=.35) nor biologically important.
In the experimental arm, 73% of participants had at least some college education, compared with 57% in the control arm (P=.34; Table 1). While this difference between study arms was not statistically significant, we performed a regression analysis to compare performance between arms while controlling for educational attainment. When including (1) study arm and (2) a binary variable indicating at least some college as independent variables in a linear regression model, the adjusted difference in performance between study arms was 22.3% (P<.001). Recall that the unadjusted difference between arms was 55.8% – 31.5%=24.3%.
To examine the effects that reduced mental acuity related to hospitalization (ie, the effects of acute illness, medications, disrupted sleep wake cycle, etc) may have had on our results, we performed a subanalysis in which we included only those subjects who scored better than chance (>33% correct, based on 3 plausible response options for each question). Our assumption was that those subjects who performed worse than would be expected by chance (5 experimental arm subjects and 18 controls) might not fully understand the premise of the questions. Excluding these 23 subjects, the remaining experimental arm subjects (n=25) properly interpreted the data 63.7% of the time on average, compared to 48.1% in the remaining control subjects (n=13). The difference between the arms in this subanalysis (16%) was still statistically significant (P=.04).
DISCUSSION
We found that a new method for presenting HAI data increased correct interpretation of HAI data from 31.5% to 55.8% compared to the standard presentation method used on the CMS Hospital Compare website. We observed this improvement in a diverse, multiracial group of subjects with a wide range of income and education levels. We found that 47% of subjects would find a website for comparing hospitals useful in choosing a hospital, but few had ever used the CMS Hospital Compare website.
To our knowledge, this is the first study to quantitatively examine patient understanding of HAI data. Although quantitative assessments of understanding have not been used previously to assess methods of presenting HAI data, the study methods used here are similar to those frequently used in the private sector to improve the user interface of an application or website. For example, companies such as Amazon, Google, and Netflix often use “A/B testing” to optimize their user interfaces.Reference Christian 13 In A/B testing, 2 versions of a website are created; half of the visitors to the website are randomly assigned to see version A and the other half see version B, and subsequent user actions, such as purchasing a product, are tracked to determine the relative effectiveness of the A and B versions of the website. Although qualitative data, such as data from focus groups and from one-on-one user testing, can help direct the design of data presentation methods, more rigorous quantitative methods such as the ones we employed are necessary to truly assess and compare methods of presenting data.
Although our method of presenting data was better than the method used on the CMS Hospital Compare website, the percentage of correct answers obtained using our new method (56%) was not as high as we wished. This may be partly due to decreased mental acuity associated with hospitalization; thus, we might observe a higher percentage if the method was used by the general public. We observed a small increase in the percentage of correct answers (64%) from a subanalysis excluding participants who performed worse than chance in the experimental arm; our assumption was that the excluded patients might not fully understand the premise of the questions. However, far more patients performed worse than chance in the control arm (n=18) than the experimental arm (n=5), suggesting that poor performance may be related to the method for presenting the data, rather than general confusion about the survey. The relatively large number of participants who performed worse than chance in the control arm is disappointing but consistent with our past study,Reference Masnick, Morgan and Sorkin 3 and this result provides further evidence of the need to improve the way these data are presented. Additional efforts are needed to further test and improve HAI data presentation methods.
Strengths of this study include a blinded randomized controlled trial design and the diversity of the study population. Furthermore, the new data presentation method described here was created from the publicly available hospital quality data published on the CMS Hospital Compare website. Thus, our presentation method could be easily adopted without collecting additional information from hospitals. Our study has several limitations. We examined only 1 of the methods that CMS Hospital Compare uses to present HAI data, and we did not perform a comparison in the broader context of the Hospital Compare website (ie, in this study, HAI data were presented for 2 hypothetical hospitals rather than for multiple hospitals in a search initiated by the user). Finally, this was a single-center trial including only hospitalized patients. Additional research with larger sample sizes that includes patients and healthcare workers from multiple sites as well as the general community is needed.
In conclusion, this study demonstrates that substantial improvements in patient understanding of publicly reported data are possible using a simple visual method for presenting data and that alternative presentation methods are easily tested. Better presentation methods, developed using a design process that focuses on the user’s needs, are crucial to ensure that patients are able to understand information collected and published—often at great expense—by hospitals and government agencies.
ACKNOWLEDGMENTS
Potential conflicts of interest: D.J.M. discloses serving as a research consultant for Welch-Allyn, presenting a self-developed lecture for a 3M series on hospital infections, and receiving travel support for conferences from the Infectious Diseases Society of America (IDSA), the Society for Healthcare Epidemiology of America (SHEA), and the American Society for Microbiology (ASM). ll other authors report no conflicts of interest relevant to this article.
Financial support: This work was supported by the Agency for Healthcare Research and Quality (grant no. HS18111 to D.J.M.), the Veterans Administration Health Services Research and Development (grant no. CRE 12-289 to D.J.M), the Baltimore VA Medical Center Geriatrics Research, Education, and Clinical Center (J.D.S.), the National Institute on Aging at the National Institutes of Health (grant no. NIA 5 P30 AG028747 to J.D.S), the National Institute of Diabetes and Digestive and Kidney Diseases at the National institutes of Health (grant no. NIDDK 5 P30 DK072488 to J.D.S.), and the National Institutes of Health (grant no. 5 K24AI079040-05 to A.D.H.).
SUPPLEMENTARY MATERIAL
To view supplementary material for this article, please visit http://dx.doi.org/10.1017/ice.2016.180