Introduction
Illite originates largely from the weathering and alteration of other minerals such as mica and feldspar (Righi and Meunier, Reference Righi, Meunier and Velde1995); it is distributed widely in both topsoil and subsoil (Zhou et al., Reference Zhou, LaChance, Smith and Cheng2019), and has notable physical and chemical properties including porosity, small particle size, significant electrical insulation, good thermal stability, and non-expansiveness in water (Chen et al., Reference Chen, Yan, Yu, Shuang, Qin, Liu, Li and Du2016). Therefore, illite has broad applications in textiles, medicines, cosmetics (Hyeryeon et al., Reference Hyeryeon, Lee, Sung and Choi2021), in the manufacture of catalysts, in adsorption of radioactive elements (Zhang et al., Reference Zhang, Sutejo, Kim, Choi, Park and Yun2022), antibacterial functions, polymer composites, and crop growth (Kim et al., Reference Kim, Kim, Kwon, Lee, Woo, Park and Chung2010). All of these applications are related intrinsically to the atomic structure, electronic characteristics, and mechanical behavior of illite. Furthermore, pressure is a major factor influencing its performance in applied contexts (Irifune et al., Reference Irifune, Kawakami, Arimoto, Ohfuji, Kunimoto and Shinmei2016; Boneh et al., Reference Boneh, Pec and Hirth2023). Consequently, understanding the pressure dependence of the atomic structure, electronic properties, and elasticity of illite is very important for research in materials science, construction, and medical engineering.
Grim (Reference Grim1953) defined the general formula of illite as 2K2O·3MO·8R 2O3·24SiO2·H2O (R and M are used to represent the principal metal cations within the mineral lattice), which contained both dioctahedral and trioctahedral forms. The nomenclature committee of the Mineralogical Society of America (Bailey et al., Reference Bailey, Brindley, Fanning, Kodama and Martin1984) later defined the formula as K0.6–0.85Al2(Si,Al)4O10(OH)2 or K0.6–0.85(Al,Mg)2(Si,Al)4O10(OH)2. The structure of illite consists of a 2:1 (T-O-T) layered framework, formed by two silicate tetrahedral sheets sandwiching an aluminate octahedral sheet (Zoeller and Brockamp, Reference Zoeller and Brockamp1997), wherein partial substitution of Si by Al occurs. The octahedral layer has two distinct configurations, namely cis-vacant (cv) and trans-vacant (tv), with the tv type being more symmetric. Cations such as Al, Mg, or Fe within the octahedral sheet are coordinated with hydroxyl groups (Drits et al., Reference Drits, McCarty and Zviagina2006; Drits et al., Reference Drits, Zviagina, McCarty and Salyn2010). Adjacent layers are held together primarily through non-bonding interactions, including van der Waals and electrostatic forces and electrostatic attraction (Brigatti and Guggenheim, Reference Brigatti, Guggenheim, Mottana, Sassi, Thompson and Guggenheim2002). Significant statements about the temperature-dependent evolution of illite lattice parameters through high-temperature experiments combined with X-ray diffraction analysis of illite were made by Drits and McCarty (Reference Drits and McCarty2007). Drits et al. (Reference Drits, McCarty and Zviagina2006) proposed that the illite octahedron has two structures: cv and tv (cis-vacant and trans-vacant); the 1M and 2M 1 types of illite are the most common (Zviagina and Drits, Reference Zviagina and Drits2019). No structural phase transition was observed by Yun and Lee (Reference Yun and Lee2020) in natural illite up to 6.9 GPa using X-ray powder diffraction. The sheet-like distribution of layered silicate minerals was found by Vernik and Anantharamu (Reference Vernik and Anantharamu2020) to affect the elastic velocity and anisotropy of the shale significantly. The experimental findings above have provided essential resources for understanding the crystal structure of illite.
Research on the mechanical properties of illite have been facilitated by studies on structurally analogous phyllosilicates. The elastic properties of single crystals of talc, muscovite, phlogopite, and clinochlore were reported by Alexandrov and Ryshova (Reference Alexandrov and Ryshova1961). Close similarities in the elastic behavior of muscovite and illite, due to their structures and compositional affinity, were noted by Katahara (Reference Katahara1996). The elastic modulus and elastic wave velocity of illite and chlorite were derived by Wang et al. (Reference Wang, Wang and Cates2001) who inverted the properties of composite materials with known constituents.
However, the complex composition and fine-grained nature of illite make it challenging to obtain precise atomic-scale structural details and elastic parameters solely through experiments. At present, atomistic simulation calculation methods have emerged as a reliable tool for investigating silicate minerals at the microscopic level (Bridgeman, Reference Bridgeman1996; Refson et al., Reference Refson, Park and Sposito2003; Zartman et al., Reference Zartman, Liu, Akdim, Pachter and Heinz2010). First-principles calculation methods were used by Ortega et al. (Reference Ortega, Hernández, Hernández and Sainz2008) to discuss the charge balance between the two mixed ionic species. The 1M series of dioctahedral micas with various interlayer defects was modeled by Geatches et al. (Reference Geatches, McCarty and Wilcox2014) who analyzed the differences between cv/tv structures. First-principles calculations were performed by Gao et al. (Reference Gao, Zhao and He2023) on illite, analyzing the atomic and electronic structures. Elastic constants for muscovite and illite/mica were established by Militzer et al. (Reference Militzer, Wenk and Stackhouse2011) using first-principles calculations based on DFT. Molecular dynamics was used by Liang et al. (Reference Liang, Gao, Sun, Liu, Li and Wang2023) to study the elastic moduli of illite and quartz. First-principles calculation methods were used by Li (Reference Li2016) to study the changes in elastic constants and bulk modulus of 2:1 type layered silicate minerals (pyrophyllite and montmorillonite) in the pressure range of 0–20 GPa. While previous work has focused largely on the atomic structure and mechanical properties of illite at low pressures, few systematic investigations of its high-pressure behavior have been carried out. To address this gap, a detailed first-principles study of illite under pressures ranging from 0 to 20 GPa is presented here, examining its lattice parameters, average bond lengths, layer relaxations, band structures, charge distribution, density of states, elastic constants, and mechanical parameters.
Methods
First-principles calculations grounded in DFT (Kresse and Furthmuller, Reference Kresse and Furthmuller1996) within the Vienna Ab Initio Simulation Package (VASP) (Blöchl, Reference Blöchl1994) was employed to perform comprehensive analysis of the structural, electronic, and mechanical properties of illite under high pressures. The exchange correlation interactions were described using the Perdew-Burke-Ernzerhof (PBE) functional with the generalized gradient approximation (GGA). To account accurately for the weak interlayer interactions characteristic of layered minerals, the DFT-D3 empirical dispersion correction was applied. The electron configurations of the constituent atoms were treated with the following valence state: 1s1 for hydrogen, 2s22p4 for oxygen, 3s23p2 for silicon, 3s23p1 for aluminum, and 3s23p64s1 for potassium atoms, respectively. A plane wave kinetic energy cut-off of 420 electron volts (eV) was used, and Brillouin zone integration was performed using 3×3×3 Monkhorst-Pack k-point mesh (Monkhorst and Pack, Reference Monkhorst and Pack1976). Structural relaxations were performed until the Hellmann-Feynman forces on all atoms were <1×10⁻⁵ eV/Å.
Elastic constants are important parameters that express the fundamental mechanical response of a solid material. The present paper employed a stress-strain approach as implemented in VASP code to determine elastic constants (C
ij). The elastic tensor was obtained by applying controlled finite distortions to the lattice structure and subsequently extracting the elastic constants through rigorous analysis of the resulting stress-strain relationship. For the monoclinic crystal system of illite (space group C2/m) as shown in Fig. 1, there are 13 independent elastic constants: C
11, C
22, C
33, C
44, C
55, C
66, C
12, C
13, C
15, C
23, C
25, C
35, and C
46. A set of finite homogeneous deformations was applied to the equilibrium lattice, with strain amplitudes varying systematically from –0.03 to 0.03 in increments of 0.006 (Chung and Buessem, Reference Chung and Buessem1967). The resulting stress tensors were analyzed to derive the full elastic constant matrix. For each strained configuration, the internal atomic positions were fully relaxed while keeping the lattice shape fixed, until the residual forces were <0.01 eV/Å and the total energy converged within 10–4 eV. All calculations were performed in the global Cartesian coordinate system. The illite model retains its intrinsic monoclinic lattice without additional rotation or transformation; thus, the crystallographic axes a, b, and c preserve the orientation defined by the input lattice matrix. Based on the elastic constants, the bulk modulus (B) and shear modulus (G) (Hill, Reference Hill1952) can be calculated from the Voigt-Reuss-Hill approximation. The calculation formulae were defined as
$ {B}_{\mathrm{H}}=1/2\Big({B}_{\mathrm{V}} $
 +
$ {B}_{\mathrm{R}}\Big) $
 ,
$ {G}_{\mathrm{H}}=1/2\left({G}_{\mathrm{V}}+{G}_{\mathrm{R}}\right) $
 . The subscripts H, V, and R denote the Hill, Voigt, and Reuss averages, respectively. Young’s modulus, E, and Poisson’s ratio, μ, can be calculated from B and G using the standard isotropic relations
$ E=9B\times G/\left(3B+G\right) $
 ,
$ \mu =\left(3B-2G\right)/\left[2\left(B+G\right)\right] $
 . The compressive wave velocity (νp) and shear wave velocity (νs) were derived from the elastic moduli and the density:
$ {v}_P=\sqrt{3B+4G/3\rho } $
 ,
$ {v}_s=\sqrt{G/\rho \hskip2pt } $
 (Weck et al., Reference Weck, Kim and Jove-Colon2015).
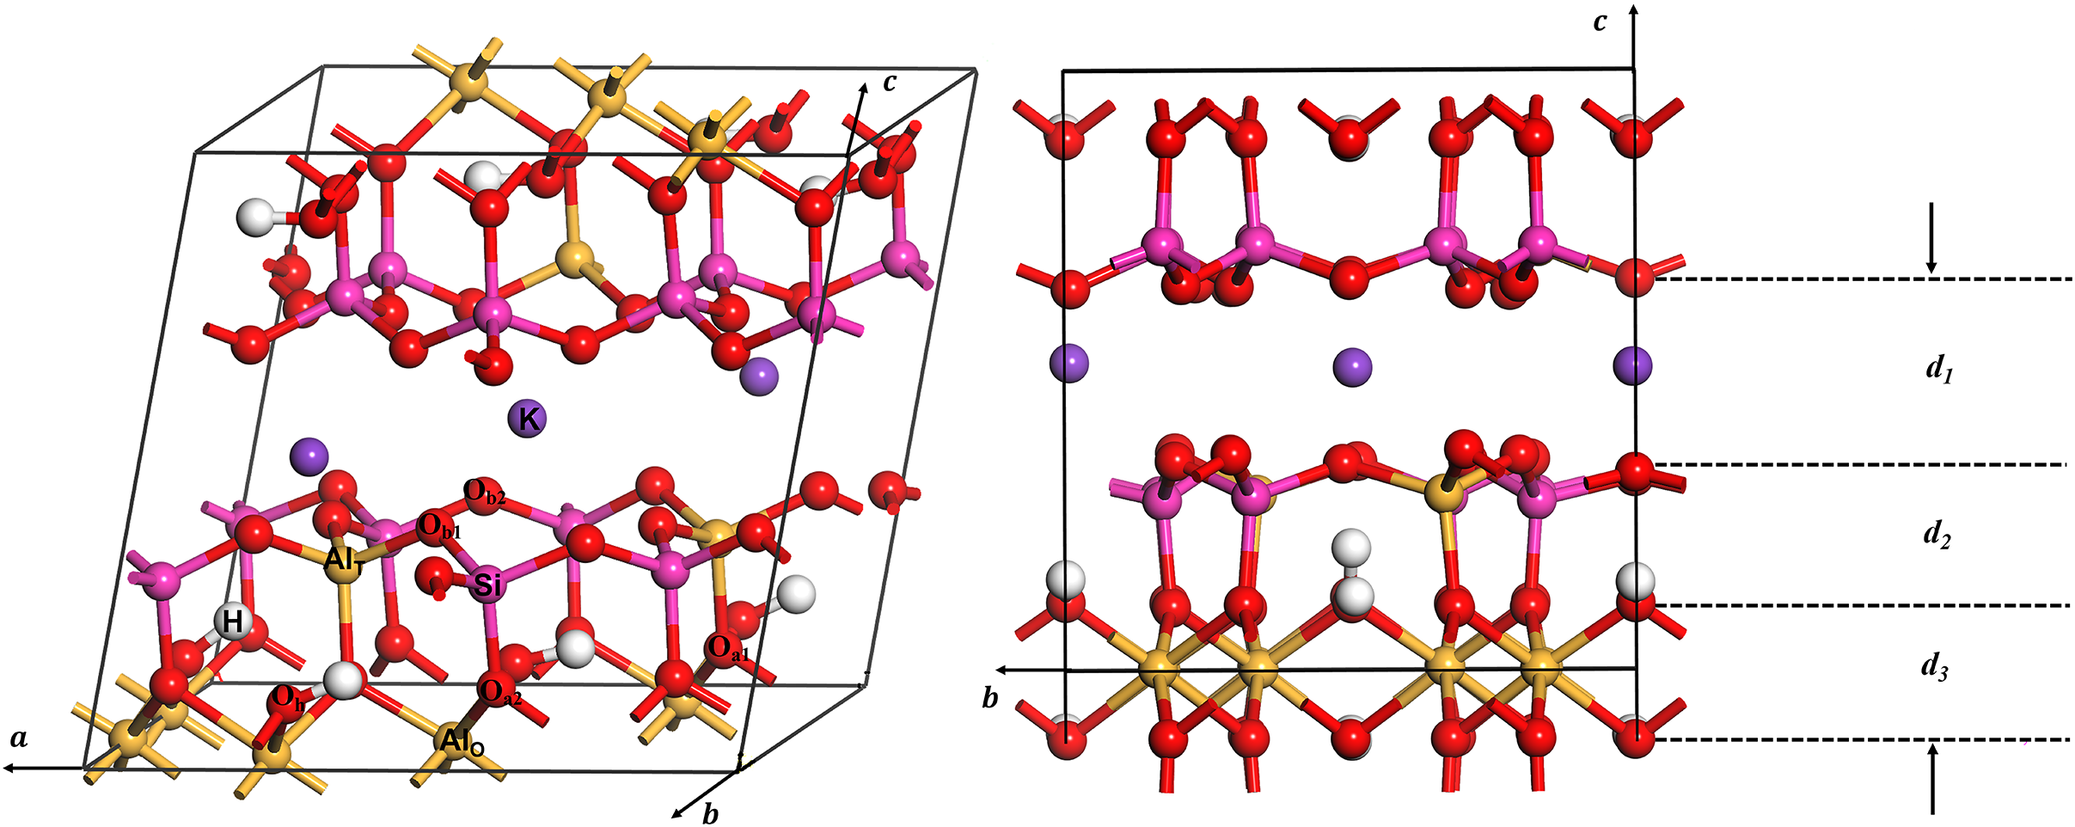
The unit cell of illite K3Al8(Si13Al3)O40(OH)8. White spheres = hydrogen; red spheres = oxygen; yellow spheres = aluminum; pink spheres = silicon; purple spheres = potassium.

Figure 1. Long description
The image consists of two panels.
Left panel: A three-dimensional perspective of the illite unit cell within a rhombohedral frame defined by axes a, b, and c. The structure is layered. The bottom layer contains yellow aluminum spheres and red oxygen spheres. Above this is a tetrahedral sheet of pink silicon and red oxygen spheres. A central interlayer space contains large purple potassium spheres labeled K. Above the potassium layer, the tetrahedral and octahedral sheets repeat in reverse order. Small white hydrogen spheres are scattered near the oxygen atoms.
Right panel: A two-dimensional side view along the b and c axes. Horizontal dashed lines define three vertical distances.
- d sub 1 represents the wide interlayer spacing containing the purple potassium ions.
- d sub 2 represents the thickness of the tetrahedral-octahedral-tetrahedral layer, showing the arrangement of pink silicon, yellow aluminum, and red oxygen spheres.
- d sub 3 represents the distance between the base oxygen atoms and the central octahedral aluminum plane.
Specific atoms are labeled with chemical symbols: H for hydrogen, O for oxygen, Al for aluminum, Si for silicon, and K for potassium.
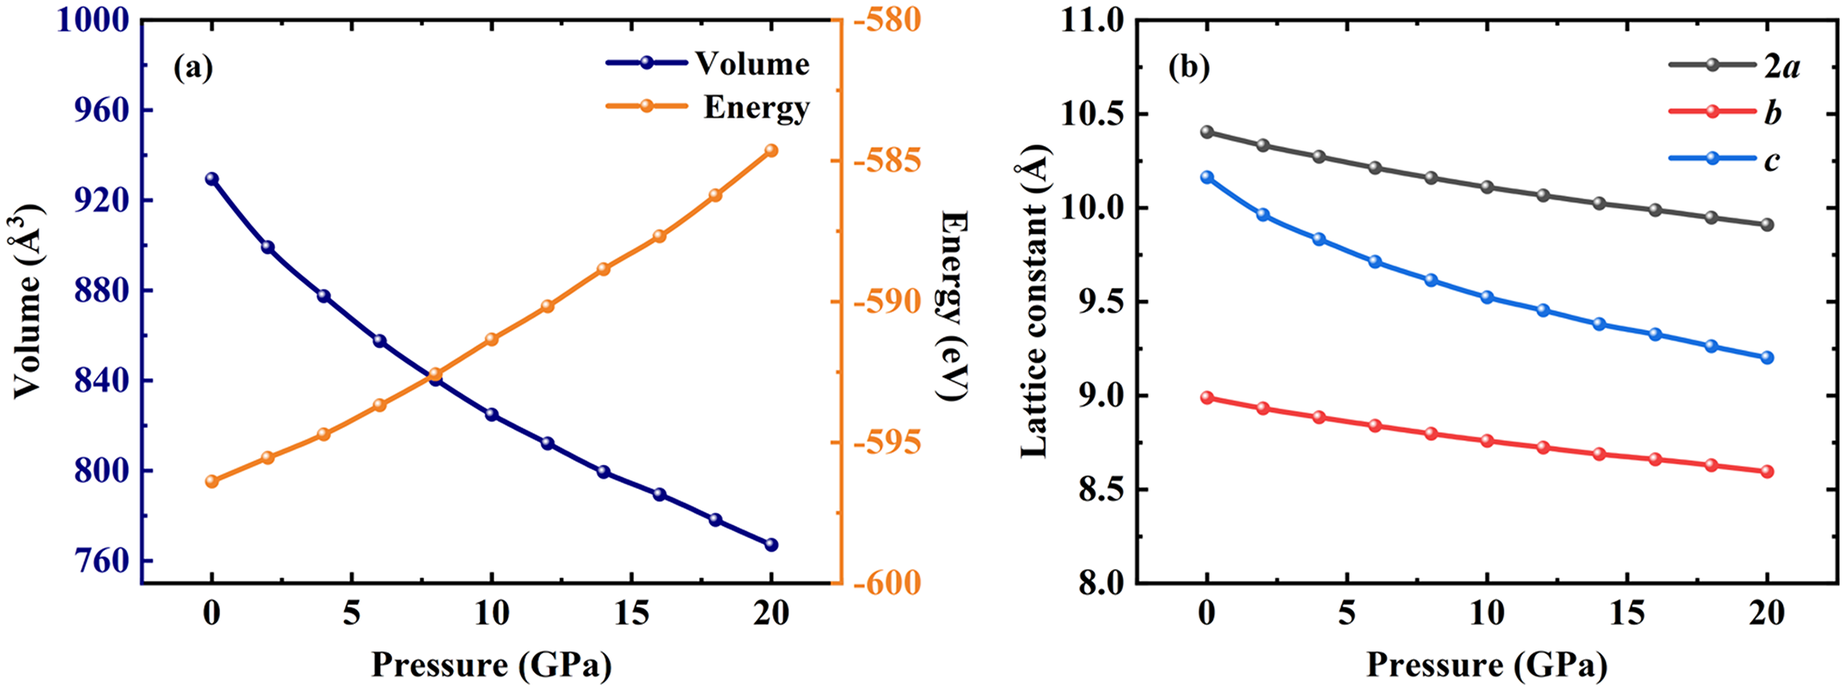
To avoid spurious contributions from Pulay stress, structural relaxations were performed using a volume-constrained optimization approach rather than direct pressure-controlled relaxation. The structure was first computed for a series of unit-cell volumes around V 0 (the equilibrium volume in static condition), selected to sample the compression regime relevant to pressure up to ~20 GPa. For each prescribed volume, V i, the total energy E (V i) at 0 K was computed. The resulting energy-volume (E-V) database was fitted with a quadratic equation of state (orange curve in Fig. 2a), from which the pressure–volume relation was derived via the thermodynamic expression P=−∆E/∆V (Chang et al., Reference Chang, Zhou, Zhao and Wang2013; Zhang and Shi, Reference Zhang and Shi2018). Using the fitted relation, the specific volumes corresponding to target pressures from 0 to 20 GPa in 2 GPa increments were determined (blue curve in Fig. 2a). All subsequent structural, electronic, and mechanical property calculations were then conducted at these volume-fixed conditions.
(a) Functional relationship of energy vs volume and pressure vs volume. (b) Functional relationship of the lattice constants vs pressures.

Figure 2. Long description
Panel a. A dual-axis line graph. The X axis represents Pressure in G P a from 0 to 20. The left Y axis represents Volume in angstroms cubed from 760 to 1000. The right Y axis represents Energy in e V from minus 600 to minus 580. A dark blue line with circular markers shows Volume decreasing from approximately 930 to 765 in a curved decay. An orange line with circular markers shows Energy increasing from approximately minus 597 to minus 584 in a near-linear upward trend. The lines intersect at approximately 8 G P a.
Panel b. A line graph with Pressure in G P a on the X axis from 0 to 20 and Lattice constant in angstroms on the Y axis from 8.0 to 11.0. Three data series are shown. The top series, labeled 2 a in black, shows a linear decrease from 10.4 to 9.9. The middle series, labeled c in blue, shows a curved decrease from 10.2 to 9.2. The bottom series, labeled b in red, shows a slight linear decrease from 9.0 to 8.6.
Results and Discussion
Pressure-dependent evolution of the atomic structure of illite
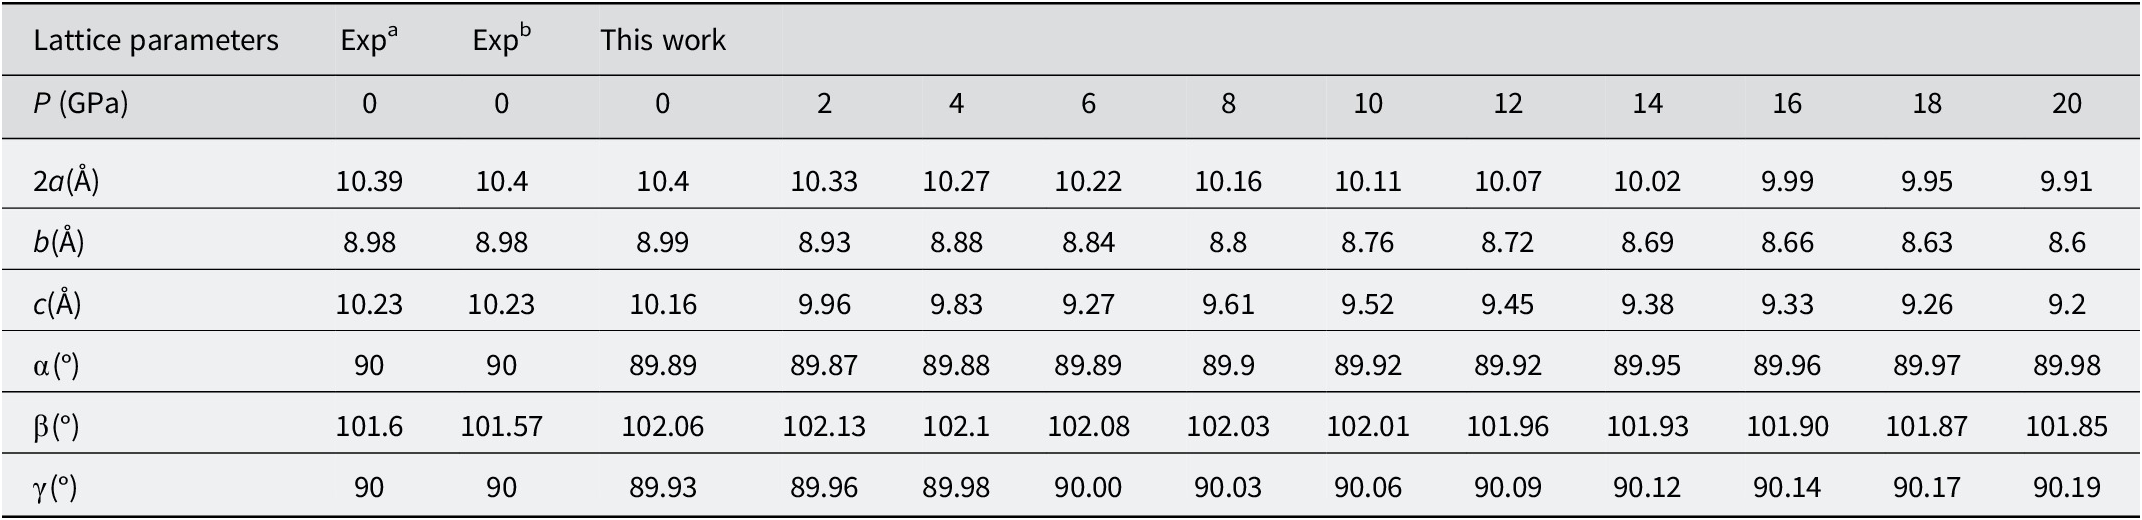
Illite is a 2:1 layered aluminosilicate mineral, characterized by a structure where one aluminum-oxygen octahedral sheet is sandwiched between two silicon-oxygen tetrahedral sheets. Within these sheets, tetrahedra are connected by sharing three corners to form a hexagonal network, with the remaining apical oxygen atoms bridging to the adjacent octahedral sheet. The composite layers are bound primarily by a mix of van der Waals and coulombic (electrostatic) interactions (Brigatti and Guggenheim, Reference Brigatti, Guggenheim, Mottana, Sassi, Thompson and Guggenheim2002; Ulian and Valdrè, Reference Ulian and Valdrè2023). The general chemical formula for illite is K xAl2(Si4–x Al x)10(OH)2, where the composition parameter x (typically ranging from 0.6 to 0.8) satisfies the required layer-charge balance resulting from lattice substitution. Based on the RM30 sample (Drits et al., Reference Drits, Zviagina, McCarty and Salyn2010) and the composition K0.75Al2(Si3.25Al0.75)10O10(OH)2 reported by Gao et al. (Reference Gao, Zhao and He2023), the unit cell of aluminum-rich illite was established during the present study, which consisted of 8 H, 48 O, 11 Al, 13 Si, and 3 K atoms. As shown in Fig. 1a, the optimized unit cell of illite which consisted of a trans-vacant dioctahedral 1M polytype structure and three K ions were introduced in the interlayer to maintain charge neutrality (Gao et al., Reference Gao, Zhao and He2023). After relaxation, the lattice parameters of Al-rich illite at P=0 GPa were 2a=10.4 Å, b=8.99 Å, c=10.15 Å, α=89.89°, β=102.06°, and γ=89.93°, respectively (Table 1), showing good consistency with available experimental data and previous computational results (Eberl et al., Reference Eberl, Środoń, Lee, Nadeau and Northrop1987; Drits et al., Reference Drits, McCarty and Zviagina2006). Following structural optimization, the illite was subjected to high-pressure conditions. The energy-volume data were fitted using a second-order polynomial (orange curve in Fig. 2a). The corresponding pressure-volume relationship was represented by the blue curve in Fig. 2a. As illustrated in Fig. 2a, the total energy of illite increased monotonically with decreasing volume. Consistently, the P-V curve showed that pressure increased as the volume was reduced.
The lattice parameters of illite under pressures; for comparison, results from work by other researchers are also listed

Table 1. Long description
The table consists of 14 columns and 7 rows.
Row 1 (Headers): Lattice parameters, Exp super a (at 0 G P a), Exp super b (at 0 G P a), and ‘This work’ spanning pressures from 0 to 20 G P a in increments of 2 G P a.
Row 2 (Pressure P in G P a): 0, 0, 0, 2, 4, 6, 8, 10, 12, 14, 16, 18, 20.
Row 3 (a in Angstroms): Values decrease from 10.4 at 0 G P a to 9.91 at 20 G P a. Experimental values at 0 G P a are 10.39 and 10.4.
Row 4 (b in Angstroms): Values decrease from 8.99 at 0 G P a to 8.6 at 20 G P a. Experimental values at 0 G P a are both 8.98.
Row 5 (c in Angstroms): Values decrease from 10.16 at 0 G P a to 9.2 at 20 G P a. Experimental values at 0 G P a are both 10.23.
Row 6 (alpha in degrees): Values remain near 90 degrees, slightly increasing from 89.89 at 0 G P a to 89.98 at 20 G P a. Experimental values at 0 G P a are 90.
Row 7 (beta in degrees): Values decrease from 102.06 at 0 G P a to 101.85 at 20 G P a. Experimental values at 0 G P a are 101.6 and 101.57.
Row 8 (gamma in degrees): Values increase from 89.93 at 0 G P a to 90.19 at 20 G P a. Experimental values at 0 G P a are 90.
Expa, Eberl, D.D., Srodon, J., Lee, M., Nadeau, P.H., & Northrop, H.R. (Reference Eberl, Środoń, Lee, Nadeau and Northrop1987). Sericite from the Silverton Caldera, Colorado; correlation among structure, composition, origin, and particle thickness. American Mineralogist, 72, 914–934.
Expb, Drits, V.A., Zviagina, B.B., McCarty, D.K., & Salyn, A.L. (Reference Drits, Zviagina, McCarty and Salyn2010) Factors responsible for crystal-chemical variations in the solid solutions from illite to aluminoceladonite and from glauconite to celadonite. American Mineralogist, 95, 348–361.
Meanwhile, the pressure dependence of the lattice constants were listed in Table 1 and plotted in Fig. 2b. The lattice constants 2a, b, and c of illite decreased monotonically with increasing pressure. The compressibility was greatest along the c-axis, indicating that the structure was more easily compressed perpendicular to the layers than within the (001) plane. In contrast, the angles α, β, and γ showed negligible change across the studied pressure range. The above results implied that the structural response of illite to pressure is predominantly anisotropic, with the most significant deformation occurring normal to the (001) planes.
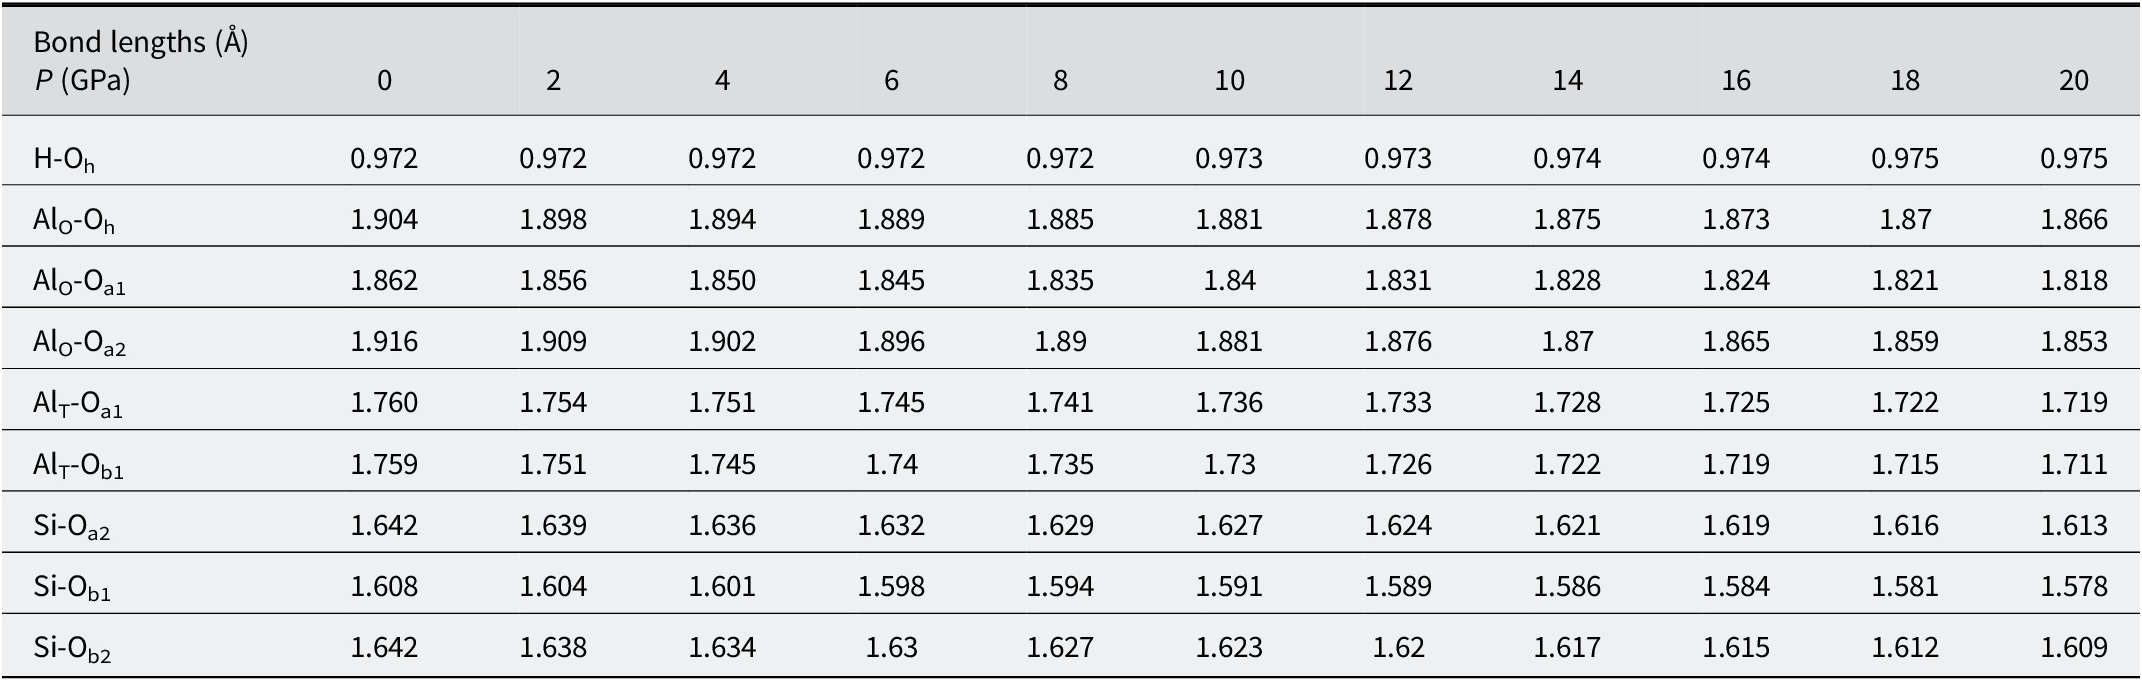
The main bond lengths at various pressures are listed in Table 2. Based on the differences in bonding between oxygen and the other atoms, oxygen atoms were mainly categorized into five types: Oh denoting oxygen in the hydroxyl group of the octahedral sheet; Oa1 representing oxygen shared by the Al-O tetrahedron and the Al-O octahedron; Oa2 referring to oxygen shared by the Si-O tetrahedron and the Al-O octahedron; Ob1 oxygen bridging Si and Al within the tetrahedral sheet; and Ob2 corresponding to oxygen connecting two silicon atoms. Aluminum atoms were divided into two types: AlO in the octahedral sheet and AlT substituting for Si in the tetrahedral sheet. As listed in Table 2, the bond length of Oh–H was 0.972 Å, consistent with the characteristic bond length of an isolated water molecule. Within the tetrahedral sheet, the AlT–Oa1 and AlT–Ob1 bonds were shorter than the AlO–Oh, AlO–Oa2, and AlO–Oa1 bonds in the octahedral sheet. All Al–O bonds exceeded Si–O bond lengths in the tetrahedral sheet, indicating weaker bonding in the octahedral layer compared with the tetrahedral layer. With increasing pressure, the bond lengths of the five types of Al–O and the two types of Si–O of illite decreased, whereas the H–Oh bond length increased slightly. The changes in Al–O bond lengths were 2.0%, 2.36%, and 3.29% for the three octahedral types, and 2.33% and 2.73% for the two tetrahedral Al–O bonds. The Si–O bond lengths decreased by 1.77%, 1.87%, and 2.01%, respectively. In contrast, the H–O bond length changed by <0.30%. Consequently, the findings suggest that pressure-induced contraction of Al–O and Si–O bonds is a primary factor governing the volumetric compression of illite.
The bond lengths (Å) in optimized structures of illite under pressures (GPa)

Table 2. Long description
The graph plots bond lengths in Angstroms against pressure P in G P A from 0 to 20.
* H hyphen O sub h: Shows a nearly constant trend with a very slight linear increase from 0.972 at 0 G P A to 0.975 at 20 G P A.
* Al sub O hyphen O sub h: Shows a linear decrease from 1.904 at 0 G P A to 1.866 at 20 G P A.
* Al sub O hyphen O sub a 1: Shows a linear decrease from 1.862 at 0 G P A to 1.818 at 20 G P A.
* Al sub O hyphen O sub a 2: Shows a linear decrease from 1.916 at 0 G P A to 1.853 at 20 G P A.
* Al sub T hyphen O sub a 1: Shows a linear decrease from 1.760 at 0 G P A to 1.719 at 20 G P A.
* Al sub T hyphen O sub b 1: Shows a linear decrease from 1.759 at 0 G P A to 1.711 at 20 G P A.
* Si hyphen O sub a 2: Shows a linear decrease from 1.642 at 0 G P A to 1.613 at 20 G P A.
* Si hyphen O sub b 1: Shows a linear decrease from 1.608 at 0 G P A to 1.578 at 20 G P A.
* Si hyphen O sub b 2: Shows a linear decrease from 1.642 at 0 G P A to 1.609 at 20 G P A.
Overall, all bond lengths except for H hyphen O sub h exhibit a consistent linear decrease as pressure increases.
The calculated average interlayer spacings of illite under pressure are shown in Table 3. As illustrated in Fig. 1b, d 1 corresponds to the interlayer region containing cations; d 2 represents the thickness of the tetrahedral sheet; and d 3 denotes the thickness of the octahedral sheet. Under increasing pressure, the values of d 1, d 2, and d 3 decreased by 21.72%, 4.05%, and 4.55%, respectively. The calculation data revealed that pressure-induced volumetric contraction of illite arises predominantly from the reduction of the interlayer distance, d 1.
The calculated the actual TOT interlayer distance (d 1), the thickness of the tetrahedral sheets (d 2), and the octahedral sheet (d 3) of illite under pressures

Table 3. Long description
The table displays three distance measurements in Angstroms across a pressure range of 0 to 20 G P A in increments of 2.
* d sub 1, the T O T interlayer distance, shows a significant non-linear decrease from 3.347 at 0 G P A to 2.62 at 20 G P A.
* d sub 2, the thickness of the tetrahedral sheets, shows a slight linear decrease from 2.247 at 0 G P A to 2.156 at 20 G P A.
* d sub 3, the thickness of the octahedral sheet, shows a gradual and slightly fluctuating decrease from 2.02 at 0 G P A to 1.928 at 20 G P A.
Specific data points for d sub 1 include 3.347, 3.169, 3.069, 2.982, 2.902, 2.837, 2.787, 2.724, 2.701, 2.66, and 2.62.
Specific data points for d sub 2 include 2.247, 2.237, 2.227, 2.217, 2.207, 2.197, 2.189, 2.179, 2.173, 2.164, and 2.156.
Specific data points for d sub 3 include 2.02, 2.02, 2.0, 2.01, 1.98, 1.998, 1.962, 1.97, 1.946, 1.952, and 1.928.
Pressure-dependent evolution of the electronic structure of illite
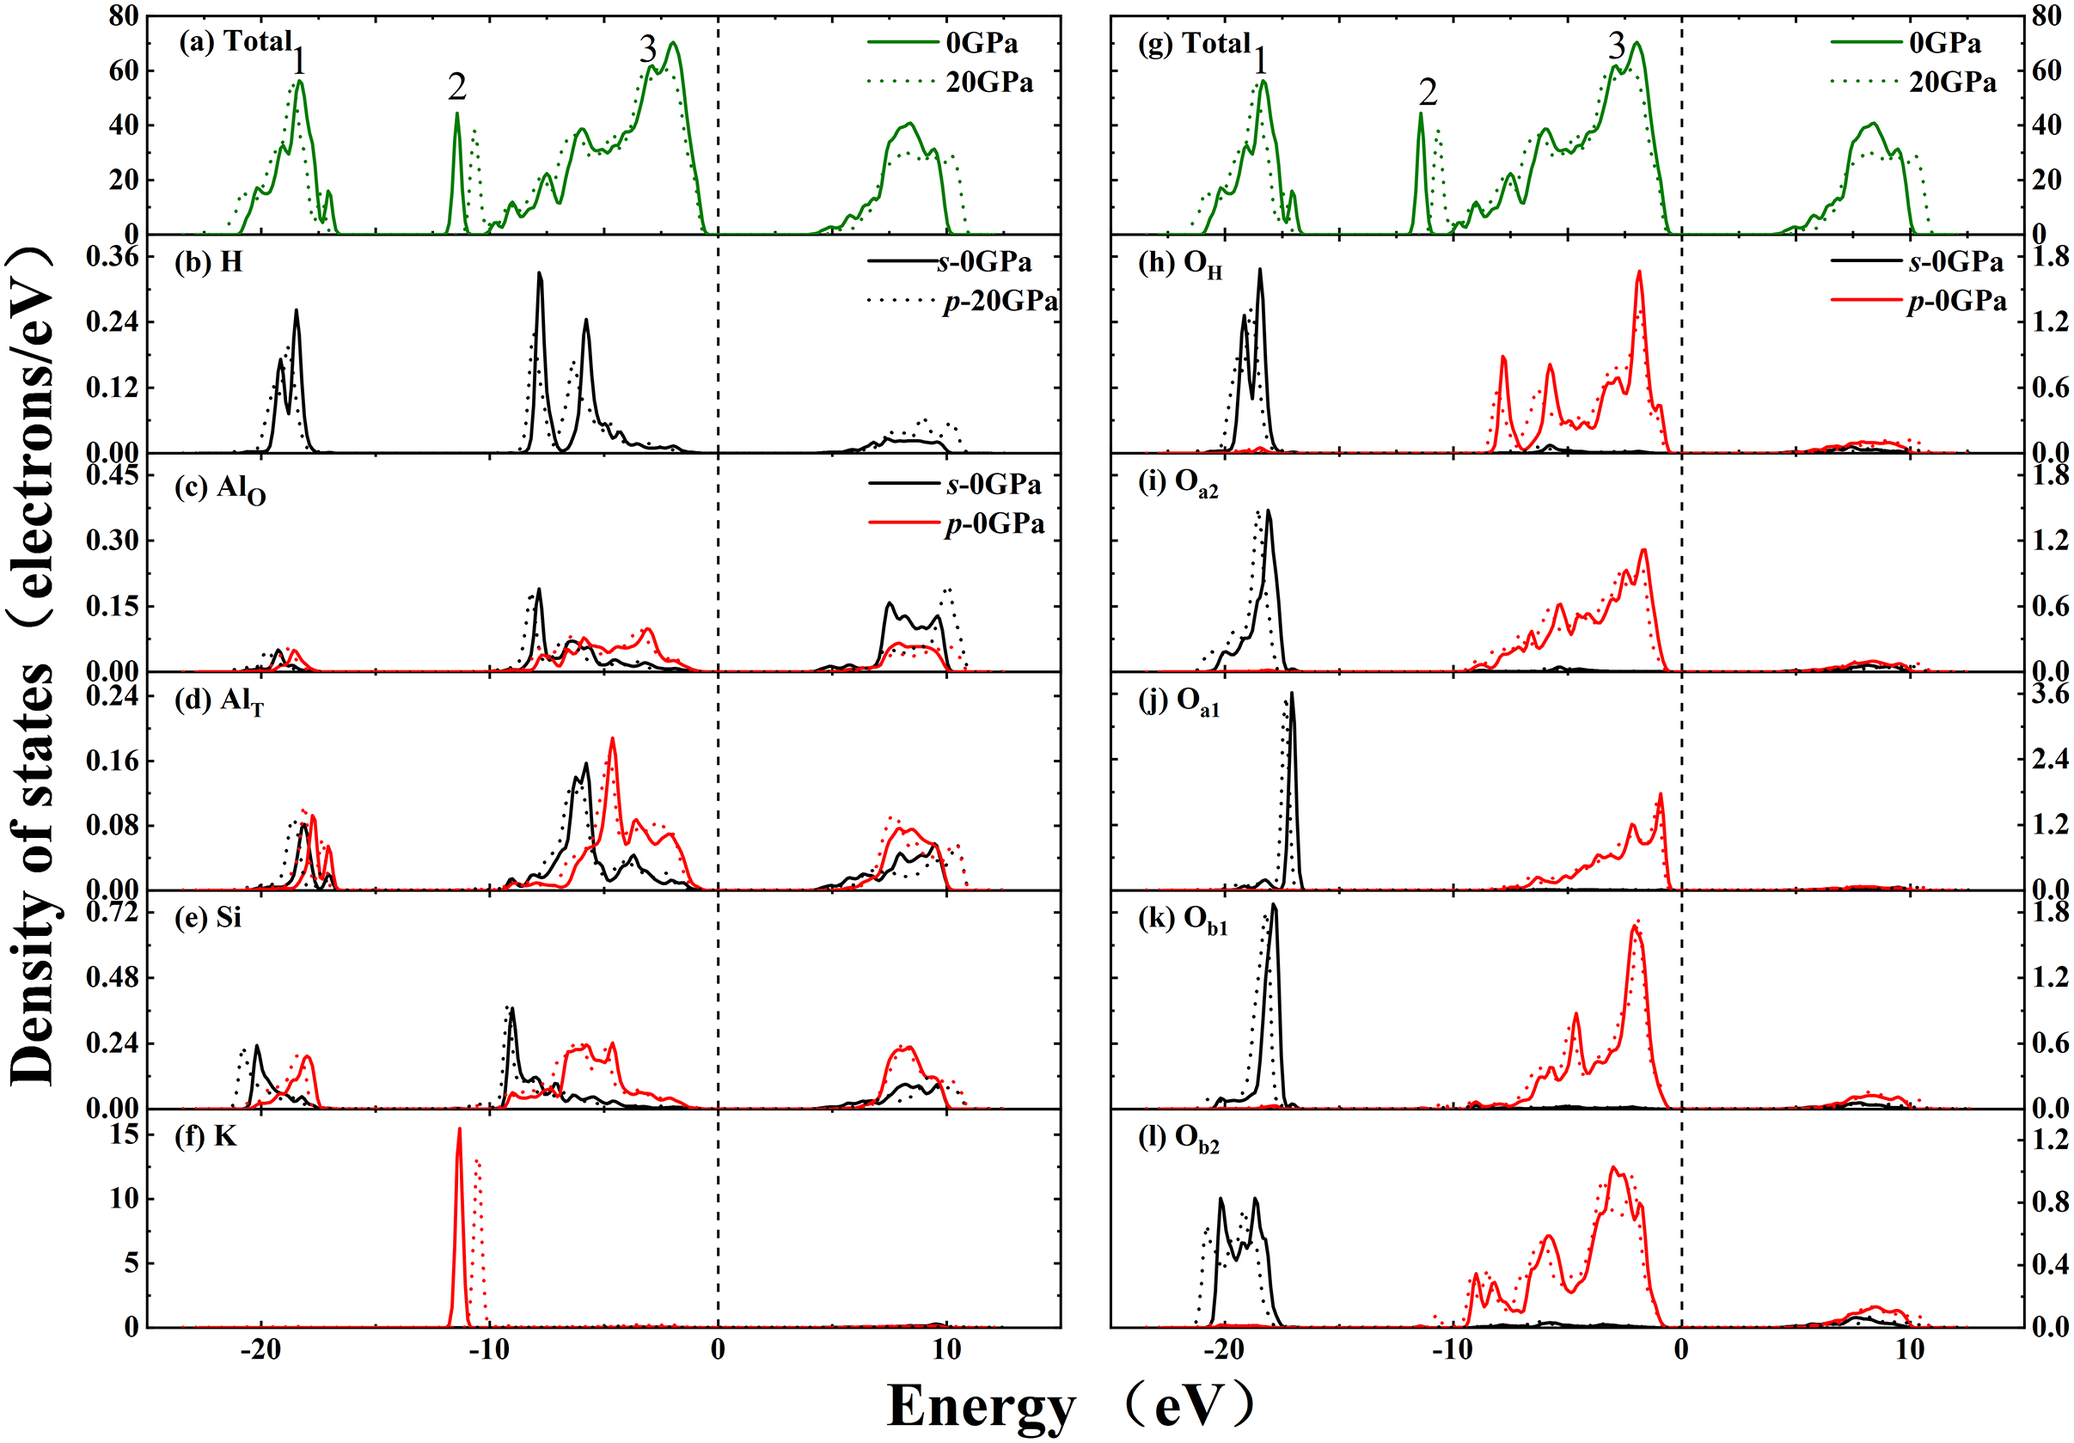
To investigate the pressure-induced evolution of the electronic characteristics of illite comprehensively, systematic calculations were performed for the total and partial density of states (TDOS and PDOS), charge density distribution, and band structure. The results obtained for pressures between 0 and 20 GPa are shown in Figs 3, 4, and 5. Figure 3 is a plot of the electronic density of states, including both TDOS and PDOS of illite at 0 and 20 GPa. The TDOS curves at pressures of 0 and 20 GPa (Fig. 3a, and offset for clarity, Fig. 3g) exhibited three prominent peaks labeled 1–3, with the Fermi level set at 0 eV. Peak 2 was contributed entirely by the 3p orbital of K atoms. Peak 1 was contributed mainly by the 2s orbital of O and partially derived from H, Si, and K atoms. In comparison, peak 3 was dominated by the 2p states of O atoms. The energy ranges from 0 to 15 eV and was mainly contributed by the s/p states of Si, O, and Al atoms. As shown in the TDOS curves of illite, the effects of pressures on the TDOS of illite were slightly different. The PDOS of the Al, Si, O, K, and H atoms of illite at 0 and 20 GPa are also shown in Fig. 3. As shown in Fig. 3h–l, the PDOS of the five distinct oxygen types were similar. Compared with Si atoms, the substituted AlT atoms exhibited a different hybridization pattern with neighboring O atoms, as shown in Fig. 3d–e and 3h–k. Obviously, the hybridization between Si 3p and adjacent O 2p states was significantly greater than that between AlT 3p and adjacent O 2p states. With increasing pressure to 20 GPa, peaks 1 and 3 shifted slightly to higher energy, while peak 2 shifted slightly to lower energy. According to the PDOS analysis, the downward shift of peak 2 was mainly from a decrease in the energy of the p orbital of K atoms below 0 eV under pressure. The upward shifts of peaks 1 and 3 were attributed to the increased energy of the O, H, Si, and Al atoms with the valence band. All orbital energy changes remained within 1 eV, proving that pressure had only a minor effect on the density of states of illite.
The total and partial density of states at 0 and 20 GPa.

Figure 3. Long description
The figure consists of two columns of six stacked line graphs. The x-axis for all panels represents Energy in e V, ranging from -25 to 15, with a vertical dashed line at 0 e V. The y-axis represents Density of states in electrons forward slash e V.
Left Column:
* Panel a Total: Shows green solid (0 G Pa) and dotted (20 G Pa) lines with three major peaks labeled 1, 2, and 3 between -20 and 0 e V.
* Panel b H: Displays s-0 G Pa (solid black) and p-20 G Pa (dotted black) orbital contributions.
* Panel c Al sub O: Compares s-0 G Pa (black) and p-0 G Pa (red) states.
* Panel d Al sub T: Shows overlapping s and p states with multiple peaks between -20 and 10 e V.
* Panel e Si: Displays s and p orbital density with a prominent peak near -10 e V.
* Panel f K: Features a sharp, narrow peak near -11 e V for 0 G Pa (solid red) which shifts slightly right for 20 G Pa (dotted red).
Right Column:
* Panel g Total: Identical to panel a, providing a reference for the right-side partial states.
* Panels h through l (O sub H, O sub a2, O sub a1, O sub b1, O sub b2): These panels show the oxygen orbital contributions. Most exhibit a distinct peak between -20 and -15 e V and a broad distribution of p-states (red lines) between -10 and 0 e V. Under 20 G Pa pressure, peaks generally shift toward higher energy levels and show broadening.
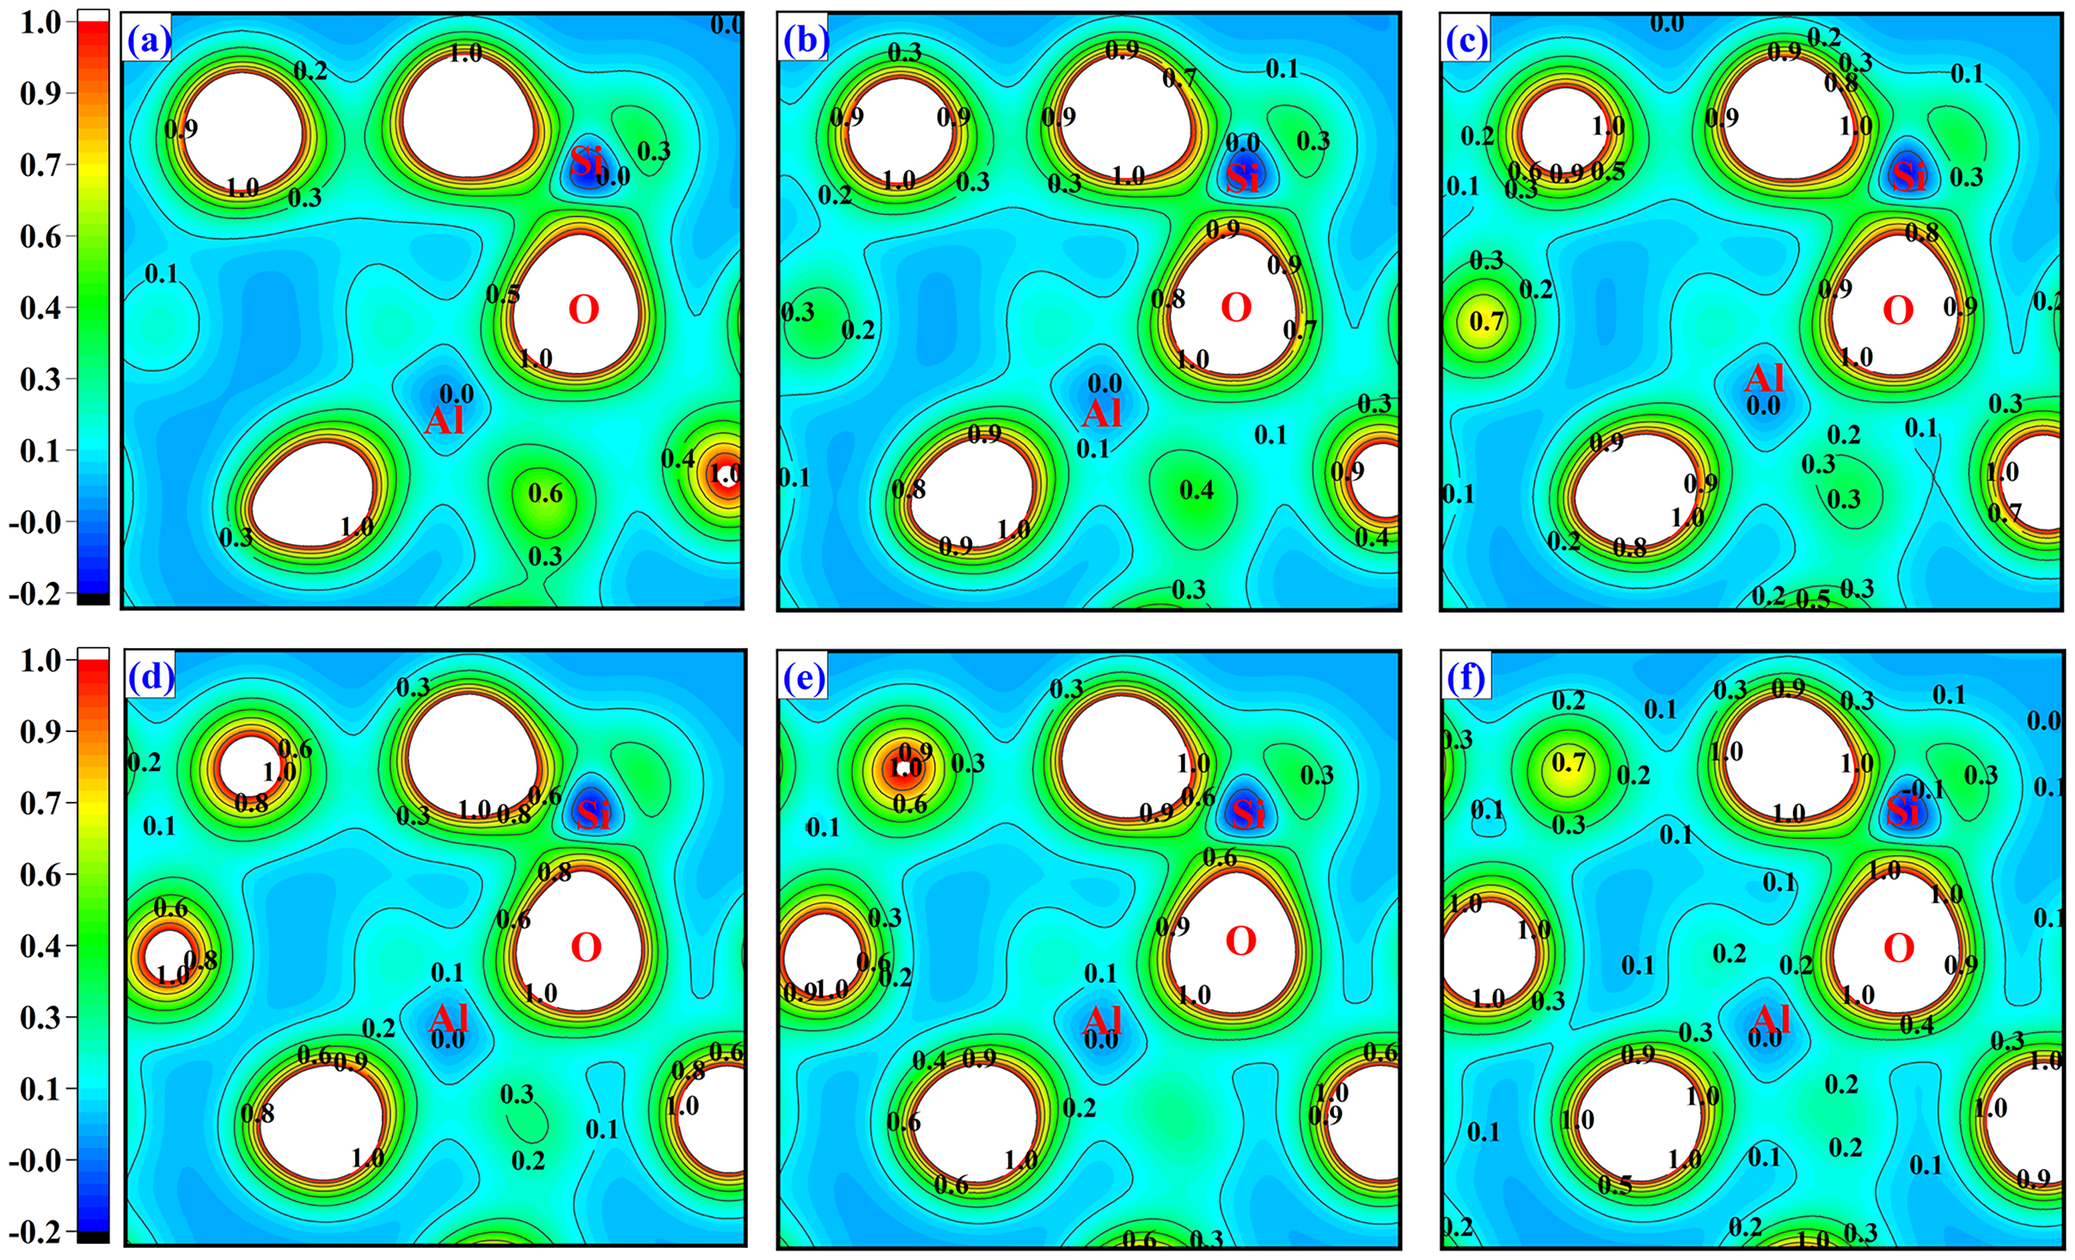
The charge density distribution of illite at: (a) 0 GPa, (b) 4 GPa, (c) 8 GPa, (d) 12 GPa, (e) 16 GPa, and (f) 20 GPa, respectively.

Figure 4. Long description
A multi-panel set of contour maps labeled a through f. A vertical color scale on the left of each row ranges from negative 0.2 in black and blue to 1.0 in red and white.
* Panel a at 0 G P a: Shows large white circular regions representing atomic cores. S i, O, and A l atoms are labeled. S i is surrounded by a tight gradient reaching 1.0. O is surrounded by a broader gradient. A l is located in a low-density blue region labeled 0.0.
* Panel b at 4 G P a and Panel c at 8 G P a: The contour lines begin to compress and shift. The green regions representing moderate density (0.4 to 0.7) expand slightly around the O and S i centers.
* Panel d at 12 G P a and Panel e at 16 G P a: The white core regions for S i and O shrink as the surrounding density gradients become steeper. New localized density peaks appear as small yellow and red circles.
* Panel f at 20 G P a: The distribution shows significant compression. The area around the A l atom remains at a low density of 0.0 to 0.1, while the gradients around O and S i are highly concentrated with numerous concentric contour lines labeled from 0.1 up to 1.0.
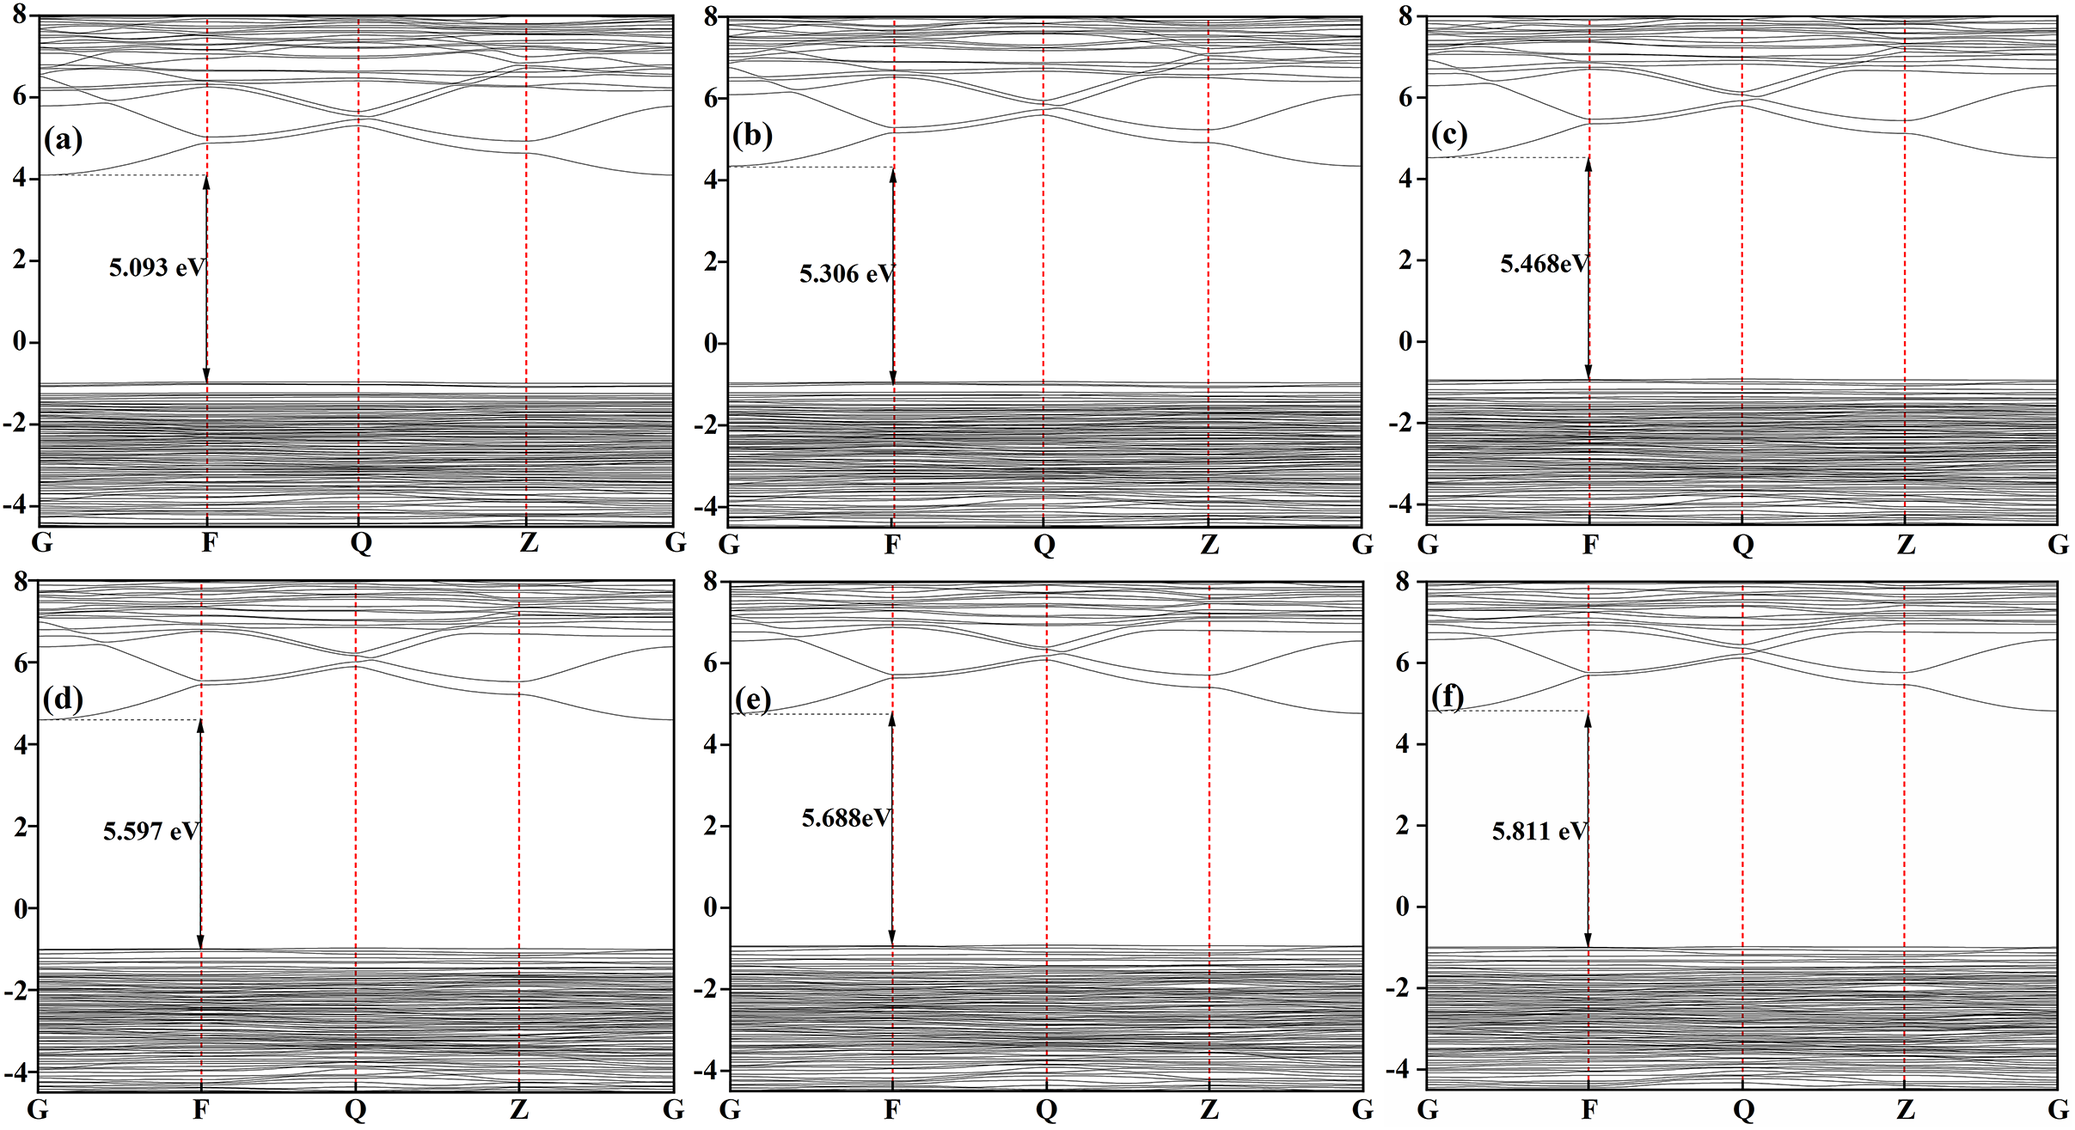
The band structure at: (a) 0 GPa, (b) 4 GPa, (c) 8 GPa, (d) 12 GPa, (e) 16 GPa, and (f) 20 GPa, respectively.

Figure 5. Long description
A set of six panels labeled a through f arranged in a two-by-three grid. Each panel is a line graph with an x-axis showing high-symmetry points G, F, Q, Z, and G, and a y-axis representing energy in e V ranging from minus 4 to 8.
In all panels, a dense set of horizontal valence bands is concentrated below 0 e V, while a sparser set of conduction bands curves above 4 e V. A vertical double-headed arrow at the F symmetry point measures the energy gap between the highest valence band and the lowest conduction band.
* Panel a at 0 G P a shows a band gap of 5.093 e V.
* Panel b at 4 G P a shows a band gap of 5.306 e V.
* Panel c at 8 G P a shows a band gap of 5.468 e V.
* Panel d at 12 G P a shows a band gap of 5.597 e V.
* Panel e at 16 G P a shows a band gap of 5.688 e V.
* Panel f at 20 G P a shows a band gap of 5.811 e V.
The trend across the panels shows that as pressure increases from 0 to 20 G P a, the conduction bands shift upward, resulting in a linear increase in the band gap value.
To elucidate the bonding characteristics and atomic charge distribution in illite, the charge density on the Al-O-Si plane under various pressures is shown in Fig. 4. The overlapping charge density regions between Si–O and Al–O bonds indicated covalent bonding characteristics, as shown in Fig. 4a–f. The charge density around the O atoms was obviously greater than around the Al atom, suggesting that electrons transferred from Al to O and reflecting a partially ionic character of the Al–O bond. In contrast, the charge density distribution between Si–O bonds was more uniform and concentrated, consistent with a predominantly covalent bond formed through electron sharing. The above results showed that Si–O bonds were stronger than Al–O bonds, further supporting the greater stability of the silicon-oxygen tetrahedron compared with the aluminium-oxygen octahedron. In the pressure range 0≤P≤20 GPa, the enhanced electron density overlap between Si-O relative to Al-O indicated stronger covalent bonding in Si-O pairs of illite. As shown in Fig. 4, the overlapping charge density between Al (Si) and O atoms did not change obviously with pressure, indicating that the bonding nature in illite was only marginally influenced by pressure within the present range.
The energy band structures of Al-rich illite under various pressures are shown in Fig. 5. The high symmetry points in the Brillouin zone were G (0, 0, 0), F (0, 0.5, 0), Q (0, 0.5, 0.5) and Z (0, 0, 0.5), with the Fermi level set to 0 eV. As shown in Fig. 5, the valence band maximum of illite is located at the F point, while the conduction band minimum resided at the G point. At ambient pressure (0 PGa), the calculated band gap was 5.093 eV. With increasing pressure, the band gap increased gradually, thereby further suppressing the promotion of valence electrons into conduction states. Given its characteristic bandgap energy range (3–6 eV), illite retained insulating behavior across the pressure range of 0–20 GPa. Note that the band gaps reported here were obtained using the GGA/PBE functional. As widely recognized in prior DFT studies, this approach tends to under-estimate absolute bandgap values. Thus, the bandgaps presented here should be interpreted as lower bounds of the true electronic gap; nevertheless, the pressure-induced trends and relative variations remain reliable.
Pressure-dependent evolution of mechanical properties of illite
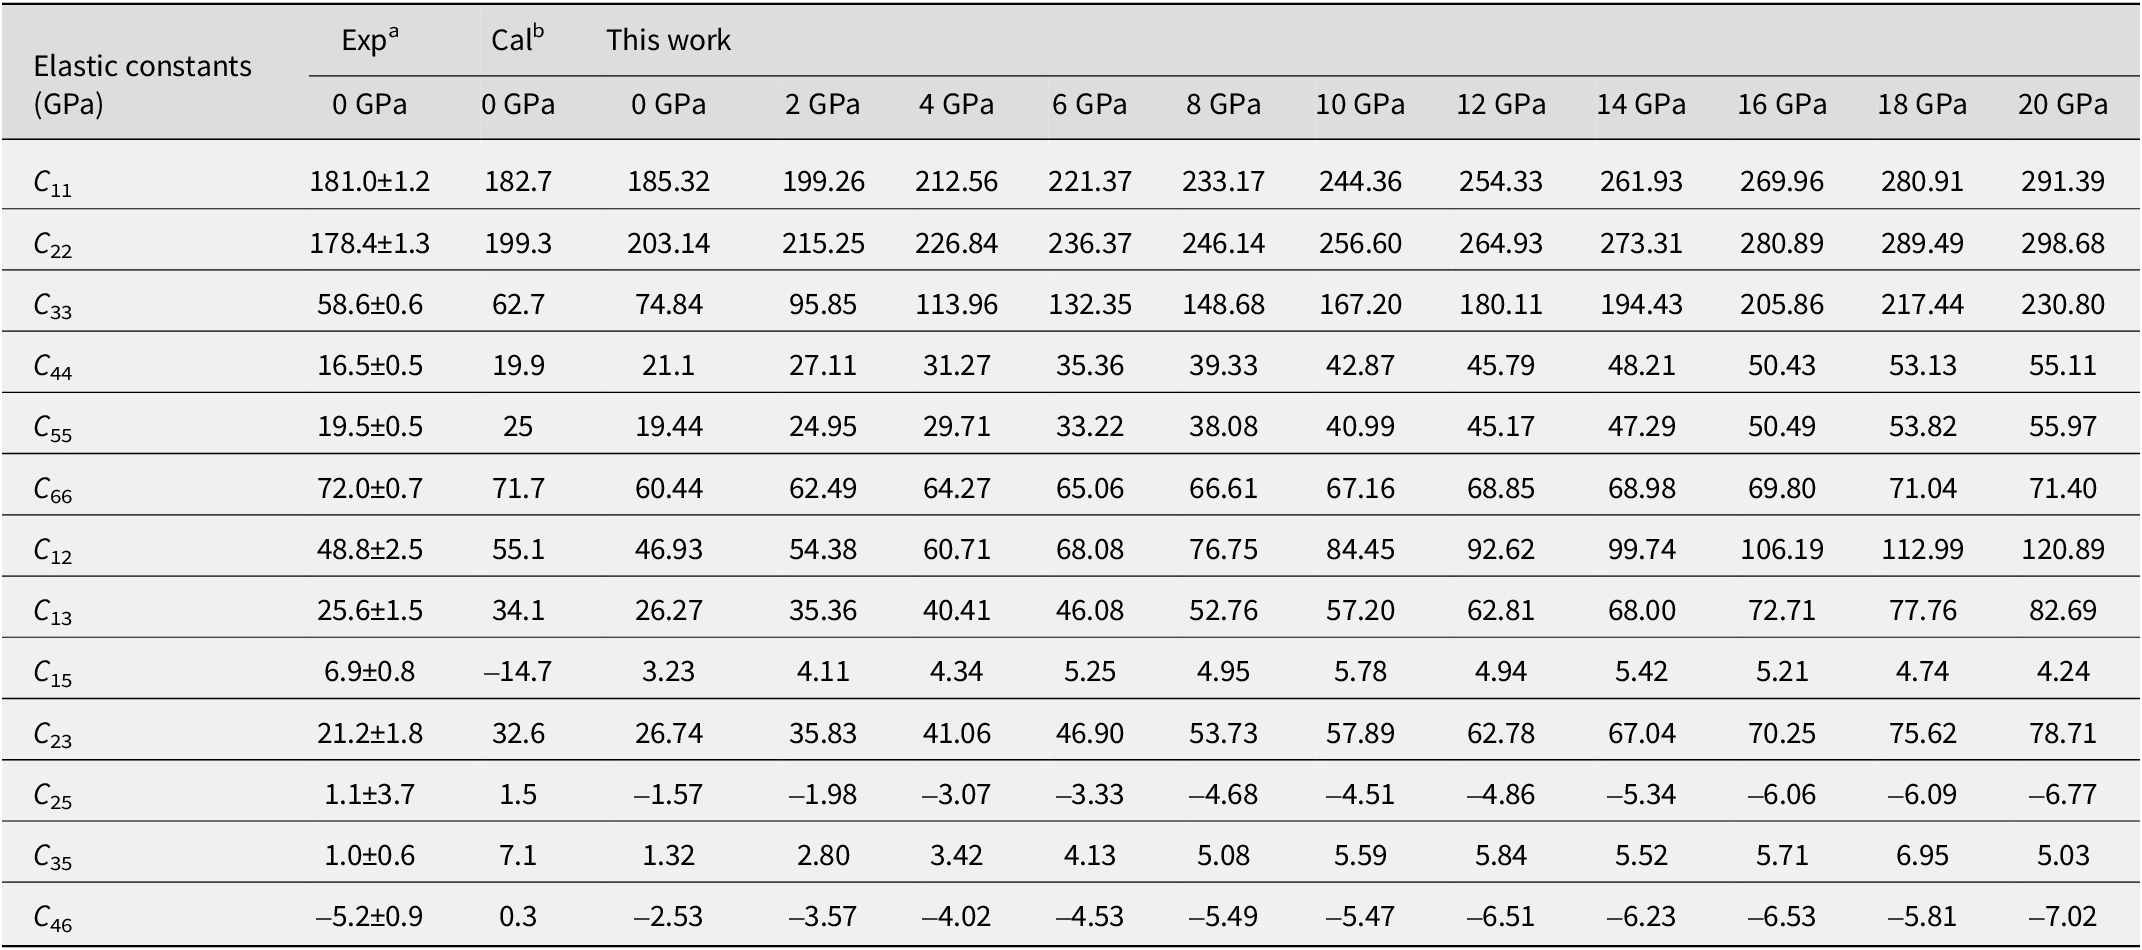
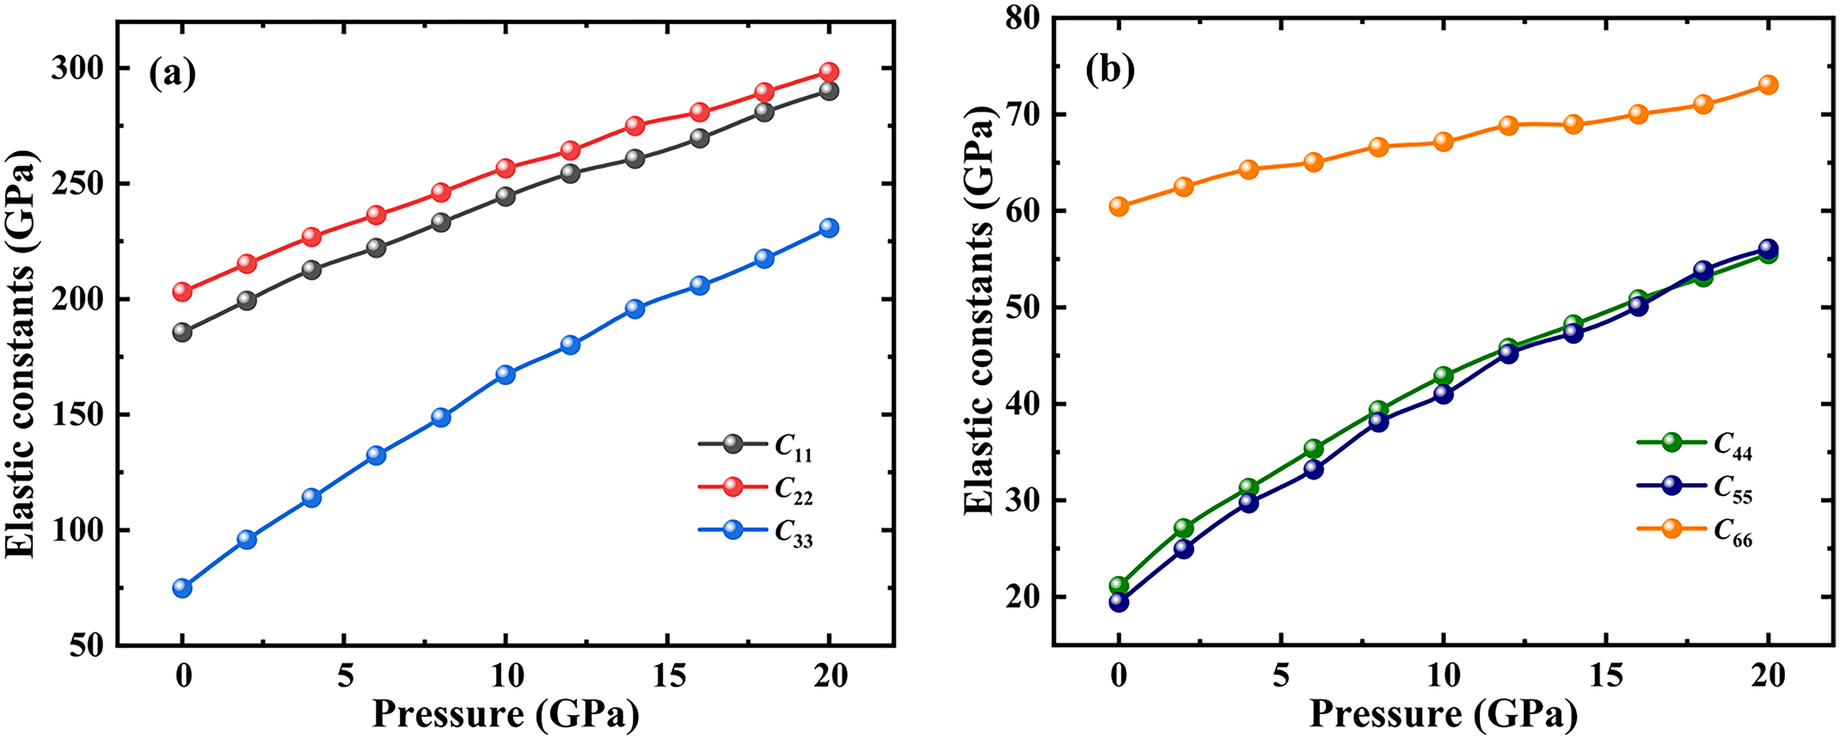
The elastic constants and mechanical parameters of illite at various pressures were calculated systematically in the present study. The 13 independent elastic constants under various pressures are listed in Table 4. All of the constants satisfied the Born stability criterion (Born, Reference Born1940; Mouhat and Coudert, Reference Mouhat and Coudert2014; Hossain, Reference Hossain2019), confirming the mechanical stability of illite with the investigated pressure range. At P=0 GPa, the calculated elastic constants were C 1 = 185.32 GPa, C 22 = 203.14 GPa and C 33 = 74.84 GPa. The significantly lower value of C 33 compared with C 22 and C 11 implied a weaker resistance to linear compression along the crystallographic c-axis, suggesting a greater propensity for deformation and structural failure in this direction. The results also proved that the atomic bonds within the (001) plane were weaker than within the (100) and (010) planes. The value of C 66 exceeded those of C 44 and C 55, indicating a greater resistance to shear deformation on the (001) plane compared with the (100) and (010) planes. The simulation results of illite at 0 GPa showed excellent agreement with available empirical data and previous computational results (Militzer et al., Reference Militzer, Wenk and Stackhouse2011; Liang et al., Reference Liang, Gao, Sun, Liu, Li and Wang2023).
The calculated elastic constants of illite; data from other studies and other theoretical data are also listed for comparison

Table 4. Long description
The table lists 13 elastic constants (C sub 11 through C sub 46) in the first column.
Columns 2 and 3 provide baseline data at 0 G P a from Exp super a (experimental) and Cal super b (previous calculation).
Columns 4 through 14 present ‘This work’ results at increasing pressure intervals: 0, 2, 4, 6, 8, 10, 12, 14, 16, 18, and 20 G P a.
Key trends include:
* C sub 11: Increases from 185.32 at 0 G P a to 291.39 at 20 G P a.
* C sub 22: Increases from 203.14 at 0 G P a to 298.68 at 20 G P a.
* C sub 33: Shows significant growth from 74.84 at 0 G P a to 230.80 at 20 G P a.
* C sub 44 and C sub 55: Both start near 20 at 0 G P a and increase to approximately 55-56 at 20 G P a.
* C sub 66: Shows a more stable trend, moving from 60.44 at 0 G P a to 71.40 at 20 G P a.
* C sub 12, C sub 13, and C sub 23: All show positive linear increases with pressure.
* C sub 25 and C sub 46: Maintain negative values that decrease further (become more negative) as pressure increases, reaching -6.77 and -7.02 respectively at 20 G P a.
* C sub 15 and C sub 35: Remain low positive values (under 7) across the entire pressure range.
Exp a , Liao, M.Q., Liu, Y., Min, L.J., Lai, Z.H., Han, T.Y., Yang, D.N., & Zhu, J.C. (Reference Liao, Liu, Min, Lai, Han, Yang and Zhu2018). Alloying effect on phase stability, elastic and thermodynamic properties of Nb-Ti-V-Zr high entropy alloy. Intermetallics, 101, 152–164.
Cal b , Militzer, B., Wenk, H.R., & Stackhouse, S. (Reference Militzer, Wenk and Stackhouse2011) First-principles calculation of the elastic moduli of sheet silicates and their application to shale anisotropy. American Mineralogist, 96, 125–137.
As shown in Fig. 6, the elastic constants C 11, C 22, and C 33 increased with increasing pressure, demonstrating enhanced resistance to linear deformation along the a-, b-, and c-axes. Notably, the rate of increase of C 33 was more pronounced than of other elastic constants. The elastic constants of C 12, C 13, C 23, C 35, and C 46 increased with pressure, while C 15 and C 25 exhibited a decreasing trend. Although the shear constants C 44 and C 55 increased more rapidly than C 66 in the range 0–20 GPa, their values remained consistently lower than that of C 66. This indicated that the (100) and (010) planes of illite resisted shear deformation increases under the calculated pressures, but never exceeded the ability of the (001) plane to resist shear deformation.
Elastic constants as a function of pressure for illite: (a) C 11, C 22, and C 33; (b) C 44, C 55, and C 66.

Figure 6. Long description
Two panels, labeled a and b, plot elastic constants in G P a on the y-axis against pressure in G P a on the x-axis, ranging from 0 to 20 G P a.
Panel a displays three data series with a linear upward trend.
- C sub 2 2 (red line) is the uppermost, starting at approximately 200 G P a and rising to nearly 300 G P a.
- C sub 1 1 (black line) follows a similar path just below C sub 2 2, starting at 185 G P a.
- C sub 3 3 (blue line) starts significantly lower at 75 G P a and shows a steeper linear increase to 230 G P a.
Panel b displays three different data series.
- C sub 6 6 (orange line) starts at 60 G P a and shows a gradual, slightly concave upward trend reaching about 73 G P a.
- C sub 4 4 (green line) and C sub 5 5 (dark blue line) are closely grouped at the bottom. Both start near 20 G P a and follow a logarithmic-style curve that steepens then levels slightly, ending near 55 G P a. C sub 4 4 remains slightly above C sub 5 5 throughout the pressure range.
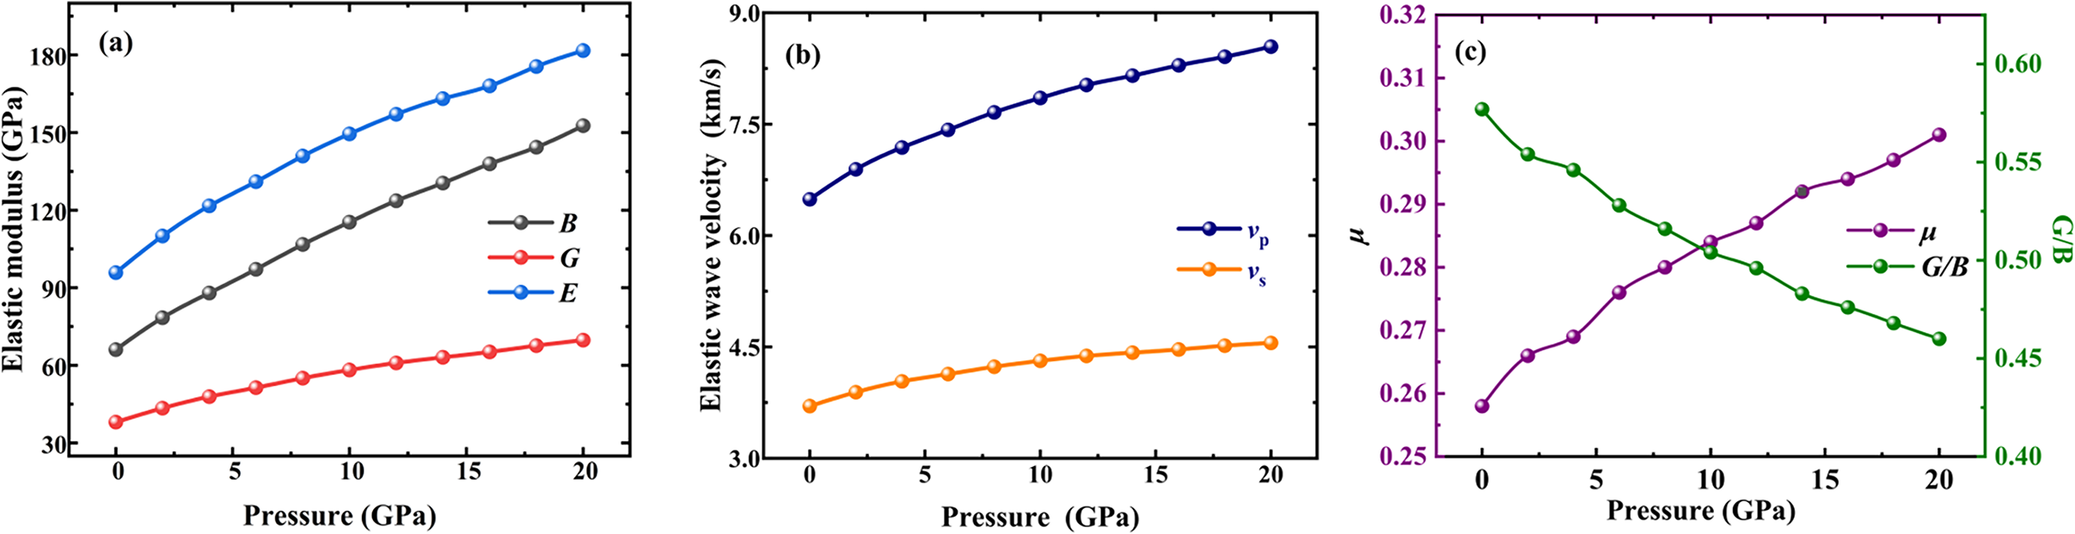
Calculation of the mechanical properties of illite, based on the elastic constants, is shown in Fig. 7. The bulk modulus (B), shear modulus (G), and Young’s modulus (E), which quantify a material’s resistance to volume change, shear deformation, and compressive stiffness, respectively, were calculated. At ambient pressure (0 GPa), the calculated values of B, G and E were 66.00, 38.21, and 96.10 GPa, respectively. The ratio G/B (Pugh’s modulus) is often used to predict brittle versus ductile behavior, with a critical value of ~0.57. The calculated G/B ratio of 0.579 at 0 GPa suggested predominantly brittle behavior under ambient conditions. Poisson’s ratio (μ) quantifies the crystal’s resistance to deformation caused by shear stress. In the present study, the value for μ was 0.257 at 0 GPa. The compression wave, ν p, and shear wave, ν s, values are 6.49 and 3.71 km s–1, respectively. These results provide essential data for seismic modeling and the interpretation of scattering measurements (Wang et al., Reference Wang, Wang and Cates2001).
Mechanics parameters as a function of pressure for illite: (a) elastic modulus (B, G, and E), (b) elastic wave velocity (ν p and ν s), and (c) Poisson’s ratio (μ) and G/B.

Figure 7. Long description
A multi-panel figure with three line graphs labeled a, b, and c. All graphs share an x-axis representing Pressure in G P a ranging from 0 to 20.
Panel a: The y-axis is Elastic modulus in G P a ranging from 30 to 180. Three curves show a non-linear increase with pressure. The top blue curve E starts at approximately 95 and rises to 180. The middle black curve B starts at 65 and rises to 150. The bottom red curve G starts at 40 and rises to 70.
Panel b: The y-axis is Elastic wave velocity in k m forward slash s ranging from 3.0 to 9.0. Two curves show a non-linear increase. The top dark blue curve v sub p starts at 6.5 and reaches 8.5. The bottom orange curve v sub s starts at 3.7 and reaches 4.6.
Panel c: This graph has dual y-axes. The left y-axis is mu in purple ranging from 0.25 to 0.32. The right y-axis is G forward slash B in green ranging from 0.40 to 0.60. The purple curve mu shows a non-linear increase from 0.258 to 0.301. The green curve G forward slash B shows a non-linear decrease from 0.57 to 0.46. The two curves intersect at a pressure of approximately 10 G P a.
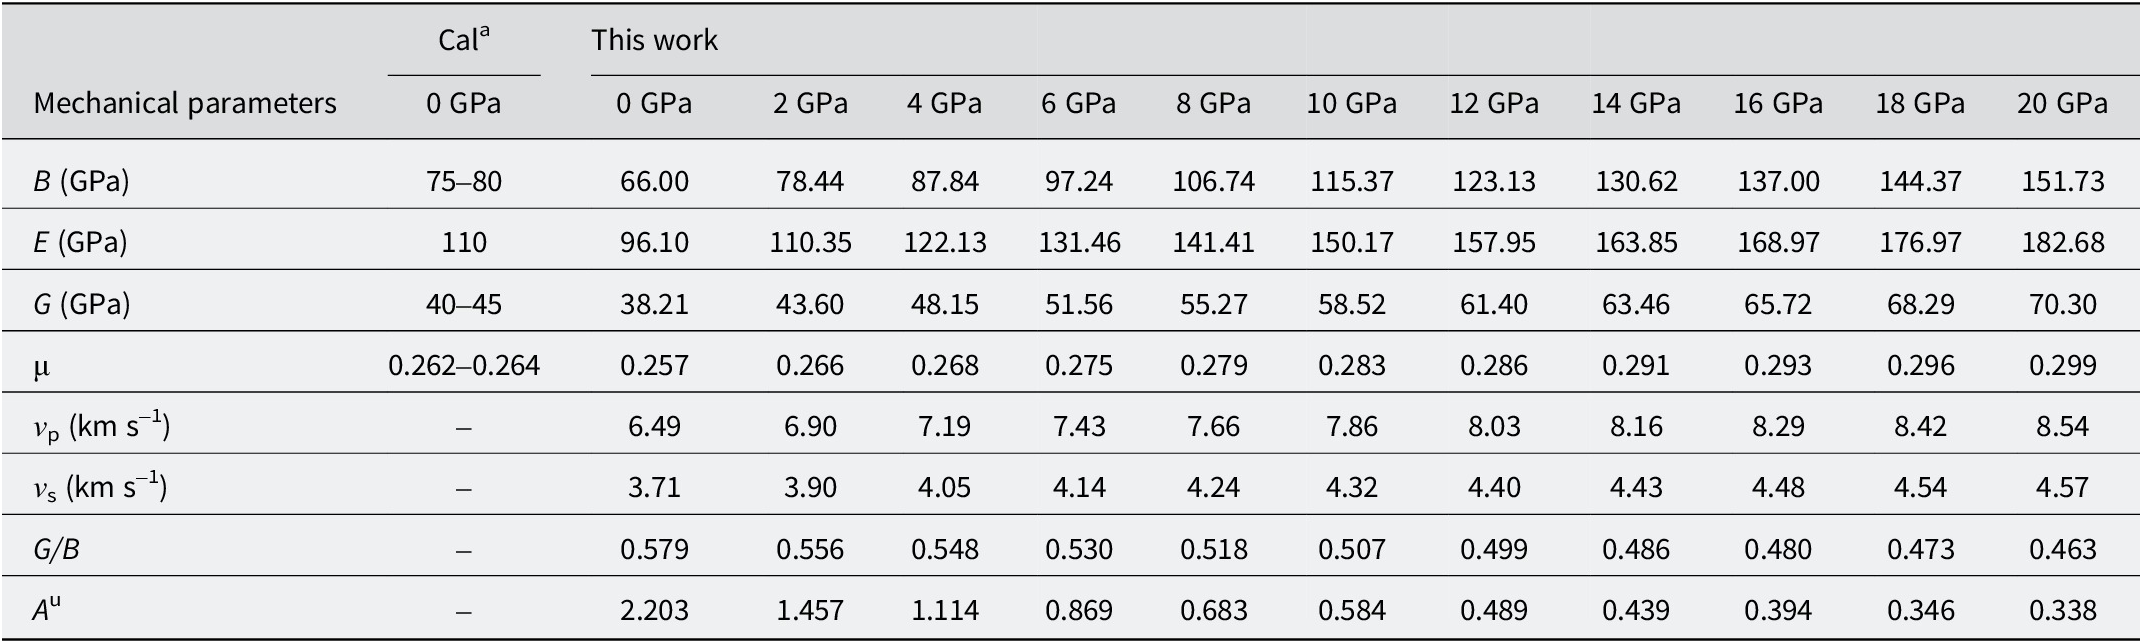
The mechanical properties under increasing pressure are shown in Fig. 7 and listed in Table 5. The value of B increased markedly from 66.00 to 151.73 GPa, demonstrating a high degree of incompressibility for illite over the pressure range of 0–20 GPa. Meanwhile, the G value for illite also increased from 38.21 to 70.30 GPa, indicating strengthened resistance to shear deformation. Throughout the 0–20 GPa range, the value for B remained greater than that for G, indicating that the resistance of illite to volumetric compression consistently exceeded its resistance to shear deformation. In Fig. 7a, the E value for illite also showed a monotonic increase with pressure. As shown in Fig. 7b, the compression-wave velocities, νp, and shear-wave velocities, νs, of illite generally increased with increasing pressure, from 6.49 and 3.71 km s–1 to 8.54 and 4.57 km s–1, respectively. As shown in Fig. 7c, Pugh’s modulus G/B ratio decreased gradually with increasing pressure, proving a progressive enhancement of ductile character. This trend towards increased toughness was corroborated by the increasing Poisson’s ratio, μ (Fig. 7c), which further suggested a strengthening of covalent bonding character under compression.
The calculated bulk modulus (B), shear modulus (G), Young’s modulus (E), Poisson’s ratio (μ), Pugh’s modulus (G/B), compression wave velocity (ν p), shear wave velocity (ν s) and anisotropy A u of the illite given pressures; the other theoretical data are also listed for comparison

Table 5. Long description
The table consists of 13 columns and 9 rows. The first column lists mechanical parameters, while the subsequent columns represent pressure levels: Cal super a at 0 G P a, This work at 0 G P a, and then increments of 2 G P a from 2 G P a to 20 G P a.
* Bulk modulus B in G P a: Increases from 66.00 at 0 G P a to 151.73 at 20 G P a. The Cal super a value is 75 to 80.
* Young’s modulus E in G P a: Increases from 96.10 at 0 G P a to 182.68 at 20 G P a. The Cal super a value is 110.
* Shear modulus G in G P a: Increases from 38.21 at 0 G P a to 70.30 at 20 G P a. The Cal super a value is 40 to 45.
* Poisson’s ratio mu: Increases from 0.257 at 0 G P a to 0.299 at 20 G P a. The Cal super a value is 0.262 to 0.264.
* Compression wave velocity v sub p in k m s super minus 1: Increases from 6.49 at 0 G P a to 8.54 at 20 G P a.
* Shear wave velocity v sub s in k m s super minus 1: Increases from 3.71 at 0 G P a to 4.57 at 20 G P a.
* Pugh’s modulus G forward slash B: Decreases from 0.579 at 0 G P a to 0.463 at 20 G P a.
* Anisotropy A super u: Decreases significantly from 2.203 at 0 G P a to 0.338 at 20 G P a.
Cal a , Ren, Y., Wu, D., & Jia, J. (Reference Ren, Wu and Jia2023). Molecular simulation the physical and chemical properties of illite under different temperatures and pressures and interlaminar water saturation. Journal of Materials Science and Engineering, 41, 98–106.
Pressure-dependent evolution of the anisotropy of illite
The universal anisotropic index (A U) was suggested by Ranganathan and Ostoja-Starzewski (Reference Ranganathan and Ostoja-Starzewski2008) to provide a measure with which to compare the anisotropy of any symmetric material. The index synthesized the anisotropic contributions of B and G via the relation A U=5G V/G R+B V/B R–6, where the subscripts V and R denote the Voigt and Reuss bounds, respectively. A value of A U=0 corresponds to perfect isotropy, with larger values of A U indicating greater elastic anisotropy. The calculated A U values of illite under high pressures are listed in Table 5. At P=0 GPa, the anisotropic index (A U) of illite was 2.203, indicating significant anisotropy. In the pressure range of 0–20 GPa, the anisotropic index of illite decreased considerably from 2.203 to 0.338, reflecting a significant pressure-induced trend towards more isotropic mechanical behavior.
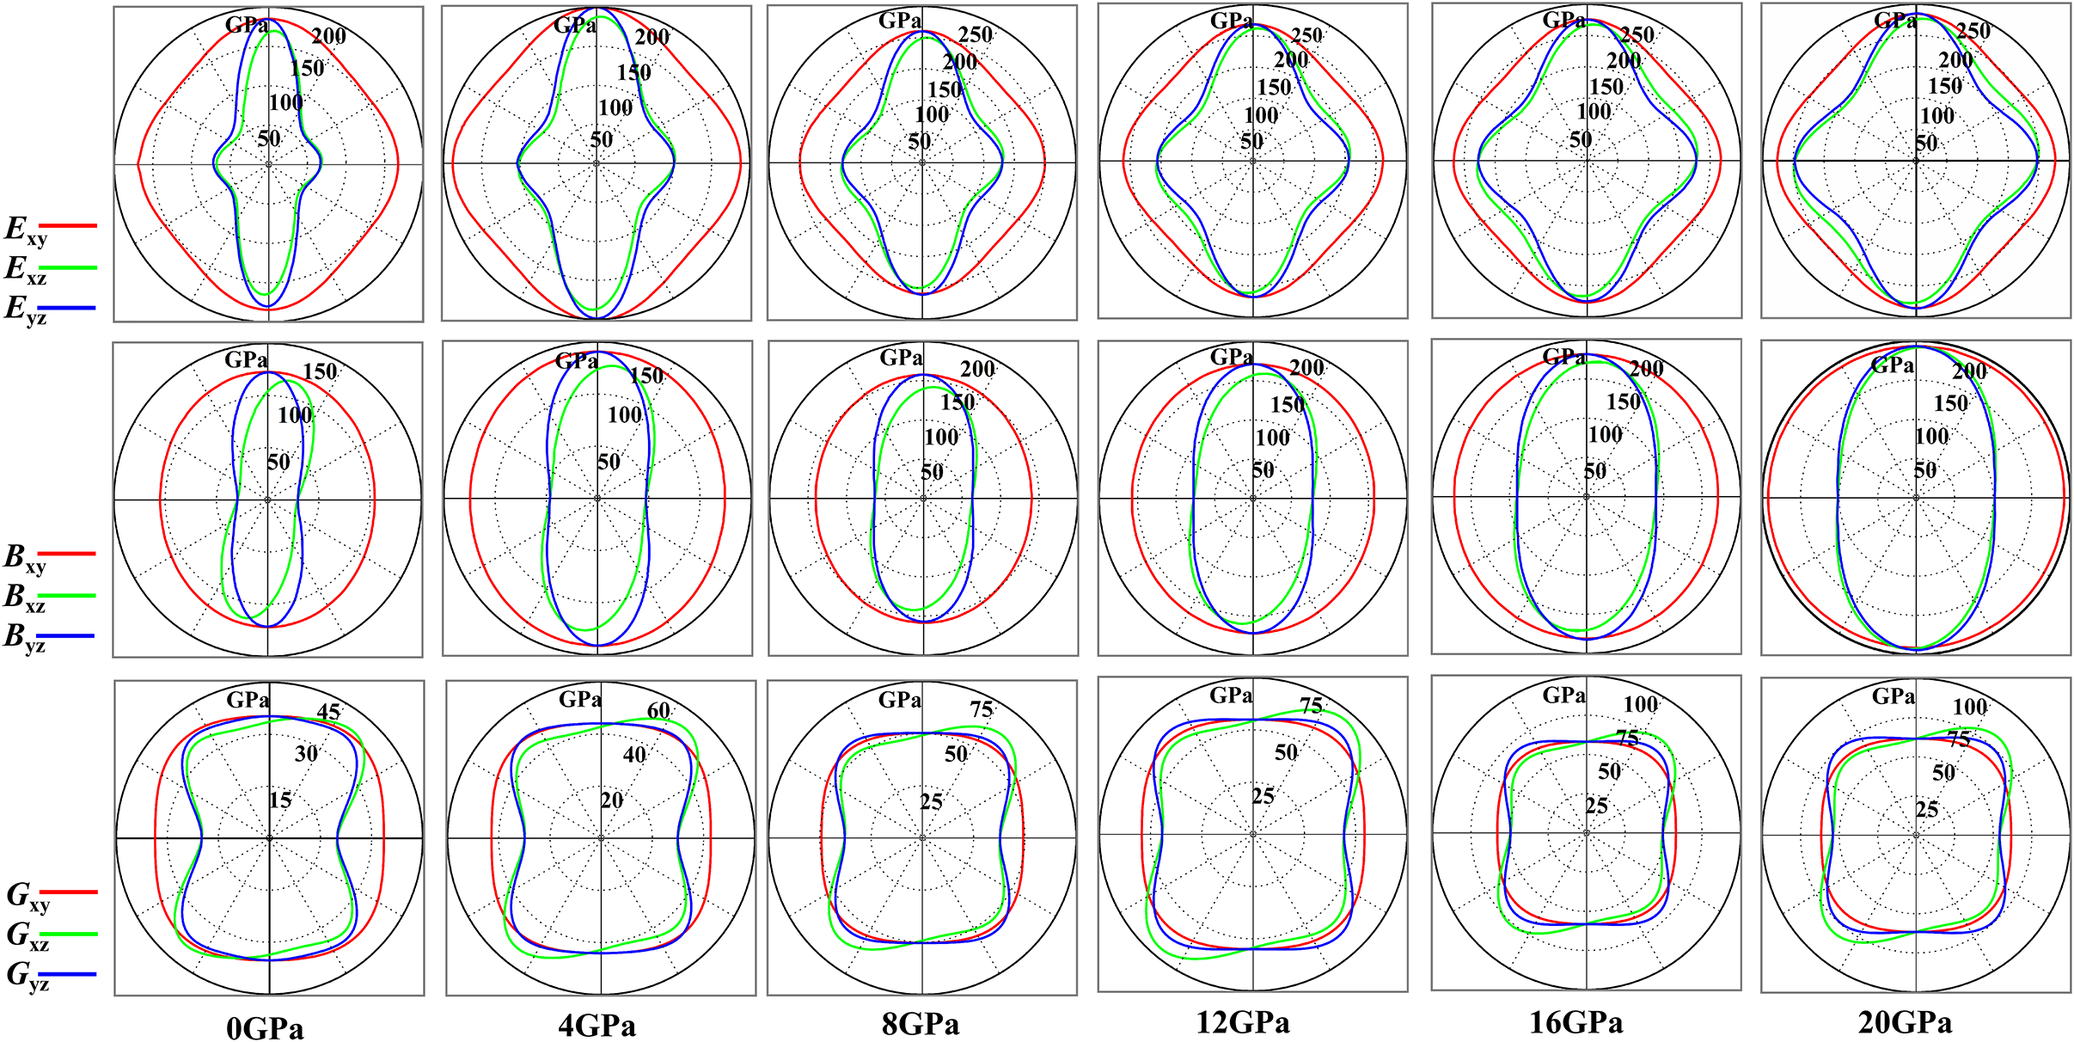
In order to obtain a better description of the anisotropy of illite under pressures from 0 to 20 GPa, the directional dependence of E, B, and G on the (001), (010), and (100) crystallographic planes was calculated using two-dimensional projections generated by the ELASTICPOST software (Liao et al., Reference Liao, Liu, Min, Lai, Han, Yang and Zhu2018). As shown in Fig. 8, these projections provided a direct graphical representation of elastic anisotropy on each plane. For a perfectly isotropic material, the projected shape of an ideal 2-dimensional plane should be circular. As shown in Fig. 8, the projection of Young’s modulus exhibited its most pronounced deviation from circularity on the (001) plane compared with the (010) and (100) planes at pressure of 0 GPa. As pressure increased from 0 to 20 GPa, the anisotropy of B decreased clearly on the (010) and (100) planes, while the projections on the (001) plane remained nearly circular. The distinct anisotropy of shear modules on the (001), (010), and (100) planes under high pressures is shown in Fig. 8. The projections for G indicated that the (100) and (010) planes of illite retained greater anisotropy than the (001) plane under high pressures.
The three 2‑dimensional planes of Young’s modulus (E), bulk modulus (B), and shear modulus (G) as a function of pressure for: (a) 0 GPa, (b) 4 GPa, (c) 8 GPa, (d) 12 GPa, (e) 16 GPa, and (f) 20 GPa, respectively.

Figure 8. Long description
The figure consists of three rows and six columns.
Row 1: Young modulus E sub x y (red), E sub x z (green), and E sub y z (blue). At 0 G P a, the shapes are highly anisotropic with sharp lobes. As pressure increases to 20 G P a, the shapes expand and become more rounded, with the scale increasing from 200 to 250 G P a.
Row 2: Bulk modulus B sub x y (red), B sub x z (green), and B sub y z (blue). At 0 G P a, the traces show elongated vertical ovals. With increasing pressure, the red trace (B sub x y) expands into a perfect circle, while the green and blue traces remain elliptical but grow in magnitude from 150 to 200 G P a.
Row 3: Shear modulus G sub x y (red), G sub x z (green), and G sub y z (blue). At 0 G P a, the traces form rounded square-like shapes. As pressure increases, the shapes maintain their four-lobed symmetry but expand significantly, with the radial scale increasing from 45 to 100 G P a.
Columns: Represent pressure increments of 0, 4, 8, 12, 16, and 20 G P a from left to right. Each radial plot features concentric dashed grid lines indicating magnitude in G P a, with labels placed along the vertical axis.
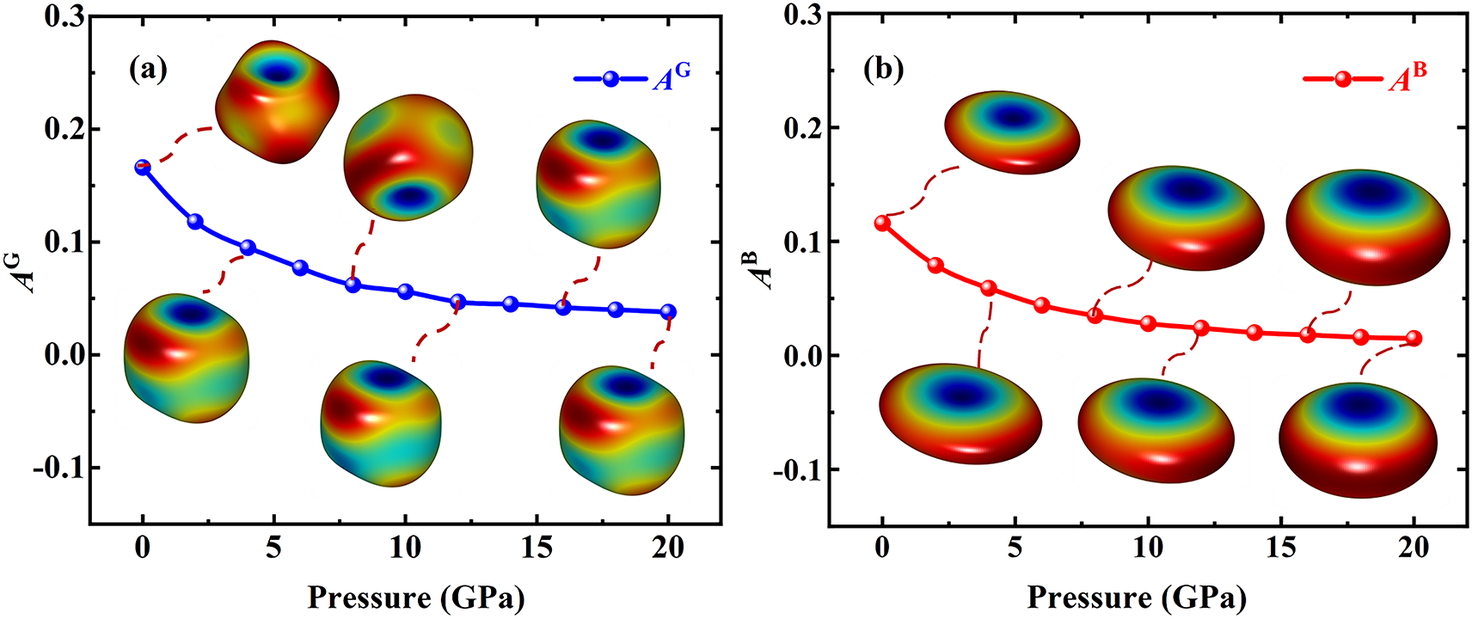
Three-dimensional surface representations of the shear and bulk modulus were constructed to visualize the elastic anisotropy more intuitively (Fig. 9). Perfectly spherical surfaces correspond to ideal isotropic behavior, whereas deviations from sphericity reflect the degree of anisotropy. As shown in Fig. 9a, the shear modulus anisotropy, A G, showed significant variations with increasing pressure. A G and A B represent the anisotropy of shear modulus and bulk modulus, respectively (Chung and Buessem, Reference Chung and Buessem1968). At low pressures, the surfaces exhibited more irregular and asymmetric shapes, indicating a higher level of anisotropy. With increasing pressure, the surfaces evolved into smoother and more symmetric forms, suggesting a reduction in anisotropic behavior. Similarly, the 3-dimensional surface representation of B (Fig. 9b) revealed a transition from highly elliptical, anisotropic shapes at low pressures to more spherical and isotropic geometries at elevated pressures. This evolution demonstrates that the response of illite to pressure became increasingly uniform under compression, further confirming the decrease in the anisotropy of B. The preceding results from the directional modulus projections were generally consistent with the trend shown by the decreasing universal anisotropic index A U over the pressure range 0–20 GPa.
The 3-dimensional distribution of anisotropy of: (a) shear modulus (A G), and (b) bulk modulus (A B) of illite under a range of pressures.

Figure 9. Long description
A two-panel multiplot.
Panel a: The x-axis is Pressure in G P a ranging from 0 to 20. The y-axis is A super G ranging from minus 0.1 to 0.3. A blue line with circular markers shows a non-linear decrease in shear modulus anisotropy, starting at approximately 0.17 at 0 G P a and curving downward to approximately 0.04 at 20 G P a. Six 3-dimensional surface plots are connected to the data line by dashed red lines. These surfaces are roughly cubic with rounded edges and indented centers, colored with a heat map where blue represents low values and red represents high values. As pressure increases, these 3-dimensional shapes appear more compressed.
Panel b: The x-axis is Pressure in G P a ranging from 0 to 20. The y-axis is A super B ranging from minus 0.1 to 0.3. A red line with circular markers shows a non-linear decrease in bulk modulus anisotropy, starting at approximately 0.12 at 0 G P a and leveling off toward 0.02 at 20 G P a. Six 3-dimensional surface plots are connected to the data line. These surfaces are oblate spheroids with a central blue depression and red outer rings. As pressure increases, the spheroids become flatter and more disk-like.
Conclusions
The atomic and electronic structures, mechanical properties, and elastic anisotropy of Al-rich illite were analyzed systematically under pressures ranging from 0 to 20 GPa using DFT. Firstly, the reliability of the computational approach was validated by the excellent agreement between the optimized atomic structure of illite at 0 GPa and available experimental data. With increasing pressure, the volume, lattice parameters, bond lengths, and average interlayer spacing of illite decreased monotonically. Secondly, the electronic structure analysis, including band structure, density of states, and charge density distribution, showed that illite maintained a wide and insulating bandgap throughout the studied pressure range, with its fundamental electronic character remaining stable. Finally, the elastic constants calculated confirmed that illite is most resistant to linear compression along the a-axis and least resistant along the c-axis over the pressure range of 0–20 GPa. The (001) plane of illite exhibited significantly greater shear stiffness compared with the (010) and (100) planes. Most of the mechanical parameters of illite increased steadily with pressure, signifying a steady improvement in the elastic mechanical behavior of illite. The anisotropy of illite decreased with increasing pressure, reflecting a pronounced trend towards more isotropic elastic behavior.
This microscopic, first-principles study of the high-pressure behavior of illite provides fundamental data and insights with direct implications for geoscience and engineering applications. The results provide key parameters for designing high-performance engineered clay barriers, such as those used in nuclear waste repositories. The pressure-dependent full elastic tensor obtained can be used to improve the accuracy of geomechanical models for deep geological reservoirs, including those relevant to hydrocarbon extraction and CO₂ sequestration, thereby enabling better prediction of wellbore stability and fracture propagation. The quantitative evolution of elastic anisotropy offers an atomistic basis for explaining the macroscopic mechanical anisotropy observed in illite-bearing shales and for the interpretation of seismic velocity anisotropy in geophysical surveys.
Data availability statement
The data that support the findings of this study are available on request from the corresponding author.
Acknowledgements
None.
Author contributions
Conceptualization: J. Z.; Data curation: Y.-Y. B., X.-S. C.; Methodology: J. Z.; Software: M. H.; Visualization: T.-T. S.; Writing – original draft: Y.-Y. B.; Writing – Reviewing and Editing: J. Z.
Financial support
The present study was funded by the National Natural Science Foundation of China (grant number 41702317) and the Fundamental Research Funds for the Central Universities (2023ZKPYSB01).
Competing interests
The authors declare none.