INTRODUCTION
In an earlier study, we described the application of the First Order System Transfer Function to maze learning that allowed assessment of three psychophysiological parameters: the learning rate, readiness to learn, and ability to learn. The model was found to provide excellent fits for both group data and for individual animals under acquisition and reacquisition and was able to detect strain differences among Wistar and albino rats. We have shown that the learning curve could be more or less equally well approximated with the hyperbola, the arc cotangent, the logarithmic or exponential transfer function, but the proposed transfer function model is preferable to others because it coincides with the popular Rescorla-Wagner model of classical conditioning, and the model’s coefficients allow psychophysiological interpretation (Stepanov & Abramson, Reference Stepanov and Abramson2008).
Next we now apply the model to the California Verbal Learning Test – II (Delis, Kramer, Kaplan, & Ober, Reference Delis, Kramer, Kaplan and Ober2000). To fit the mathematical model to memory data in experimental psychology and clinical practice we believe that two conditions must be met. First, a large number of test objects must be presented and second, a sufficient number of trials must be used to ensure a proper assessment of the asymptotic level of learning. Not all memory tests fulfill these requirements. For example, the Wechsler memory scale word list I consists of 12 words, but only 4 trials (Wechsler, Reference Wechsler1997); the Brief Visuospatial Memory Test uses only three trials (Benedict, Reference Benedict1997) and a test developed for learning of Russian words (Golden, Reference Golden1985; Luria, Reference Luria1962) uses seven trials, but only ten words. The California Verbal Learning Test — second edition (CVLT-II) rises above the others, in that 16 words from list A are used with 5 trials (Delis et al., Reference Delis, Kramer, Kaplan and Ober2000).
Although the authors of the CVLT-II provided standardized scores for each of the five learning trials, no quantitative analysis of the learning curve has ever been applied to list A (Delis et al., Reference Delis, Kramer, Kaplan and Ober2000). Only one attempt has been made to apply a mathematical model to the CVLT learning curve. Warschausky and colleagues used a quadratic model in the form a x2 + b x to fit learning curves obtained with the California Verbal Learning Test — Children’s version (Warschausky, Kay, Chi, & Donders, Reference Warschausky, Kay, Chi and Donders2005). However, the authors treated the model’s two coefficients (a and b) as different learning rate parameters. Unlike our model, Warschausky et al. (Reference Warschausky, Kay, Chi and Donders2005) were not able to assess readiness to learn and ability to learn as our model does.
Taking into account that the CVLT-II is widely used in experimental psychology and clinical practice (Rabin, Barr, & Burton, Reference Rabin, Barr and Burton2005), we concentrated our effort on application of the first order system transfer function mathematical model to the CVLT-II data from Bruehl and colleagues (Bruehl et al., Reference Bruehl, Rueger, Dziobek, Sweat, Tirsi and Javier2007). Applications of the mathematical model to individual data and to data averaged across a group are also presented. Measures obtained from the mathematical model are compared with the standard CVLT-II measures. We illustrate that fitting the learning curve with the first order system transfer function yields additional information not currently available with standard CVLT-II measures.
METHODS
Participants
Fifty-eight participants were used and equally divided into control and clinical groups. Twenty-nine healthy volunteers participated in the control group. The participants were part of a larger study of normal aging. All lived independently, were between 43 and 74 years of age, had at least a high school education, and were in the cognitively normal range. Within the group, 15 participants met the criteria for hypertension and 6 participants met the criteria for dyslipidemia. Participants provided informed written consent and were compensated for their participation. Evidence of neurological, medical (other than dyslipidemia, or hypertension), or psychiatric (including depression and alcohol or other substance abuse) problems excluded individuals from participating in the study.
A clinical group consisted of 29 participants with type 2 diabetes mellitus (T2DM) meeting one or more of the following criteria: (1) a fasting glucose value greater than 125 mg/dl on two separate occasions, (2) a 2-hour glucose value greater than 200 mg/dl during a 75-gr oral glucose 8 tolerance test, or (3) a prior diagnosis of T2DM and treatment with hypoglycemic agents and/or diet and exercise. All other clinical details are available in the study of Bruehl et al. (Reference Bruehl, Rueger, Dziobek, Sweat, Tirsi and Javier2007).
This study was approved by the New York University School of Medicine Institutional Review Board, which is where the participants were evaluated. Human research was completed in accordance with the guidelines of the Helsinki Declaration “WORLD MEDICAL ASSOCIATION DECLARATION OF HELSINKI. Ethical Principles for Medical Research Involving Human Subjects”.
Evaluations
All participants underwent an assessment that included a physical examination and endocrine, neuropsychological, and psychiatric evaluations. All details are available in the study of Bruehl et al. (Reference Bruehl, Rueger, Dziobek, Sweat, Tirsi and Javier2007).
Neuropsychological and Psychiatric Assessment
The cognitive assessments were standardized neuropsychological tests described in detail elsewhere (Lezak, Reference Lezak1995). Significant group differences were found for intelligence (IQ) estimated with WAIS-R full 12 scale IQ scores, with diabetic individuals having a normal but lower IQ than control participants (individuals with T2DM: 105.2, SEM = 2.2, SD = 11.7); controls: 115.3, SEM = 1.31, SD = 7.07; t = 3.969; df = 46; p < .001). Declarative memory was assessed with the CVLT-II. The raw scores from list A (immediate free recall) on trials 1–5 were used for the fitting of averaged and individual learning curves.
Statistical Analyses
Description of the mathematical expression of the transfer function of the first order linear system
The mathematical background of the application of the transfer function of the first order linear system in response to a stepwise input action for assessment of the learning curve was provided elsewhere (Stepanov & Abramson, Reference Stepanov and Abramson2008). During a free recall memory test (such as the CVLT-II), presentation of a list of words acts as a stepwise input signal that begins to act upon a participant under testing for the first time on the first trial. The output signal (the number of correctly recalled words) is random because human behavior is treated as any complex biological system; thus a nonlinear regression analysis should be used to evaluate the parameters of our model of the learning curve (Draper & Smith, Reference Draper and Smith1981; Himmelblau, Reference Himmelblau1970).
We adopted the first order transfer function for the assessment of the learning curve in the form Y = B3 e−B2 (X − 1) + B4(1 − e−B2 (X − 1)). In the case of the CVLT-II, X is the trial number and Y is the number of correctly recalled words without repetitions. The parameters are: B2 — the learning rate; B4 — the asymptotic value of recalled words at X = Infinity; B3 — the number of correctly recalled words on the first trial (i.e., B3 = Y at X = 1).
Use of the independent variable in the form of (x-1) means that the first trial, i.e., at x = 1, assesses auditory attention span (Delis et al., Reference Delis, Kramer, Kaplan and Ober2000) or in our terminology the background readiness to learn. Learning itself begins when the list of words is presented repeatedly, Trial 2 being the first repetition. In accordance with the definition of the transfer function, the rate of achievement of the asymptotic value is named “the time constant (τ)”. The time constant reveals how much time (after trial 1) is necessary for achievement of 63% of the difference between the initial and asymptotic levels of the output signal (Grodins, Reference Grodins1963; Milsum, Reference Milsum1966). The solution of the background differential equation shows that B2 = 1/τ (Stepanov & Abramson, Reference Stepanov and Abramson2008). Thus, regarding learning of target words 1/B2 is the number of trials after trial 1 needed to reach 63% from the difference between the initial (B3) and asymptotic (B4) values of correctly recalled words.
Comparison of the model’s coefficients with appropriate standard CVLT-II measures
Coefficient B3 is very close to the level of correct recall on trial 1 — the standard measure used in CVLT-II. Delis et al. (Reference Delis, Kramer, Kaplan and Ober2000) pointed out that “performance on the first immediate-recall trial of List A (Trial 1) is thought to be especially dependent on auditory attention span” (Delis et al., Reference Delis, Kramer, Kaplan and Ober2000, p. 28). We treat B3 as an estimator of the functional state of a participant that includes, in particular, auditory attention span, previous experience with the test, and readiness to learn. Below we will designate B3 as “readiness to learn.” There are norms for Trial 1 recall, so it is possible to compare the Trial 1 value of a participant with previously published norms. However, if the same participant undergoes repeated retesting, it is impossible to compare Trial 1 values between the test sessions. On the other hand, B3 is a random variable with its mean and variance values, so that statistical comparison of B3 values among different participants or repetitions is possible.
Memory mechanisms are reflected in the learning rate (B2) and asymptotic level (B4), the later being designated below as “ability to learn”. In the case of the CVLT-II, B4 is the maximal possible number of correctly recalled words after a very large number of trials. It is necessary to mention that, if the rate of learning is low, the number of trials is not enough for the learning curve to reach asymptote, so that B4 can take on a value much greater than 16 test words. Poor learning is reflected in low values of B4. Hence, it is impossible to preset B4 to the number of test words (for example, to 16 in the CVLT-II). Our rationale for not presetting coefficient B4 is that the number of correctly recalled words does not always increase up to the number of test words. There is no analogue among standard CVLT-II measures to B4.
The CVLT–II provides a measure of learning rate in the form of the Learning Slope score that is measured by computing a least squares regression of the linear model. The slope of the regression line reflects the average number of new recalled words per trial. On the other hand, the coefficient B2 is interpreted mathematically within the transfer function theoretical framework as the time constant and reflects the number of trials needed to reach difference between B3 and B4. It means that B2 differs in principal from the Learning Slope.
Estimation of the parameters of the model
The statistical package SPSS provides very flexible curve fitting procedures that can be used to estimate the model’s parameters. SPSS uses gradient algorithms that require the user to input starting values of the model’s parameters. The starting values should be set as follows: the starting value for B2 should be equal to 1, for B3 — to the Trial 1 value, and for B4 — to the maximal value over all trials.
Verification of the model: Group data
We verified the model with the test for goodness of fit as it is accepted in regression analysis both for linear models (Himmelblau, Reference Himmelblau1970) and with approximate test for goodness of fit for nonlinear models (Draper & Smith, Reference Draper and Smith1981).
The test of goodness of fit for linear models is based on calculation of the variance ratio of the residual variance to the variance of the error of the measurement: 
 , where i is the learning session number, pi is the number of cases (here pi is equal to the number of participants in a group),
 is the mean value for every trial, and

 , where n = total number of sessions.
Next, significance level (p) for Fexp is calculated with the number of degrees of freedom for the numerator (df1) equal to (n-3) and with the number of degrees of freedom for the denominator (df2) equal to  , using the frequency function for the F-distribution. If the residual variance does not significantly exceed the variance of the error of the measurement or, in other words, the significance level for Fexp is p > 0.2, then the mathematical model fits the data well (Himmelblau, Reference Himmelblau1970).
We also used an approximate test for goodness of fit for nonlinear models (Draper & Smith, Reference Draper and Smith1981). This test is based on calculations of the sum of squares of the differences between experimental values and the values calculated with the mathematical model as well as the calculation of the sum of squares of “pure errors.” These values are placed in a special formula that gives a variance ratio belonging to the Fisher’s F-distribution and named “the ratio of averaged squares”. Next, the value of F-quantile with the confidence level p = .95 and degrees of freedom df1 and df2 (see above) can be calculated by means of the SPSS menu item “Transform | Compute…“ by inputting a built-in function IDF.F(0.95,df1,df2) that should be selected from the list “Functions:” in the field “Numeric expression:”. If the ratio of averaged squares is less than the appropriate F-quantile, then the mathematical model fits the data satisfactorily.
Verification of the model: Individual data
If the regression analysis is applied to the learning curve of an individual participant, then the measurement error variance cannot be estimated separately from residual variance that is an estimation of the quality of the fit. Thus, in the case of fitting a single participant’s learning curve, it is impossible to estimate significance of fitting with the mathematical model. However, it is possible to calculate the part of variance explained with the model by means of the calculation R squared that is used in Excel, SPSS and other statistical packages.
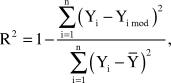
where n is the number of trials, Yi is the experimental value, Yi mod is calculated model value, and  is the average mean calculated over all experimental values.
Comparison of the model’s coefficients
Model’s coefficients are compared with t-test. The test, which is applied to the regression coefficients, is used as follows. The statistics tk is calculated by the formula  where k = 2, 3, 4 and denotes the coefficient B2, B3, or B4; i and j are indexes of the learning curves, and DB is the variance of a coefficient. SPSS calculates asymptotic standard error for the coefficients. For this purpose it is necessary to square asymptotic standard error for calculation of DB. The number of degrees of freedom (DF) for the statistics tk is equal to 4 (2*(the number of trials – the number of coefficients)). A value of tk can be calculated by means of the SPSS menu item “Transform | Compute…“. The formula, with appropriate values of the coefficients and their variances, is entered into the field “Numeric expression:” of the window “Compute variable.” The same window is used for calculating a two-way significance level p. The formula 2*(1-CDF.T(t,df)) is entered into the field “Numeric expression:”. CDF.T is a built-in function that should be selected from the list “Functions:”; t is tk and df is the number of degrees of freedom, which is 4.
Standard statistical methods
The mean and variances of the samples used for the model’s measures were estimated as usual. The correlation between CVLT-II Trial 1, Trial 5, Trials 1–5 total correct measures, and B2, B3, and B4 was assessed with Pearson’s correlation coefficient. SPSS 11.5 was used for all statistical calculations.
RESULTS
A mathematical model suitable for research and practical use should approximate learning curves obtained from both group and individual data. Thus, at first we show the applicability of our model to averaged learning curves and next illustrate how the model fits individual learning data.
The Averaged Learning Curves
This section illustrates how the model provides good fits with learning data averaged over a group of participants. We also provide an example of the ability of the model to distinguish between the average learning curve of healthy participants and the averaged learning curves of diabetic participants.
The averaged data across the 29 healthy participants provided a good fit between actual data and our model. The significance level (p = .90) for Fexp is much greater than 0.2. The ratio of averaged squares (0.106) is far less than the F-quantile, which is equal to 3.06. The value of the square of correlative relation R2 = 0.999 is also consistent with good approximation of the learning curve with the proposed model. The values of the model’s coefficients are as follows: B2 = 0.77 (asymptotic standard error = 0.062), B3 = 8.6 (asymptotic standard error = 0.12) and B4 = 14.7 (asymptotic standard error = 0.16).
The averaged data across the 29 participants with T2DM also provided a good fit. The significance level (p = .78) for the Fexp is much greater than 0.2. The ratio of averaged squares (0.250) is far less than the F-quantile, which is equal to 3.06. The value of R2 = 0.993 is also consistent with satisfactory approximation of the learning curve with the proposed model. The model’s coefficients are as follows: B2 = 1.08 (asymptotic standard error = 0.19); B3 = 7.7 (asymptotic standard error = 0.24); B4 = 12.6 (asymptotic standard error = 0.21). Both learning curves are shown in Figure 1. Comparison of the control group and the diabetic group revealed that readiness to learn (B3) was higher for the healthy participants (tB3 = 3.23; p = .032); ability to learn (B4) was also higher for the healthy participants (tB4 = 7.68; p = .015), but the learning rate (B2) did not differ (tB2 = 0.21; p > .2). Thus, T2DM led to significant downward deflection of the average learning curve for the diabetics with respect to the average learning curve for the controls (see Figure 1).
The averaged learning curves for healthy participants and participants with type 2 diabetes mellitus (T2DM). Filled circles are averaged data for 29 healthy participants, and filled triangles are averaged data for 29 participants with T2DM. Vertical lines are means with SEM. Readiness to learn is higher for the healthy participants (p = .032) as well as ability to learn (p = .015), but the learning rate does not differ (p > .2).

Thus, the model can be used for the assessment of averaged learning curves. Below we show how the model fits individual learning data and illustrate the model’s advantages and disadvantages as applied to individual learning data.
Individual Learning Curves for Healthy Participants
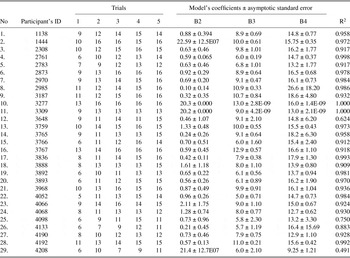
From a practical point of view, individual learning curves are of primary interest. It is obvious that a clinician is interested in monitoring individual patient treatment related changes by means of comparing learning curves before, during, and after treatment. Even if averaged curves are needed for examination, the initial stage of analysis should nevertheless begin with fitting of individual learning curves. Averaging across participants might give a misleading picture of what occurs in individual participants (Brown & Heathcote, Reference Brown and Heathcote2003; Estes, Reference Estes2002; Gallistel, Fairhurst, & Balsam, Reference Gallistel, Fairhurst and Balsam2004; Wixted, Reference Wixted1997). That is why we separately calculated individual learning curves for each healthy participant. The number of recalled words is an integer stepwise function that is fitted with a smooth monotonic mathematical model. Thus, B3 and B4 are real decimal numbers. For example, for participant 2873 (Table 1, item 6), who correctly recalled 9-13-16-16-16 words over the five trials, B3 was 8.9 and B4 16.5.
The regression analysis of individual learning curves for healthy participants

The results of the regression analysis of the data for each participant are given in Table 1.
Values of the model’s measures
Values of readiness to learn (B3) ranged from 5.0 to 13.0 across the participants. The mean value was equal to 8.5 (SEM = 0.41). The distribution of B3 did not differ from the normal distribution (p ≥ .12). The mean value was close to that found for the averaged learning curve (B3 = 8.6). Both values of B3 were consistent with Miller’s magic number 7 ± 2 for short memory span (Miller, Reference Miller1956).
Learning parameters are reflected in ability to learn (B4) and the learning rate (B2). Values of the ability to learn (B4) ranged from 9.25 to 26.6. The mean value was 15.6 (SEM = 0.51). The distribution of B4 across the sample differed from normality (p < .001). The mean value also differed from that of the averaged learning curve (B4 = 14.7). The lowest value of B4 (9.25) was found in participant 4208 (Table 1, item 29). Our model suggests that participants with low B4 values constitute a potentially interesting population for further study.
Values of the learning rate (B2) ranged from 0.10 to 22.59. The mean value was equal to 3.56 (SEM = 1.332). Distribution of the B2 sample differed from the normal distribution (p < .001). The mean value differed from that of the averaged learning curve (B2 = 0.77).
The quality of the fit estimated with R squared was in the range from 0.491 to 1.000 with a mean value 0.916 (SEM = 0.023). The highest values of R squared (1.000) were in participants 3277 (Table 1, item 10, Figure 4B) and 3309 (Table 1, item 11, Figure 4C) although their B2 values happened to be outliers (see below). Among participants who were not outliers, the highest value of R squared (0.998) was found in participant 2761 (Table 1, item 4, and Figure 2A). The closest values to the mean R squared value were found in participant 3767 (Table 1, item 16, and Figure 2B) and participant 3766 (Table 1, item 15, and Figure 2C). The lowest value among participants who were not outliers was in participant 3648 (Table 1, item 12, and Figure 2D). The lowest value over all participants was found in participant 4208 (Table 1, item 29, and Figure 4D) with B2 being an outlier.
Individual learning curves with different values of R squared. A: The participant 2761 (R squared = 0.998). B: The participant 3767 (R squared = 0.918). C: The participant 3766 (R squared = 0.912). D: The participant 3648 (R squared = 0.624).

Outliers: High B4 values
It is obvious that the number of correctly recalled words cannot exceed the number of words in a list (16 words). Strictly speaking, B4 > 16.0 was found in 11 of 29 participants. However, B4 values between 16.1 and 17.0 might reasonably be viewed as resulting from fitting integer-valued learning data with a smooth monotonic mathematical model. Excluding participants with B4 equal or less 17.0, four participants remain as outliers, namely 2985 (Table 1, item 8, and Figure 3), 3187 (Table 1, item 9), 3765 (Table 1, item 14) and 3836 (Table 1, item 17). This is an effect of low learning rate, as it is defined in our model — the number of trials after trial 1 needed to reach 63% of the difference between B3 and B4. B2 ranged from 0.10 to 0.42 in these four participants. If the number of trials is not enough for a participant to reach the model’s asymptote due to a very slow learning rate, then the learning curve resembles a straight line (see Figure 3). As a result, B4 becomes too high and does not reflect a true ability to learn. Thus, very high B4 values are substantially an artifact of the shape of the learning curve in these outliers, which is reflected in the value of B2. See below for further discussion.
An individual learning curve with very low value of the learning rate (B2). The learning curve of the participant 2985 (B2 = 0.10) looks more like a straight line then an exponent.

There is another reason to pay attention to B4-outliers. Averaging individual B4 values without paying attention to possible outliers of individual participants might provide a misleading picture for ability to learn (B4). If these four outliers are excluded, the mean B4 value became equal to 14.8 (SEM = 0.30), which is very close to the B4 value of 14.7 found for averaged data.
Outliers: Extremely low B2 values
The first class of B2 outliers represents a situation where values of B2 are extremely low. Five trials are not enough for participants with extremely low learning rates to approach their asymptotic level of recalled words. For example, B2 = 0.10 for participant 2985, so that the learning curve is linear rather than exponential (Table 1, item 8, and Figure 3). Participants with learning curves of this type should be considered as a population for further study.
Outliers: Extremely high B2 values
The second class of B2 outliers represents a situation where values of B2 are extremely high (see Table 1, items 2, 10, 11, and 29). Three learning patterns can be discerned. The first pattern is where the number of items learned on Trial 2 and subsequent trials is equal to 16 (Table 1, item 10, and Figure 4B) or very close to 16 (Table 1, item 2, and Figure 4A). We hypothesize that 16 items might be not enough for these participants, because they can learn many more items. The second pattern is where a participant reaches on the Trial 2 an asymptote that is less than 16 words (Table 1, item 11, and Figure 4C). The third pattern is where learning data are far from a monotonically increasing function and instead represent up and down fluctuations in the number of recalled words across trials (Table 1, item 29, and Figure 4D). Individuals with extremely high B2 values should be considered as a population for further investigation.
Individual learning curves with very high values of the learning rate (B2). A: The participant 1444 (B2 = 22.59); B: The participant 3277 (B2 = 20.3); C: The participant 3309 (B2 = 20.2); D: The participant 4208 (B2 = 21.4). Learning data resemble a staircase function in A, B, and C. Learning data in D show up and down fluctuations.

If the four B2-outliers with extremely high values were excluded, then the mean value of B2 was reduced from 3.56 to 0.75, which was very close to the B2 value 0.77 that was found for the averaged learning curve.
Although fitting with SPSS is mathematically correct, these B2 outliers are far from biological plausibility. The first order system reaches 99.3% of its asymptotic value during five time constants (5τ) (Grodins, Reference Grodins1963). If a participant recalled all 16 words during Trial 2 (participant 1444, 3277, 3309), then B2*(x-1) = 5 at x=2 and B2 = 5. This is a maximal biological plausible value for B2. Coefficient B2 might take high value, if the number of correctly recalled words fluctuates from trial to trial. This is a case with participant 4208. Including these B2 outliers into a sample over all participants might substantially disfigure a sample mean as well as other statistical sample measures. That is why we suggest that a method to correct high B2 values exceed 5 should be developed.
Correlation Between the Model’s Coefficients
In this section we show that learning rate (B2) and readiness to learn (B3) are independent parameters and, probably, reflect different brain processes during new episodic memory formation. No correlation was found between the learning rate (B2) and readiness to learn (B3): r = 0.181; p > .2 or between B2 and ability to learn (B4): r = −0.264 (p > .16). However, a positive correlation was found between readiness to learn and ability to learn: r = 0.438; p = .018.
Comparison of the Model’s Coefficients with Standard CVLT-II Trial 1, Trial 5, and Trials 1–5 Total Free Recall Total Correct Measures
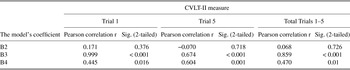
In this section, we show that the model’s measures do not contradict the standard CVLT-II measures, but instead supplement them. A Pearson correlation coefficient was calculated between CVLT-II Trial 1, Trial 5, and Trials 1–5 total correct measures and B2, B3, and B4. The results, given in Table 2, revealed that coefficients B3 and B4 are correlated with all three CVLT-II measures. The highest correlation was found between B3 and Trial 1 measure because B3 and List A Trial 1 values are very close. On the other hand, no correlation was found between B2 and the CVLT-II measures.
Pearson’s correlation coefficients between CVLT-II Trial 1, Trial 5, and Trials 1–5 total correct measures and B2, B3, B4

DISCUSSION
Our current findings show that data from the CVLT-II list A immediate recall fit well with the first order linear system transfer function model we propose. The model is more sensitive with respect to learning data in comparison with subjective visual assessment and can provide a more precise assessment of the learning curve parameters. The measures obtained from the regression analysis of the learning curve do not contradict standard CVLT-II measures. On the contrary, the model’s coefficients provide additional important information. The absence of correlation between the CVLT-II measures and B2 illustrates that the CVLT-II measures cannot assess the time constant of the system in the way that B2 does easily.
The proposed model involves three parameters as well as the independent variable in the form (x-1). A three-parameter model possesses an advantage in comparison with a two-parameter model, for example, a hyperbolic function in the form  (Mazur & Hastie, Reference Mazur and Hastie1978), where y is the amount of learning, t is the amount of training, k is the asymptote for learning, and R determines the rate of approach to this asymptote. A special coefficient in a three-parameter model—B3 in our model—easily allows assessment and comparison of auditory attention span.
Evidence supporting a three-parameter model was recently provided by Zimprich, Rast and Martin (Zimprich, Rast, & Martin, Reference Zimprich, Rast, Martin, Hofer and Alwin2008). They used the hyperbolic function in a form  where y(t) denotes the number of correctly recalled words at recall trial t, α is the upper asymptote of performance, β denotes initial performance at t = 1 that is close to auditory attention span, and γ denotes the learning rate, i.e. the rate of approach from initial level to potential maximum performance.
Comparison of our model with Zimprich and colleagues clearly shows that γ is the same as B2, β is the same as B3, and α is the same as B4. What is especially interesting is that Zimprich and colleagues used an independent variable in the form (t-1). This is the same form which we use — (x-1). Thus, two independent groups of researchers created three parameter models that use the same form of the independent variable. As pointed out by Mazur and Hastie (Reference Mazur and Hastie1978), when three parameters are used the exponential equation and the hyperbolic equation were better able to fit data than other models. Moreover, models based on exponential equations and hyperbolic equations yield similar results.
We believe that the first order system transfer function is a universal model able to describe learning curves in simple learning paradigms in animals and humans as well as some memory tests such as CVLT-II. The first and the second order transfer function models were also successfully applied to the ergonomic assessment of labor skills (Towill, Reference Towill1976).
The number of trials and the number of items in a list can influence the calculated value of the learning rate and ability to learn. Five trials used with the CVLT-II may not be enough for some participants to reach their asymptote. The question of how many trials should be used for a memory test is important and deserves further consideration. On the one hand, the number of trials should be enough for a participant to reach asymptote. On the other hand, too many trials, for example 10 as in Luria’s memory test using ten Russian words, often yielded a learning curve that degraded after the 7th trial. We explain the latter phenomenon as the consequence of fatigue. Our experience suggests that six trials are optimal for assessing the asymptotic value (B4).
The question of how many items should be included in a memory test also deserves discussion. The data we presented on some of our outliers suggest that the 16 items used with the CVLT-II might be not enough for some participants, because they can learn more items. Our analysis suggests that an initial set of 16 items may suffice for most subjects, but that larger sets, for example, 20 or even 30 items, might be needed for some subjects. For example, an initial set could consist of 16 items, an intermediate set of 20 items and advanced set of 30 items. In other words, a precise assessment of the learning curve parameters needs a memory test specially adapted for this purpose.
We hypothesize that B3 reflects mainly working memory and to a lesser degree hippocampal effects. On the other hand, B4 predominantly reflects hippocampal capacity. The positive correlation between B3 and B4 may reflect the hippocampal contribution to each. At this point in our model construction the meaning of B2 is difficult to say definitely. We believe that on the whole B2 reflects the rate of information transfer from working memory to the hippocampus and the rate at which the hippocampus can encode new episodic memories.
Our suggestions of the underlying physiological processes associated with our coefficients receive some support in the literature. It is recognized that the formation of new episodic memory consists of working memory processes and hippocampal processes (Ericsson & Kintsch, Reference Ericsson and Kintsch1995; Squire & Schacter, Reference Squire and Schacter2002; Tulving, Reference Tulving2002). In an fMRI study, the brain regions activated most extensively in an episodic memory task (repetitive learning and free recall of abstract geometric patterns) included the parahippocampal gyrus bilaterally, the hippocampus bilaterally, the middle and the inferior temporal gyrus bilaterally (Grön, Bittner, Schmitz, Wunderlich, & Riepe, Reference Grön, Bittner, Schmitz, Wunderlich and Riepe2002). Some authors suggest that working memory depends on persistent activity in distributed regions of neocortex, including frontal, lateral temporal, and parietal cortical areas that are known to be important in the perception and initial processing of new information (Fuster, Reference Fuster2003; Postle, Reference Postle2006; Shrager, Levy, Hopkins, & Squire, Reference Shrager, Levy, Hopkins and Squire2008).
That values of R squared are rather low in some normal participants should attract interest. We suggest that poor concentration of a participant during the CVLT-II test is one of the main factors influencing the relationship between experimental and model values, although other factors may be at work. We, therefore, hypothesize that deviations of the performance of individual participants from the model constitute an interesting research question. We will study this question in future experiments, especially in participants suffering from memory deficits.
One way to equate attentional factors is to administer an attention test before participants receive the CVLT-II memory test. Several attention tests are available, for example, the Connor’s continuous performance test (Conners & MHS Staff, Reference Conners and Staff2000) or T.O.V.A.—test of variables of attention (Leark, Greenberg, Kindschi, Dupuy, & Hughes, Reference Leark, Greenberg, Kindschi, Dupuy and Hughes2007). Administering an attention test may have the dual benefit of assessing brain attention mechanisms and mobilizing the participant to concentrate his/her attention on the subsequent CVLT-II memory test.
ACKNOWLEDGMENTS
The authors thank their colleagues for taking part in some aspects of this work: Hannah Bruehl, Melanie Rueger, Isabel Dziobek, Victoria Sweat, Aziz Tirsi, Elizabeth Javier, and Alyssa Arentoft. The information in this manuscript and the manuscript itself has never been published either electronically or in print and the authors have no conflicts of interest.