Over the last half century, scholarship on policy feedback has shown that policies are not simply the product of politics; they can also have significant causal effects on politics. Students of policy feedback have demonstrated that policies can influence the development of organized interests, reorient government operations, and shape elite and mass attitudes and behaviors in ways that lend durability to the policy and reconfigure political conflicts.Footnote 1 Classic examples of such consequential policies include Social Security, Medicare, and the GI Bill.Footnote 2
But recent scholarship has also shown that numerous factors must align for policy entrenchment and political reconfiguration to occur.Footnote 3 Not all policies create self-reinforcing dynamics; some produce negative feedback processes that build opposition to a policy's continuance and may eventually prompt formal revision.Footnote 4 At the same time, even policies that are not revised may change over time through less visible processes, such as the shifting use of administrative discretion by frontline policy agents.Footnote 5
The most pervasive of these “subterranean” processes is almost certainly policy drift.Footnote 6 Drift occurs when a policy or institution is not updated to reflect changing external circumstances, and this lack of updating causes the outcomes of the policy or institution to shift—sometimes dramatically.Footnote 7 Drift thus describes a substantial and recognizable change in effects that takes place without a change in formal rules (or their interpretation) due to the transformation of the external context.
Policy drift has been observed and studied across a wide range of settings: the eroding value of standards or benefits not indexed to inflation, such as the minimum wage; the declining scope of public risk protections as stable social welfare programs confront changing socioeconomic conditions; the diminished enforcement capacity of regulatory agencies as the number of inspectors fails to keep up with population growth or changes in the distribution of regulated activities; and the lack of formal policy upkeep leading to functional deterioration in such crucial areas as infrastructure and education policy.Footnote 8 Political scientists now have a methodological toolkit for detecting the observable implications of drift as well as a relatively advanced understanding of the conditions under which it is more likely to occur.Footnote 9
Yet there is a striking gap in this advancing body of scholarship. We know more than ever about why and how drift happens, but we know much less about the consequences of drift for downstream politics—how, that is, this distinctive mode of policy change alters the contours of political contestation.Footnote 10 This is a surprising oversight. Research on drift was largely inspired by theorizing about policy feedback, and drift should have distinctive feedback effects. But despite this intellectual lineage, studies of drift have paid surprisingly little attention to the feedback effects of drift—to the ways in which drift, like the adoption of new policies, may alter institutional arrangements, reshape the universe of organized interests, and recast the dynamics of political action.
This article aims to bridge this gap. We first describe the basic features of drift that make it a characteristic kind of institutional or policy change. Then, we offer a set of theoretically grounded expectations concerning the ways in which drift systematically alters downstream political developments. We focus in particular on organized (or potentially organized) actors who are disadvantaged by drift. Much of the existing work on drift looks at those who are seeking to abet it: the winners, so to speak. Indeed, a major reason why drift is of such interest to political scientists is that it is a low-visibility means by which powerful organized actors can block the updating of broadly popular policies, weakening their capacity to achieve their original goals. We will argue, however, that some of the most profound political effects of drift reflect how its losers, not its winners, respond to the problems and power imbalances it creates.
What do we mean by “losers”? When a policy or institution increasingly fails to function as intended, two broad groups are disadvantaged as a result. The first (and most obvious) is the original backers of the policy or institution—call them “old groups.” Old groups must effectively push back, adapt, or perish. Crucially, however, there is a second set of disadvantaged actors who usually become central to the politics of drift: “new groups” that form in response to the new problems, new constituencies, and new opportunities for organizing that drift creates. In other words, drift doesn't just change the power, strategies, and preferences of existing players; it creates strong incentives for new players to emerge.
In this respect, drift is both mobilizing and constraining. On one hand, it increases demands for new arrangements that can soften its effects, and for new groups that can represent constituencies suffering those effects. On the other hand, it channels actors’ responses in particular directions, delimiting the range of possible paths. Because the drifting policy remains in place, otherwise attractive responses are off the table, and disadvantaged groups—whether old or new—are left to develop second-best solutions. But patches and workarounds are second-best for a reason. Because they must circumvent rather than change the drifting policy, they invariably create new complications and problems, which in turn generate new political dynamics. In this way, drifting policies, like new policies, “create a new politics.”Footnote 11
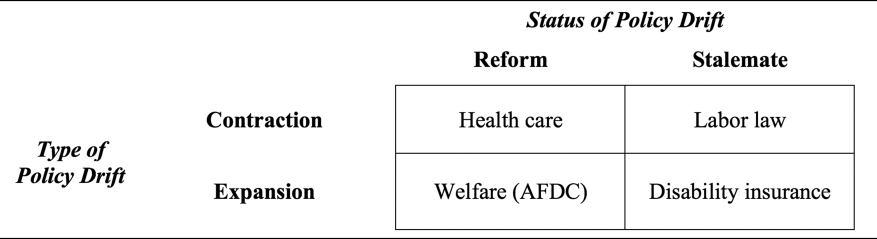
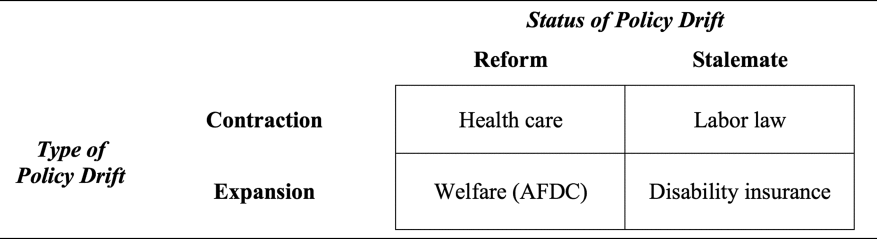
To illustrate and deepen these arguments, we examine four cases of drift: labor law, health care, welfare, and federal disability insurance. Scholars now have a good handle on the factors that contribute to drift. We seek to build on their findings by examining the downstream effects of drift as a source of policy feedback and political change. Thus, all our cases involve drift. Otherwise, however, they differ substantially. In particular, we chose these four cases to maximize variation across two dimensions. The first is whether drift was expansionary (welfare, disability) or contractionary (labor law, health care). The second is whether drift eventually culminated in major legislative revision (health care, welfare) or did not (labor law, disability). Thus, our emphasis is on developmental variation—how our four cases evolved over time. This gives us a wide range of evidence from multiple points in time in which we can see whether our expectations about the politics of policy drift are borne out.
They are. Despite substantial variation across the cases, the same basic dynamics emerge. Because drift, by definition, involves a policy or institution that is fixed in place, old groups are pressured to adapt to the altered effects of a policy or institution, seeking to renew or diversify their sources of institutional survival. Meanwhile, drift creates strong pressures for new groups to enter the field, and because these groups are not closely tied to the original design and generally responding to those least well served by it, they are inherently in tension with old groups. Nonetheless, old and new groups alike must pursue solutions that reflect the constraints imposed by the drifting policy or institution. In general, this means pursuing new institutions or policies that affect the workings of the fixed structure, usually in alternative political venues not blocked by their opponents. Finally, all these processes tend to play out gradually as the consequences of drift become fully apparent. Whether or not drift is ultimately resolved, in sum, we see the same characteristic patterns of policy feedback in response to drift.
To be sure, these cases do not exhaust the full range of possible variation among contemporary examples of policy drift in the United States. We have chosen policy domains that we can follow for an extended period (since drift generally plays out over a long time span) and that have been well studied (to ensure that the basic facts are not in dispute). All four of our cases therefore represent consequential and long-term episodes of drift. However, we also briefly consider a shadow case involving more modest and less durable policy drift: the disparate effects of housing policy on women. Our goal here is simply to assess whether we see some of the same distinctive feedback effects when drift is not as pronounced. We do, though in appropriately more muted form.
By laying out our arguments and interrogating them in the context of these varied cases, we hope to offer scholars a framework for linking the dynamics of policy drift to changes over time in the institutional and organizational landscape. Moreover, by emphasizing how the reactions to drift may generate wholly new problems and political trajectories—sometimes leading to formal policy revision—we seek to highlight and parse one of the fundamental mechanisms through which American politics and policy develop. For American political development (APD) researchers seeking to explain peculiar substantive outcomes and puzzling political trajectories, we think the feedback effects of policy drift warrant much greater attention.
1. Feedback Effects of Policy Drift
Drift is of particular interest as a mode of policy change because it involves a distinctive kind of politics. When a policy is drifting, political actors can achieve major changes simply by doing nothing—or more precisely, by failing to update a policy to keep pace with changing external circumstances.Footnote 12 This also distinguishes drift from other forms of subterranean policy change, such as conversion (the adaptation of a policy to achieve new purposes) and layering (the addition of a new policy on top of an old one that changes the latter's operation). These other modes of policy change involve the active intervention of policymakers who respond to the stability of formal rules by either reinterpreting and repurposing those rules (conversion) or creating new policies or institutions alongside them (layering).Footnote 13
The most theoretically interesting cases of drift involve the intentional blocking of updating by drift's winners. Those who benefit from drift have strong incentives to exploit institutional and power advantages to keep outcomes moving away from prior (and often still broadly supported) goals. Given the status quo bias of American political institutions, updating is generally far more difficult than blocking, and this asymmetry has been magnified by increasing partisan polarization and gridlock.Footnote 14 Moreover, blocking is often an attractive strategy for political actors who want to remain out of the spotlight or pursue unpopular aims, since it is generally not as visible or traceable to particular groups as authoritative revision.
Drift does not require active blocking. Given how hard it is to update policies, policymakers may simply lack a sufficiently large support coalition to overcome the many hurdles thrown up by American political institutions, or they may prioritize other policy changes, leading to deferred maintenance.Footnote 15 Designing and enacting new rules is challenging in the most streamlined and harmonious of contexts, and all the more so in contemporary American politics—which is why policymakers try so hard to include provisions that automatically update rules over time, such as inflation indexing. But even when drift is not an intentional strategy of opponents, authoritative inaction does not preserve the status quo. Over time, as a policy drifts farther and farther from its original purpose, the pressures to update it are likely to become greater, as drift creates mounting costs or benefits for some set of actors.
Who are these actors likely to be? Although the effects of drift can be substantial for large numbers of citizens, existing research suggests that voters are not usually the prime movers. Voters can be crucial in salient cases. Yet their ability to push policymakers toward updating almost always depends on activists and leaders who draw attention to costs and put alternatives on the agenda. Getting voters involved not only requires focusing public attention on inaction, but also making contestable, often complex counterfactual claims (updating would have caused outcome X instead of actual outcome Y). In most cases, then, the key actors seeking to counter drift are pivotally situated politicians and organized groups, and their strategies do not rest on widespread voter awareness or understanding. Indeed, the political dynamics of drift are characterized more by sub rosa political dynamics—involving the “organized combat” of interest groups and policy advocates and the “quiet politics” of private-sector pressure groups—than by open conflicts in high-salience campaigns and legislative drives.Footnote 16
In sum, existing research tells us that policy drift is most likely to occur when political polarization is higher, institutional veto points are more numerous and more binding, and provisions for automatic updating are weaker. We also know that drift is generally a process characterized by contestation between organized interests with long time horizons and substantial resources and expertise. The question is how the characteristics of drift as a mode of policy change should be expected influence downstream politics.
1.1. Four Features Relevant to Policy Feedback
As noted, existing studies have relatively little to say about how drift might generate distinctive feedback effects. We start, therefore, by exploring the core properties of drift and theorizing about the main feedback effects they will tend to generate. These core features are (1) the policy or institution remains fixed in place and authoritative; (2) its effects change; (3) these shifting effects create new problems; and (4) all of these processes are likely to be gradual and relatively hidden.Footnote 17
1.1.1 The Policy or Institution Remains Fixed in Place
We know from existing scholarship that drift swaps the position of those playing offense and defense. In the context of drift, erstwhile opponents (now the winners) find that they can achieve their goals by practicing “the fine political art of producing change by doing nothing.”Footnote 18 By contrast, erstwhile supporters (now the losers) are caught in a bind. They would prefer to update the policy or institution, but to do so, they have to overcome the high hurdles to authoritative action. In the meantime, its rules, proscriptions, and inducements limit their available options.
Under these conditions, losers have incentives to work around extant rules. They are likely to turn to alternative political venues where they are less disadvantaged. When policymaking is stalemated at the national level, this often means turning to state and local government, or to the courts or administrative agencies. Policy losers should be expected to try to use these venues to circumvent the drifting policy or institution, building new policies or new institutions that operate alongside the drifting policy.
Crucially, however, certain responses are unavailable so long as the drifting structure remains in place. To work around it, losers must accommodate themselves to some of its core features. Similarly, moving to alternative venues means confronting different political contexts featuring different policy levers, and this too constrains the kinds of reform that can be pursued. Thus, while drift encourages strategic and policy innovation, it constrains the goals and strategies of those who seek to reduce its adverse effects.
1.1.2. The Effects of the Policy or Institution Change
Drift has a second key characteristic: It produces outcomes that are distinct from those originally envisioned and supported. As the policy or institution begins to “underperform or otherwise fail to function as intended,”Footnote 19 the feedback mechanisms set in motion in the past are likely to be disrupted as well.
Going back to the seminal contribution of Pierson (1993), the two main varieties of feedback effects are “interpretive effects” and “resource and incentive effects.”Footnote 20 Amid drift, the interpretations that once helped to secure the policy or institution are likely to lose their hold, and the nature of its resource and incentive effects are likely to change. These effects are almost always most substantial and negative for organized actors who formed around prior feedbacks. Such groups are the biggest losers. Left in the lurch, they must adapt or perish.
Of course, strategic adaptation is to be expected from any organization.Footnote 21 But in the context of drift, organizational adaptation will likely be aimed at replenishing the mechanisms of support that have been lost. To do so, disadvantaged groups may seek out new revenue streams and experiment with new methods of attracting and retaining members; they may attempt to forge new links to previously discrete policy areas or establish partnerships with previously unrelated allies; and they may devise policy patches and support hybrid alternatives to demonstrate their continued relevance and fortify their position. These defensive efforts—ranging from acts of desperation to shrewd and skillful adaptations—are likely to alter the calculations of other actors as well, setting in motion new political dynamics.
To be sure, heavily invested groups may fail to adapt, or adapt too slowly. There is nothing automatic about the process. But the imperative is straightforward: old groups need to find new sources of organizational nourishment, and their efforts should in turn affect the balance of power among all groups contesting within an affected domain.
1.1.3. New Problems Emerge
Drift not only undermines previous feedback mechanisms, but it also creates new problems and, hence, incentives for new groups to enter the field. By problems, we mean conditions that are viewed as adverse by a substantial number of politically relevant actors. These may include growing public grievances, heightened risks, reduced access to benefits, increasing budgetary pressures, and other consequences that are perceived to be negative. What is crucial is that those adversely affected have incentives to seek redress.Footnote 22
Where might the aggrieved turn for help? Certainly, they can look to organizations already on the ground—if they still exist. But old groups may not be capable of adequately addressing emergent problems, or even of maintaining the legitimacy they once enjoyed as defenders of the policy or institution that is now experiencing drift. As a result, there are incentives for new groups to fill the void. Perhaps the strongest finding in the literature on policy feedback is that policies can “create niches for political entrepreneurs, who may take advantage of these incentives to help ‘latent groups’ overcome collective action problems.”Footnote 23 Since drift creates distinctive policy effects, it should also create distinctive niches.
Depending on the policy area and the particular need or problem, the nature of these niches will, of course, vary. But as a general rule, we should expect that new groups will structure themselves around two imperatives: first, the need to find sources of organizational sustenance—both resources and supporters—not already monopolized by old groups and, second, the need to find sources of legitimacy that are centered on those most conspicuously left behind or otherwise harmed by drift.
1.1.4. Drift Is Generally a Slow-Moving, Low-Salience Process
Finally, all these dynamics should mirror the typically gradual and low-profile process of policy drift. Most instances of drift involve “big, slow-moving processes,” such as population growth, changes in the composition of the workforce, and increases in the cost of living.Footnote 24 These sorts of steady, gradual, and cumulative changes should only slowly prompt the responses sketched above: institutional layering, adaptation among old organizations, and the development of new groups.
Given its slow-moving character, moreover, drift may only be recognized once it is well advanced. By this time, those who want to block updating may be so powerful and the policy space so crowded and complex that the range of options is greatly narrowed. Indeed, because drift does not rely on ongoing political mobilization for its continuance, its feedback effects are likely to be particularly constraining. What emerges should reflect the art of the possible, with the influence of the drifting structure plainly evident in the new forms pursued and achieved.
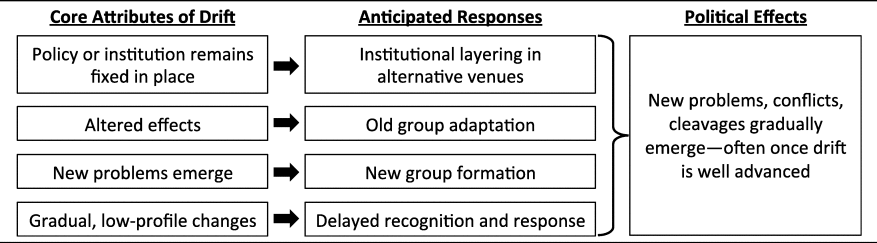
The discussion thus far is summarized in Table 1, which links the core attributes of drift to likely responses from both old and new groups and ultimately to drift's potential political effects. We hasten to add that there is nothing automatic about any of these processes: The need for political entrepreneurship, for example, does not inevitably generate its own supply. But by identifying the incentives at play, we hope to make more tractable the process of identifying drift's feedback effects in particular cases, such as the four we explore in the next section.
Theorizing the Feedback Effects of Policy Drift

2. From Feedback Effects to Political Development
Before moving to the cases, however, we want to briefly place the political effects of drift into a larger perspective. As foundational APD scholarship has shown, even seemingly discrete policy changes do not operate in isolation, but often overlap, collide, and impinge upon one another over time. The study of political development is, in significant part, the study of how structures of authority created at one time and in one context shape and constrain competing claims of authority that emerge out of ongoing political, social, and economic change.Footnote 25
This type of interplay is precisely what we expect in consequential cases of policy drift. Our argument is not just that political actors have incentives to respond to drift. It is that these responses occur on an already densely populated institutional landscape.Footnote 26 With the old policy or institution remaining authoritative in its own sphere, subsequent innovations must work around existing rules and structures. This, in turn, is likely to engender contested policy mandates, contradictory implementation protocols, overlapping constituencies, and conflicting jurisdictions. These clashes may in turn fuel new types of political conflict, negotiation, and mobilization.
The role of American federalism and the constitutional separation of powers is particularly important here. In the U.S. context, venue shopping is almost always a possible response to persistent stalemate in one branch or level of government: When reform stalls in the legislature, for example, reformers may turn to the states, the courts, or executive action to develop workaround solutions.Footnote 27 But second-best alternatives invariably impose trade-offs. The scope for unilateral action by one branch of government, for example, is often limited (e.g., executive orders apply only to executive branch operations; court-ordered injunctions are usually temporary), which can frustrate broader goals. States and localities, in turn, offer uneven policy capacities and differ significantly in their receptivity to reform; in most cases, concerted policy change at the national level is still needed to prevent inequalities of policy access or races to the bottom. In short, the separation of powers and federalism create opportunities to respond to drift, but these alternative routes have shortcomings and often bring about new complications. They are fallback options for a reason.
The relationship between old and new groups is another place where workaround strategies are likely to generate trade-offs. Groups formed around a policy before drift has occurred do not, as a rule, disappear. Often, they remain integral to the new politics that emerges. But as drift reconfigures the political landscape, they may find themselves operating alongside new groups with very different temporal origins and relationships to existing policy. Almost inevitably, these relationships are marked by tension: turf wars, strategic disagreement, even identity conflicts. These tensions are a fundamental feature of the politics of drift, and they are likely to have big effects on whether and how drift is ultimately addressed. In the best case for those seeking to tackle drift, new organizations share similar judgments and goals, thus advancing the potential for reform; in the worst, they end up in conflict with each other strategically or organizationally, thus retarding that potential.
Similar processes can play out on the other side of the conflict. Those seeking to abet drift may fragment, too, as some winners win bigger than others. However, such fragmentation shouldn't have as big an effect on subsequent policymaking as does fragmentation among groups fighting drift. Given how much easier it is to stop rather than promote authoritative change, even a fragmented opposition may be able to hold a drifting policy in place. Nor is there any reason to think that, as the costs of drift mount for one set of actors, those on the other side of the political divide will lessen their blocking efforts.Footnote 28 Those costs are their benefits.
The picture changes, however, when we bring in the political effects of drift. New political dynamics can fundamentally destabilize drift's winners. The emergence of new groups with new demands, the agitation or mobilization of constituencies with the ear of influential political actors, the rise of interjurisdictional conflicts and other knotty problems associated with jury-rigged institutional layering—complications like these can cause winners to rethink the long-term viability of their continued political stance, even when the direct benefits of drift remain substantial. In other words, though drift may still provide material rewards, its political effects may become increasingly negative for those otherwise benefiting. In such cases, winning groups may split over the desirability of continued drift, or even defect to the other side.
Whether these trends lead to formal revision of a policy is another matter. Major reforms come rarely, and their likelihood depends on contingent factors—such as salient crises or other focusing events—as well as more typical, well-studied avenues through which the preferences of pivotal lawmakers change (election of a new president, changes in the balance of partisan power in Congress, etc.). Precisely when policy windows will open is never easy to predict.Footnote 29 But when losers’ responses to drift pose an unacceptable degree of risk for winners—when staying the course threatens to undermine their political influence or cut them out of the policymaking process entirely—the door may open to authoritative reform.
In any case, the defining attributes of drift should factor greatly into this process. Drift fundamentally involves a shifting status quo as fixed policy rules interact with changing circumstances. As the status quo changes, so too should the degree to which contending political actors are willing to support the present policy (as opposed to reform). In the language of spatial models of lawmaking, drift is a process that can change the gridlock interval defined by the relative position of pivotal lawmakers to the status quo, moving the status quo into a region permissive of change even without shifts in the preference or composition of lawmakers. (In practice, big policy changes usually require those, too.) These are what Alan Jacobs and Kent Weaver refer to as “self-undermining feedbacks”—mechanisms through which policies create negative economic and political effects, increasing the chance of their eventual revision.Footnote 30
To be clear, our argument is not that policy drift single-handedly causes these reactions or independently generates the new political dynamics that follow. Undoubtedly, many casual factors are always at play, including both deep structural causes and more proximate ones. Our claim is that in the context of drift, political reactions are likely to be delimited and constrained by the distinctive features of drift itself; the new problems that emerge are likely to reflect these dynamics; and whether and in what way authoritative decision makers eventually respond are likely to hinge, at least in part, on how these dynamics alter the preferences of and relative balance of power between drift's organized winners and losers. In this way, drift acts as a powerful structuring force that refracts and mediates political development.
3. Four Contrasting Cases
To flesh out these dynamics, we turn to four cases of drift. As already emphasized, our goal is to develop our arguments about the political effects of drift, not to explain why drift occurs in the first place. All four of our cases involve consequential drift. All encompass the mid-twentieth century to the present. All broadly concern U.S. domestic social and economic policy. And all have been the focus of substantial analysis.
The cases differ, however, along two key dimensions, as shown in Table 2. First, drift can involve either contraction (in which the policy's or institution's scope/generosity decreases) or expansion (in which its scope/generosity increases).Footnote 31 Within any time frame, moreover, drift can culminate in reform (in which the policy or institution eventually undergoes formal revision) or stalemate (in which drift continues). As Table 2 details, each of our cases involves a different mix of these two alternatives: health care (contraction, reform), labor law (contraction, stalemate), welfare (expansion, reform), and federal disability insurance (expansion, stalemate).
Varieties of Policy Drift
We should emphasize that our cases were not chosen with an eye to the political dynamics that resulted in each. Although two of the cases were ones with which we were already familiar (labor law and health care), we chose them because they are canonical and consequential instances of drift. Two of our cases were ones about which we knew relatively little and required substantial new research. Across the board, however, we found the same basic political dynamics on display in each case.
We think this two-by-two typology does a good job of illuminating the dynamics of drift, perhaps even capturing the bulk of the variation across cases.Footnote 32 Still, in institutional or policy arenas not discussed here, other dimensions may well prove better able to illuminate the dynamics of drift. Moreover, the cases we have chosen all involve highly consequential instances of drift. In this respect, we are limited in our ability to say whether drift has substantial (or any) feedback effects in cases where it less consequential. We do, however, briefly examine a shadow case—housing policy—in which drift occurred but had much more modest effects than in our main cases. We find that drift still produces the same kinds of feedback effects, though they are less dramatic, suggesting that (as with other types of policy feedback) the effects remain similar, if smaller in scope, when resource or interpretive effects are less pronounced.
It is also worth noting that in the four cases we examine, drift is evident to different degrees and unfolds at different speeds and through different mechanisms. For instance, health care presents a complex case in which drift is occasionally expansionary even though it is usually contractionary, and small formal policy changes occur frequently but do not come close to restoring the status quo ante.Footnote 33 Still, we think the core dynamic of the health care case can be summed as contractionary drift leading ultimately to reform. The case of disability insurance also features more than one stage of drift, interspersed with minor amendments, as well as some recent shifts in context that have ameliorated the most problematic aspects of drift. In short, drift will rarely have monolithic or monotonic effects, and this should be taken into account. Indeed, by tracing our cases over long spans of time, we can use this intertemporal variation, alongside cross-case variation, for analytic leverage.
Nonetheless, the similarities across our cases stand out far more than the differences. Despite the many contingent and idiosyncratic factors at work, all four policy arenas reveal the powerful structuring effects of drift. In health care, labor law, welfare, and disability, policies passed in a particular context ceased to function as intended as policy updating failed. Over time, the responses of old and new groups included policy layering, old group adaptation, and the emergence of new groups and interest alignments—whose dynamic interplay constituted a “new politics” characterized by new problems, conflicts, and issue cleavages. In turn, these new political dynamics conditioned subsequent policy conflicts, reshaping the balance of power in ways that altered actors’ support for the status quo. In sum, the basic feedback effects of drift that we have outlined are strongly evident in all four cases.
3.1 Labor Law: Contraction and Stalemate
The National Labor Relations Act (NLRA; the “Wagner Act”) offers an archetypal case of contractionary policy drift.Footnote 34 Enacted in 1935 and revised legislatively only twice since (most recently in 1959), the Wagner Act remains the primary law governing relations between organized labor and business in the private sector. Although unions have repeatedly attempted to update the law to reflect transformed economic conditions, legislators representing business interests have consistently leveraged institutional veto points to prevent significant reforms from advancing through the legislative process, ensuring the maintenance of the status quo.Footnote 35 Although a number of Supreme Court decisions and National Labor Relations Board (NLRB) rulings over the years have incrementally extended the law's reach and enhanced employers’ prerogatives, none of these common-law changes have altered its basic structure.Footnote 36 Thus, a system of regulation designed with New Deal–era industrial relations in mind now governs a twenty-first century global economy.Footnote 37
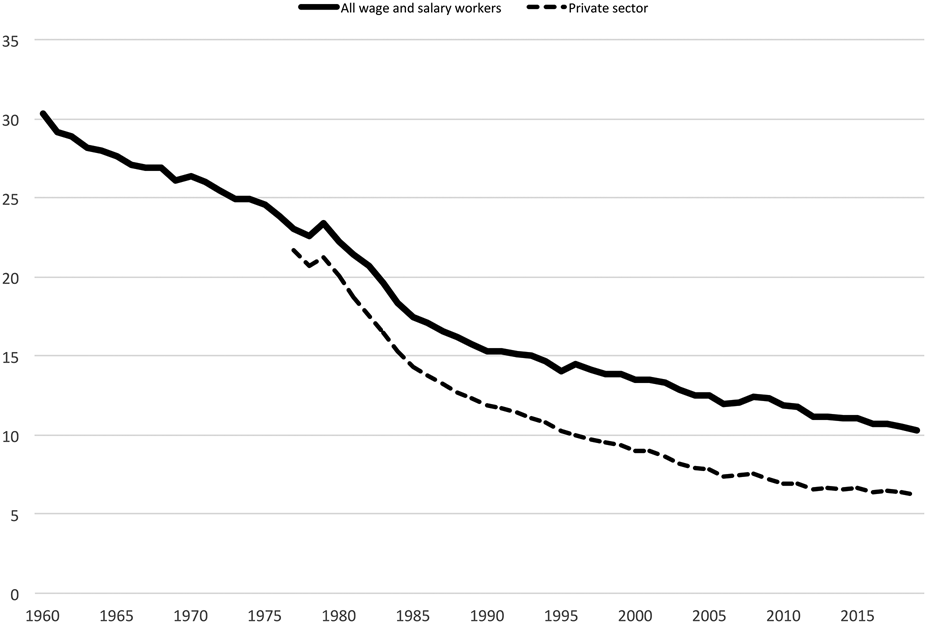
The most visible consequence is the collapse of private-sector unions, the Wagner Act's main focus. By 2018, the percentage of unionized workers in the private sector had fallen to 6.4 percent, down from a highpoint of about a third of all workers in the 1940s (Figure 1). Union decline, in turn, has contributed to wage stagnation and the growing vulnerability of workers to exploitation, discrimination, sexual harassment, and abuse in the workplace, as well as to wage theft, uncompensated injuries, and political pressure on workers to side with employers—with those at the bottom of the income scale and the least bargaining power most at risk.Footnote 38
Union Density Decline, 1960–2019.
Sources: Richard B. Freeman, “Spurts in Union Growth: Defining Moments and Social Processes,” No. W6012 (Cambridge, MA: National Bureau of Economic Research, 1997); Barry T. Hirsch and Macpherson, “Union Membership and Coverage Database from the Current Population Survey: Note,” Industrial and Labor Relations Review 56, no. 2 (2003): 349–54 (updated annually at www.unionstats.com). Note that private sector union density data begins 1977.

The less visible effects are no less profound. Precisely because the Wagner Act has remained fixed in place, it has created a legal black hole that has swallowed potential innovation at the state and local levels. The act has long been interpreted by the Supreme Court as broadly preempting subnational regulation of activities even “arguably” governed by federal law, as well as activities ostensibly left to “the free play of economic forces.”Footnote 39 If subnational governments wish to establish different labor rules, they are permitted to do so only for those workers explicitly excluded from the Wagner Act's coverage, such as public-sector workers (outnumbered by their private-sector counterparts four to one), domestic workers, agricultural workers, and independent contractors. To strengthen rights and protections for private-sector workers, advocates have not simply had to look past the Wagner Act; in other words, they have had to make end-runs around national labor law itself.
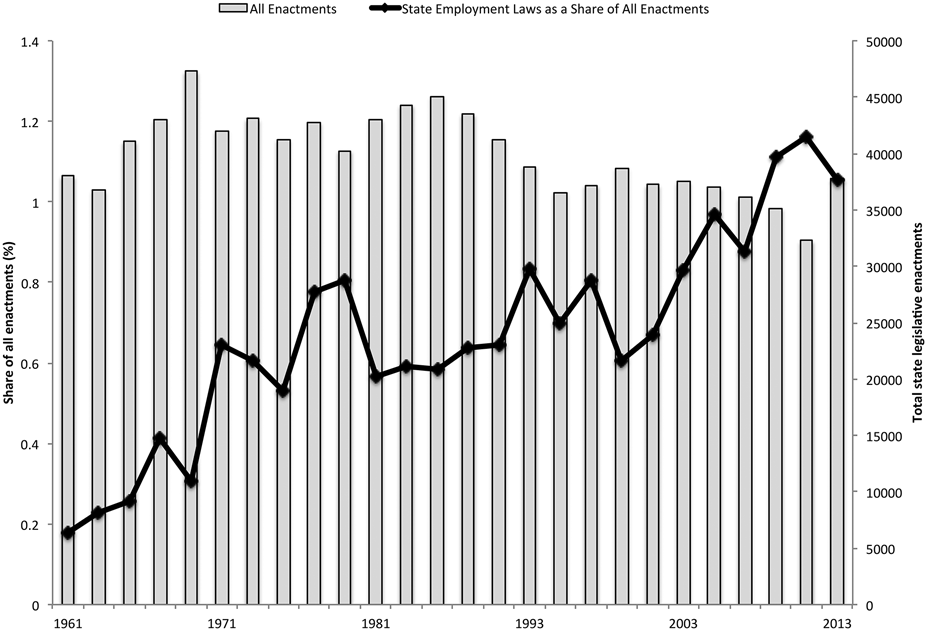
And they have: Increasingly, workers and their advocates have circumvented labor law and developed a range of workaround solutions. The most important are state-level employment laws, which have grown steadily over the last six decades as states have sought to raise minimum workplace standards, establish substantive individual rights, and provide legal and regulatory pathways for workers to vindicate those rights. Indeed, at precisely the same time that labor law has withered, employment law has flourished, proliferating at the subnational level and expanding into new substantive domains (Figure 2).Footnote 40 Rather than determine workers’ wages, hours, and terms of employment through union representation and collective bargaining (as labor law seeks to do), employment laws mobilize the regulatory instruments of the state to enforce higher standards and provide workers with private rights of action—with varying success.
State Employment Laws as a Share of All Enactments, 1960–2013.
Source: Employment law data from Daniel J. Galvin, “From Labor Law to Employment Law: The Changing Politics of Workers’ Rights,” Studies in American Political Development 33, no. 1 (2019): 50–86.

Labor law's drift has also profoundly affected the strategies of organized groups. Private-sector unions long thrived off the Wagner Act's resources, incentives, and interpretive effects.Footnote 41 But as the Wagner Act has grown increasingly out of step with workplace realities, unions have had to adapt and experiment with new strategies. In part, this has involved redoubling their commitment to traditional organizing techniques. In part, it has involved embracing advances in communication technology and social media to help coordinate collective action. And in part, it has involved the use of more disruptive and confrontational tactics that go well beyond NLRA procedures to achieve a broad range of goals.Footnote 42
Unions have also experimented with new organizational forms and invested in new strategies. Notable here are the AFL-CIO's Working America—a “community affiliate” with more than three million non-dues-paying members that is tasked with campaigning on behalf of the union's policy and electoral goals—and the Fight for $15, a massive social movement organized and funded by the Service Employees International Union (SEIU) that mobilizes mostly non-union workers.Footnote 43 Finally, unions have adapted to the new context by leveraging the “purchasing, financial, regulatory, or wage-setting power” of the state to encourage unionization.Footnote 44
Despite such creative adaptations, the non-unionized workforce has continued to grow. Especially with the post-1990s influx of millions of new immigrants, organizers recognized an acute need for advocacy on behalf of these growing numbers of vulnerable workers. Into this void stepped nontraditional forms of worker organization, sometimes called alt-labor.Footnote 45 These new groups have sought to organize and represent workers who are “either by law or practice excluded from the right to organize in the United States”—whether because they are difficult to organize (temp workers, fast-food workers, taxi drivers), legally excluded from labor law's provisions (domestic workers, independent contractors, farm workers, day laborers), or unaware of their rights or fearful of asserting them (nonnative English speakers and undocumented immigrants).Footnote 46
Initially, many of these emergent groups simply sought to aid low-wage, mostly immigrant workers, not advance the cause of labor per se. But as the scale of the problems became increasingly apparent, they began to expand their repertoires and develop new strategies. Alt-labor groups are not structured as, nor do they claim to be, employees’ exclusive bargaining representatives (as per national labor law), although many do take advantage of Section 7 of the NLRA protecting “concerted activities” and encourage workers to unionize.Footnote 47 Their approach has tended to be more confrontational, involving street-front protests, boycotts, and the generation of negative publicity for “low-road” employers. Moreover, these new forms of worker organization have focused on subnational employment laws rather than national labor law, and they have often prioritized building political power and policy influence over more traditional strategies of leveraging economic power.Footnote 48 In the workplace, they seek to empower individual workers and to connect them to other workers experiencing similar problems in similar industries or locations.Footnote 49 In virtually every way, then, the constraints imposed by labor law's drift are reflected in the structures and operations of both old and new groups.
We can also see these feedback effects in the new problems with which the labor movement must now grapple. The most fundamental of these problems arises out of the conflicting assumptions embodied in labor law and employment law. In many cases, for example, union contracts (governed by labor law) mandate that workers with grievances enter into private mediation or arbitration with their employer, thereby depriving them of state-level rights and protections (governed by employment law).Footnote 50 In a similar dynamic, economists have argued that employment laws, by providing for free what workers might otherwise get from unions, diminish the incentive to organize or join unions.Footnote 51 And the conflict is interpretative as well as material: as Nelson Lichtenstein has argued, whereas labor law is designed to foster collective power, employment law is built to redress violations of individual rights—a pathway offering far fewer resources for building solidarity.Footnote 52
Perhaps the biggest problem, however, is that employment law does not resolve the problems generated by labor law's drift. It does not afford employees greater voice in the workplace or do much to redress the inequality of bargaining power. Nor can it ensure its own enforcement or guarantee that workers will have the requisite resources, information, or time to actually vindicate their legal rights. And unlike labor law, employment law lacks mechanisms for building collective power and fostering collective action; consequently, the beneficiaries of employment laws have been unable to defend those very laws against their subversion by opponents. Although employment law offers workers new protections and rights, it compounds other problems created by drift.
Not surprisingly, then, old and new groups have at times come into conflict.Footnote 53 Right-to-work laws and Supreme Court rulings have deprived old-style unions of fair-share “agency fees” from non-unionized workers who benefit from their work. As a result, money to support new campaigns like the Fight for $15 and OUR Walmart (now United for Respect) is more scarce, and newer non-union worker organizations are often seen as cannibalizing limited voluntary contributions. For alt-labor groups, these more straitened circumstances make it harder to find stable, independent revenue streams, increase competition for foundation grants, and threaten not just their expansion but the maintenance of their most basic organizing and advocacy work. In sum, the contemporary labor movement is built on a precarious foundation, with new organizational forms potentially undercutting traditional labor unions in the near term without a concrete, sustainable plan for building collective worker power over the long term.Footnote 54
Taken together, these institutional and organizational developments have simultaneously invigorated and complicated the labor movement, generating new problems without solving those produced by drift in the first place. Yet in each instance, we can readily observe a new politics coming to the fore: Contestation has moved increasingly out of the workplace and into the political arena; it centers around employment law rather than labor law; it involves new forms of worker organization; and it focuses on new problems and tensions. For opponents of policy change—namely, organized employers and conservatives in elective office—these developments have not much changed their power or calculus. As a result, labor law seems likely to continue its inexorable drift until and unless a more left-leaning Democratic Party gains a substantial national majority. In the meantime, the politics of workers’ rights is likely to depend on the ability of workers’ advocates to navigate these overlapping imperatives and constraints.
3.2 Health Care: Contraction and Reform
Health care is a more familiar case of contraction: a story of federal policy stalemate with limited state experimentation and growing problems of access, cost, and quality. Between 1965 (when Medicare for the aged and Medicaid for the poor were enacted) and 2010 (when the Affordable Care Act [ACA], or “Obamacare,” passed), efforts to substantially expand coverage repeatedly failed. Over this forty-five-year interregnum, Medicare expanded to the permanently disabled, and Medicaid expanded to a larger share of low-income citizens. But transformative reforms of America's employment-based health care system eluded would-be reformers again and again.Footnote 55
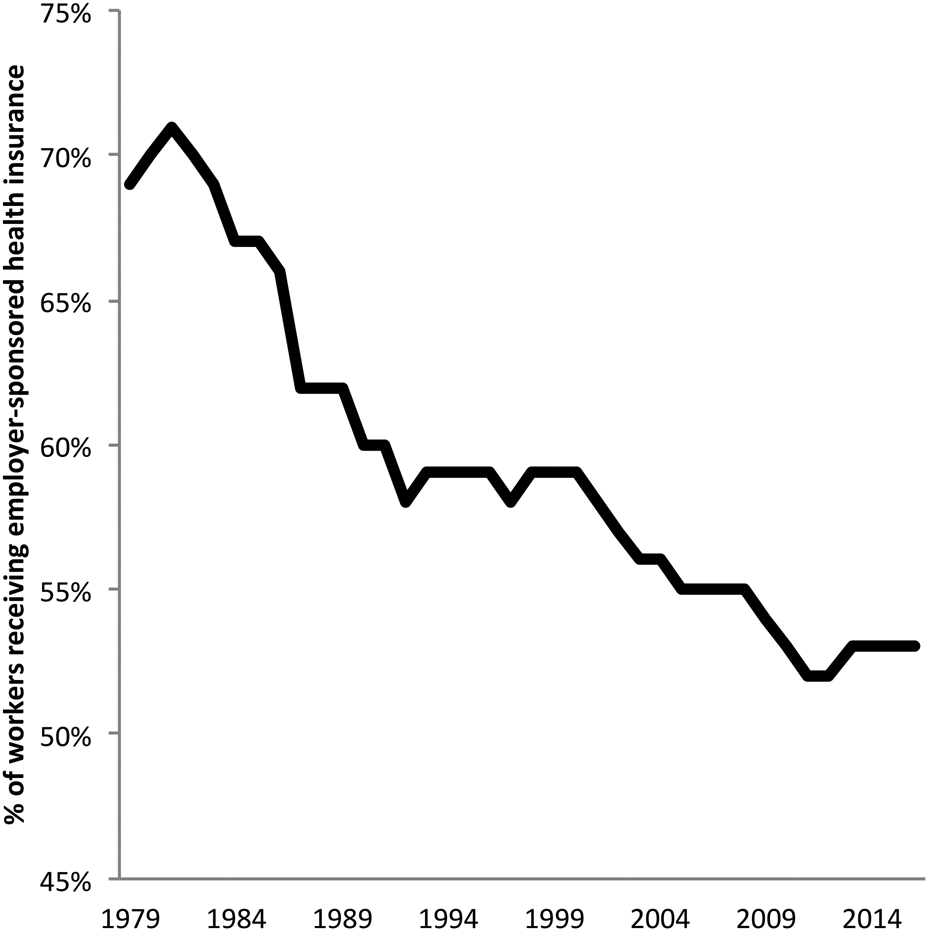
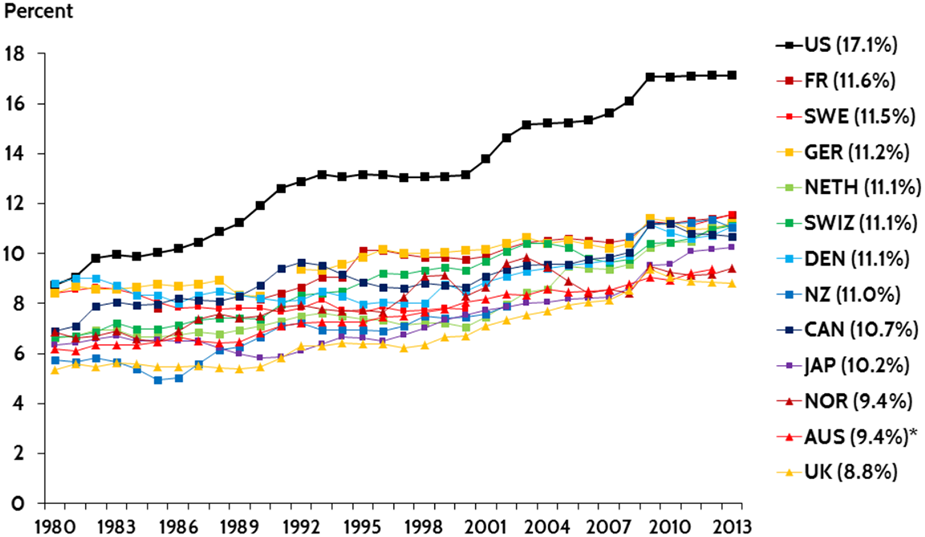
As in labor law, the main fallout occurred in the private sector. The very same trends in the job market that eroded pay, security, and bargaining power also decimated private health coverage. By the 2000s, tens of millions of working Americans were uninsured, tens of millions went without coverage at some point every few years, and nearly all workers faced the prospect of losing their coverage if they lost or changed jobs (Figure 3).Footnote 56 At the same time, costs spiraled upward—unconstrained, as in other rich countries, by the concentrated bargaining power of public authorities (Figure 4). The vicious cycle reached its apotheosis in the late-2000s financial crisis, but its fallout had been apparent for more than two decades, as U.S. medical inflation outpaced that of every other rich nation while the United States fell from the top ranks of global health statistics toward the bottom of the advanced industrial pack.Footnote 57
Eroding Workplace Insurance.
Source: Economic Policy Institute, State of Working America Data Library, “Health Insurance Coverage,” 2019, https://www.epi.org/data/#?subject=healthcov

U.S. Costs in Cross-National Perspective.
Source: David Squires and Chloe Anderson, “U.S. Health Care from a Global Perspective: Spending, Use of Services, Prices, and Health in 13 Countries,” The Commonwealth Fund (October 8, 2015), https://www.commonwealthfund.org/publications/issue-briefs/2015/oct/us-health-care-global-perspective. (Squires and Anderson use OECD Health Data 2015.)

The losers from this contractionary drift were many and varied, but the banner for reform was carried by old groups, particularly industrial unions and their closest organized allies. For the most part, these traditional allies of expanded public regulation and insurance remained wedded to strategies born out of the unsuccessful struggles for national health insurance after 1965. Their proposed workarounds essentially sought to shore up the existing system while also replenishing the feedback mechanisms that provided them with organizational nourishment.
For example, the most powerful elements of organized labor remained generally committed to the employer-based system even as it eroded. Their stance reflected both the material benefits they derived from the existing system (better employer-provided health insurance was something they could deliver) and from their historically constructed “worldview that saw a strong coincidence of interests between labor and business” in traditionally unionized sectors.Footnote 58 Other advocacy organizations that arose in response to existing policies—such as the AARP and groups representing Medicaid beneficiaries—had similarly conditional stances. They were supportive of reforms, but only if they did not threaten to move their favored constituencies into new coverage arrangements or move uninsured Americans into theirs.
As those old groups struggled to adapt to drift, new groups entered the scene as well. Perhaps the most vocal were supporters of big new proposals for tax-financed universal insurance that would replace the employment-based system. These groups ranged from left-leaning Physicians for a National Health Plan to the National Nurses Association to new online progressive groups. Ironically, universal government insurance was the goal of Medicare's architects and advocates back in the 1960s.Footnote 59 But the subsequent conservative turn shattered these hopes and reoriented older advocacy organizations toward more moderate goals. Thus, backers of “Medicare for All” were outsiders in the health policy debates of the 1990s and 2000s, seen by traditional reform groups as useful for mobilizing progressives but also impractically ambitious.
Some organizations featured internal conflicts reflecting the division between old and new groups. The traditional and alt-labor split over labor law was mirrored in the conflict between industrial unions that still prioritized private workplace benefits and those representing service workers, who saw little benefit in a system premised on stable employment and generous negotiated benefits. Similarly, new progressive groups tried to “name and shame” politicians wedded to more modest plans, exacerbating conflicts within the Democratic Party over the best route forward. The new politics that emerged in this issue space thus reflected the interest cleavages and altered political commitments that policy drift generated.
How, then, did these groups largely come together after President Obama's election? The first answer is simply that they shared a common interest in expanding access. Their policy differences were smaller than the conflicts between employment and labor law—they were differences of degree rather than kind. The second answer is that the socioeconomic effects of continued drift made holding onto existing arrangements less and less attractive for old groups while strengthening the commitment and ambition of the new ones. Between 2000 and 2007, in particular, the share of workers receiving health insurance from their employer plummeted by almost 10 percentage points.Footnote 60 In this context, even segments of the labor movement firmly committed to private benefits saw less trade-off between public action and private bargaining.
The most profound changes, however, occurred among the erstwhile winners from drift: the private insurance industry, drug manufacturers, and health care providers. For insurers, the employment-based system was a declining source of income and profits. Most small employers had stopped providing coverage. Most large employers had taken advantage of policy drift to self-insure—that is, pay their claims directly, which limited the role of commercial insurance (similar to labor law preemption, federal law precluded state regulation of such practices, a boon for multistate employers).Footnote 61 At the same time, lucrative new markets were emerging in Medicare and Medicaid, both of which now gave private plans new options to participate and profit by covering program beneficiaries. These privatizing moves had been pursued by conservatives to limit government's role and funnel public dollars to the private sector. But they had the ironic effect of softening insurers’ opposition to major reforms—so long as those reforms didn't threaten their core activities or their ability to rake in federal and state dollars.
Providers, too, were facing heightened costs due to policy drift. Fewer insured patients meant more unpaid bills, and emergency rooms crowded with patients lacking coverage or regular contact with physicians. The efforts of private insurers to squeeze greater profit out of their declining business model also threatened providers—not just with payment cuts, but also greater efforts by insurers to manage care and construct narrow provider networks. Pharmaceutical manufacturers similarly wondered whether insurers would continue to pay for, and patients could continue to afford, their increasingly costly offerings. None of these groups wanted a national insurance program, but none of them liked the drifting status quo much either.
For drift did not simply create economic challenges; it also gave rise to new political dynamics. As old and new reform groups coalesced, those who had resisted such changes in the past feared that hasty or aggressive reforms might actually pass. To the health care industry, calls for Medicare for All posed an existential threat. To a lesser extent, so did plans for a public option that would compete with private insurance for the business of working-age Americans. As major expansions of government insurance gained prominence, health care stakeholders were thus reminded of the old DC refrain: “If you're not at the table, you're on the menu.”
State-based efforts at fundamental reform were another feedback effect. With national avenues of change blocked, states were pressed by advocates to pursue their own reforms. In Massachusetts, reformers on the left pragmatically embraced an idea first floated by policy experts on the right: the individual mandate requiring that individuals obtain coverage (rather than employers—an option probably precluded by federal law). Once again, the constraining effects of drift had led to unexpected reversals of position—and, in a fateful alliance between a Democratic statehouse and Republican governor, to the first state law to achieve near-universal coverage in the continental United States.Footnote 62 Such altered alignments, commitments, and emergent alternatives only further scrambled the political calculus for advocates on both sides.
The story of what happened next is well known.Footnote 63 Note, however, that the content of the 2010 law cannot simply be explained by Democrats’ unified control of Washington or the shock of the financial crisis. Instead, it was the diverse political effects of drift that propelled a particular alliance and solution—one that involved both odd bedfellows and the pragmatic embrace of ideas hitherto rejected by progressive reformers. Essentially, the pressure from the left helped propel elements of the health care industry to work with the center-left to achieve a substantial but highly constrained reform over the unified opposition of elected officials on the right.Footnote 64 With its tailored effort to build on employment-based insurance without displacing it, the ACA bore the unmistakable imprint of policy drift. Likewise, the new politics that have surrounded the ACA since its enactment—in the Trump presidency and likely beyond—reflect its drift-constrained historical construction.Footnote 65
In sum, the case of health care resembles, in broad strokes, that of labor law: Feedback from drift recast political realities—only this time in ways that increased the costs of continued blocking by drift's erstwhile winners. When a window of opportunity for change arose, the new dynamics fostered by drift were sufficient to break the stalemate and allow for formal policy revision, but it was a revision that was highly constrained by these prior developments.
3.3 Welfare: Expansion and Reform
Originally a small part of the Social Security Act of 1935, Aid to Dependent Children (ADC; later Aid to Families with Dependent Children, AFDC) was designed to provide financial subsidies to help single, poor, white nonworking mothers raise their children.Footnote 66 As in the cases of labor law and health care, minor changes to the program's rules and financial structures were periodically made over the years via court decisions and legislative amendments, but the basic structure of the program remained remarkably stable and intact for over six decades.Footnote 67
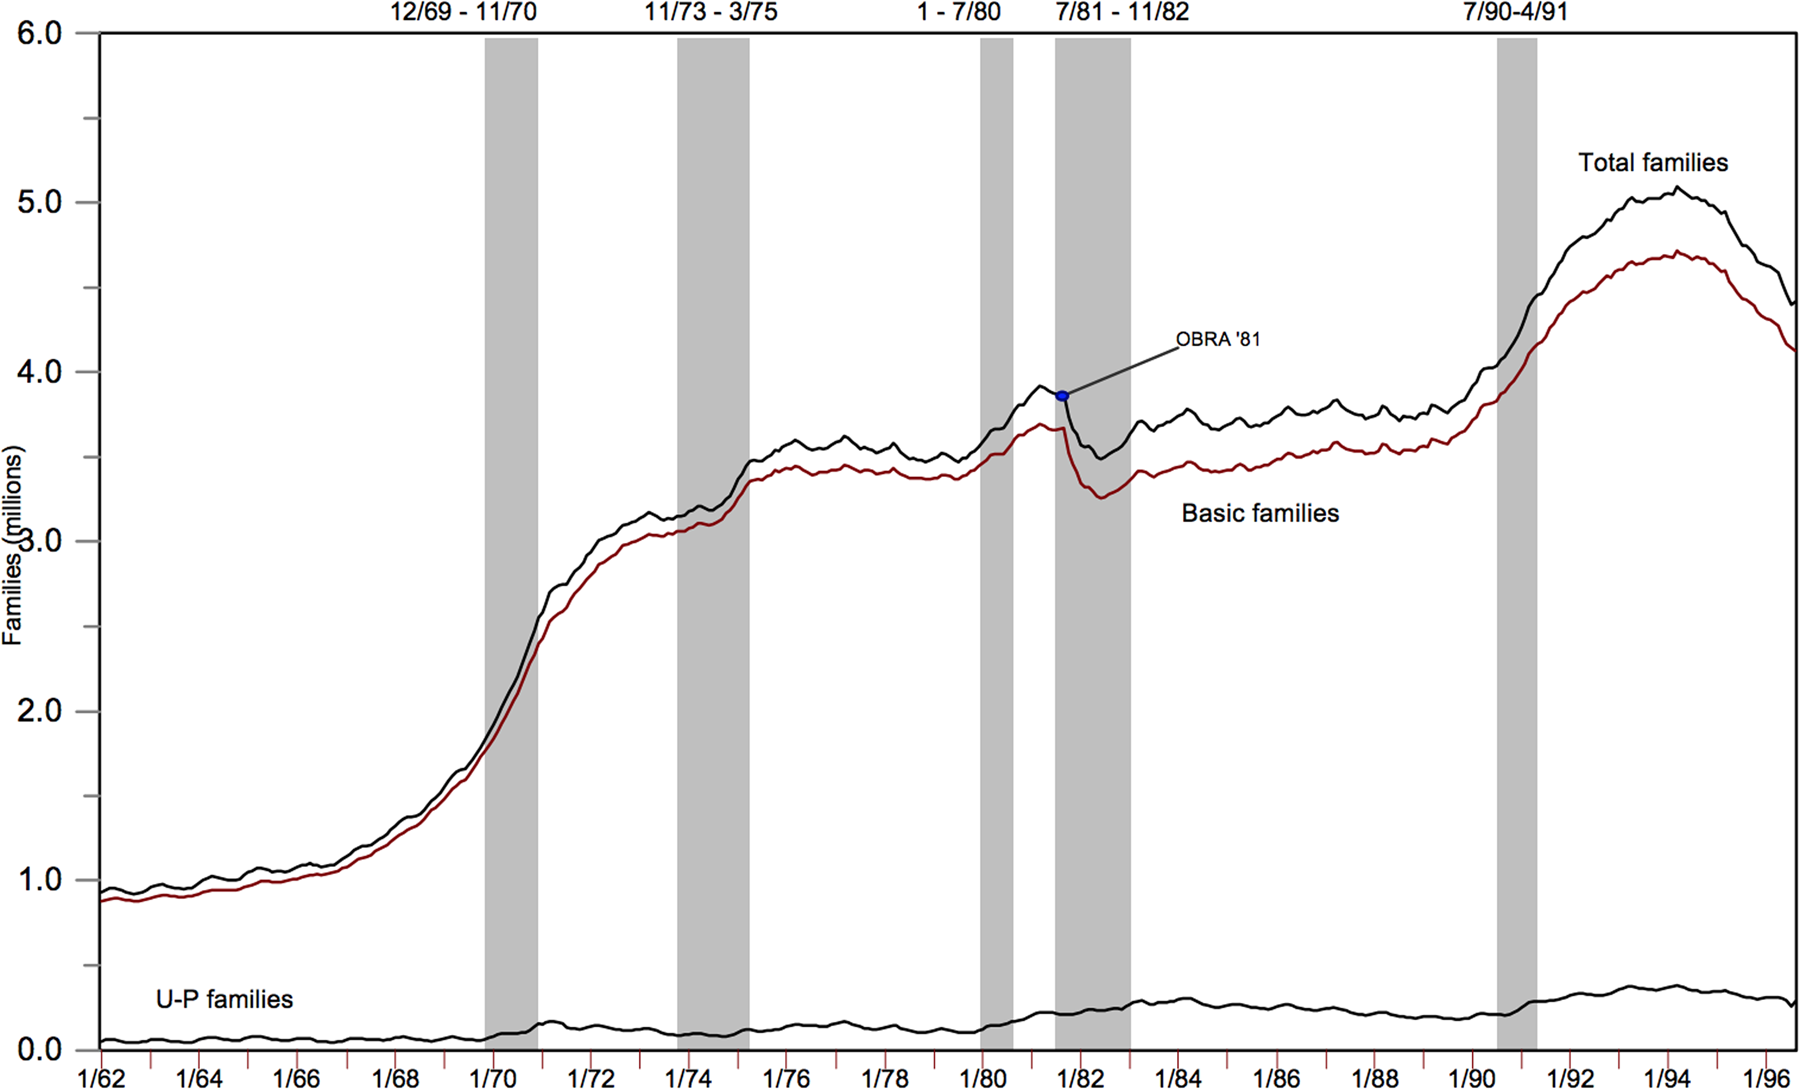
The effects, however, changed dramatically as a confluence of demographic and economic shifts produced a steady increase in the number of families receiving assistance. Between 1962 and 1982, AFDC's caseload more than tripled, and by 1995 the number of families receiving assistance had quintupled (Figure 5). Precipitating causes were many, but included the Great Migration of southern African Americans to northern cities just as the need for unskilled labor in these cities began to decline, changing patterns of marriage and growing numbers of out-of-wedlock births, and the rise of the welfare rights movement and efforts of social workers to reduce the stigma associated with receiving assistance.
Monthly Numbers of AFDC Families Receiving Assistance.
Notes. OBRA = Omnibus Budget Reconciliation Act. Shaded areas are periods of recession. Last data point plotted is August 1996.
Source: Department of Health and Human Services, “Trends in the AFDC Caseload since 1962,” in Aid to Families with Dependent Children: The Baseline, https://aspe.hhs.gov/system/files/pdf/167036/2caseload.pdf, p. 18.

Meanwhile, three interrelated factors conspired to keep the policy fixed in place. The first was continuous Democratic control of the House of Representatives from 1955 to 1995, which allowed the policy's primary partisan supporters to prevent major retrenchment.Footnote 68 Second was a set of policy traps or dilemmas that made change more difficult—especially what Kent Weaver has called the “dual clientele trap,” in which popular penalties for those not working necessarily had unpopular negative effects on needy children.Footnote 69 Third was “elite dissensus,” which Steven Teles defines as the use of extreme, contrasting moral and ethical claims that polarize conflict and perpetuate legislative gridlock despite a public that is more open to compromise.Footnote 70 Other mechanisms of drift operated as well, especially the policy's “severe institutionalized parochialism” and racialized administration.Footnote 71 But the result was the same as in the previous two cases: a mismatch between how the program was conceived and how it operated in an altered social context, leading to the emergence of new problems.
The problems caused by AFDC's drift were widely recognized: The program's high phase-out rate deterred many able-bodied poor adults from working; rather than serve as a short-term fix, it could in some cases cause dependency;Footnote 72 and it was viewed by some as discouraging marriage and encouraging out-of-wedlock childbirths (but viewed by others as fostering women's financial independence and supporting exit from abusive relationships).Footnote 73 AFDC was also said to have “fueled racial stereotypes, bred pathology among the poor, undercut public support for anti-poverty efforts, and put liberals at an ongoing political disadvantage.”Footnote 74 In response, reformers on both sides of the debate began to develop alternatives.
But, as in the previous two cases, with little chance of formal policy revision at the federal level, policy activists venue-shopped their way toward state governments. By design, AFDC had always granted states substantial discretion to interpret rules and administer benefits.Footnote 75 But in the 1980s and 1990s, the Reagan, Bush, and Clinton administrations began to more generously issue waivers to allow states to experiment with more ambitious alternatives.Footnote 76 By Clinton's first term, forty-three states had received waivers, some of which “supported modest demonstration projects, limited to a few counties, but many others [of which] instituted dramatic statewide changes in the AFDC program,” according to the Department of Health and Human Services.Footnote 77 The latter category included total overhauls, such as Wisconsin's replacement of AFDC with “Wisconsin Works W-2,” a welfare-to-work program that emphasized time limits and job placement services while simultaneously making modest new investments in child care, health care, transportation, and training, ostensibly to help ease the transition to work.Footnote 78
These alternative policy designs were clearly shaped by policy drift: To address the same problems as AFDC but through different means, they circumvented the persistent but increasingly problematic federal policy, crafted wholly new policy forms and delivery mechanisms (e.g., job training and placement programs), knitted them together with related but distinct policy issues (such as child care and health care), and linked them all to welfare time limits. These inventive workarounds served as templates for the Personal Responsibility and Work Opportunity Reconciliation Act of 1996 (PRWORA). They also demonstrated that major reform was both possible and politically feasible, contributing to altered interest alignments surrounding AFDC.
As in labor law and health care, the primary old groups that supported the drifting policy made the conspicuous (and characteristic) shift from playing offense to playing defense as welfare rolls expanded. These groups—welfare rights organizations, women's and children's advocacy groups, and Democratic elites—differed with each other on priorities. But all struggled to defend an increasingly unpopular program with increasingly evident weaknesses. As they did, these old groups scrambled to adapt and experiment with new approaches. Some failed and ultimately perished; others adapted with varying degrees of success.
The once-vigorous National Welfare Rights Organization (NWRO) was among the victims of these intense pressures. Immediately after its founding in 1966, it led large, high-profile protests on behalf of “adequate income, dignity, justice, and democratic participation.” But by the mid-1970s, it was internally divided over goals and strategies and institutionally anemic. Some leaders sought to link welfare rights to women's rights issues; others hoped to broaden the movement to include white male low-wage workers. The NWRO ultimately went bankrupt and disbanded in 1975.Footnote 79
Advocacy groups representing women and children met with more success, broadening their coalitions to include “organizations for which welfare reform was a less central concern” but whose support could help magnify their collective influence—such as civil liberties groups, reproductive rights groups, and even pro-life groups, which opposed family caps on the grounds that they would incentivize abortions.Footnote 80 But even with a broader range of allies, these advocacy groups found themselves in “a largely reactive, defensive, and negative role,” generally seeking to highlight “the dual clientele trap by directing attention to the potential harm to children inherent in conservative approaches to welfare reform.”Footnote 81
Finally, many Democratic elites explicitly sought to reposition themselves and their party by fusing conservative and liberal ideas into new hybrid policies that contained both stringent work requirements and significant new investments in health care, child care, guaranteed public jobs, and support with job placement. Clinton's promise in 1992 to “end to welfare as we know it” was central to his and the Democratic Leadership Council's (DLC's) “grand strategic game of realigning the image of the Democratic Party on welfare issues”Footnote 82 so as to “shed an electoral liability, free poverty politics from the crippling effects of racial resentment, and create a public opinion environment more favorable to anti-poverty efforts.”Footnote 83
Opponents of AFDC adapted as well. But what stands out most about the response of the ostensible losers from policy drift (soon to be winners in 1996) was the politicization and mobilization of latent groups. Specifically, “pro-family” conservative groups sought to give voice to a set of concerns that they felt had been left out of the existing debate. Despite efforts by the Reagan administration to incorporate social conservatives into the broader GOP coalition in the 1980s, many still felt alienated from DC politics and believed that their core concerns regarding moral values were only paid lip service by elected politicians.Footnote 84 Their views on welfare were diverse, but by the early 1990s, most had coalesced around deterrence-centered proposals emphasizing family caps and time limits, and became more engaged politically to advocate for their position.
The politicization of these latent groups did not happen automatically. As anticipated in the theoretical expectations laid out earlier, entrepreneurial activity was essential as well. Robert Rector of the Heritage Foundation is often credited with building ideational cohesion among disparate social conservative groups, linking their concerns (about moral decay) to fiscal conservatives’ concerns (about the costs of welfare) and forging ties between the groups and Republican officeholders.
Rector's success in politicizing latent social conservative groups and bringing their influence to bear on the welfare debate hinged on his ability to subordinate the issue of abortion to other family-values issues, focusing instead on the pernicious effect welfare was said to have on the traditional family unit. Arguing that deterrence was the best way to end the “spiritual poverty” inflicted upon children by AFDC, Rector gave social conservatives the moral high ground and made progress toward “weakening the dual clientele trap” that had long helped to perpetuate policy drift.Footnote 85 The constraints of drift were thus evident in the new issue cleavages promoted by the groups (spiritual vs. material poverty) and the new coalitions (business and social conservatives) that together shifted the debate onto new ground and helped weaken the policy traps that had long made conservative reforms more difficult.
The new politics of welfare that emerged in the 1990s thus reflected the institutional and organizational responses to drift and the new problems they created. State-level policy innovations addressed certain problems posed by AFDC's drift (disincentive to work) but traded off core program goals (combating poverty) while giving rise to wholly new problems (e.g., lack of support for child care, the challenges of finding work, and causing women to feel trapped in exploitative jobs). The new politics of welfare featured fractured alliances (e.g., the split between feminists and workers’ rights activists; the division of pro-life groups’ support between child advocacy groups and pro-family conservative groups) and new alignments of issue priorities on both sides (e.g., Democrats and the DLC's “third way”; Republicans and “moral values”). By 1996, this new configuration of political forces left the most committed defenders of the status quo unusually weak and lacking access to traditional institutional veto pivots, thereby rendering the policy more vulnerable to repeal.Footnote 86
The proximate cause of the 1996 welfare reform bill, of course, was the GOP's electoral tsunami of 1994, which handed emboldened conservatives majority control of both houses of Congress. Coupled with Bill Clinton's triangulation in pursuit of reelection, the 1994 election was a precondition for fundamental change. But the final result was also deeply shaped by the new institutional and organizational arrangements that emerged amid AFDC's drift. Those drift-channeled reactions affected the goals and priorities of the 1996 bill, were reproduced in its final design, and have been constitutive of the new problems that have emerged in its wake. Without examining the political effects of welfare's long drift, we can grasp neither why reform rose on the agenda nor why it took the form and generated the particular types of problems that it did.Footnote 87
3.4 Disability Insurance: Expansion and Stalemate
Our final case, disability insurance, differs from the others in that it has involved expansionary dynamics that remain in play. Enacted in 1956, Social Security Disability Insurance (SSDI) was designed to provide financial subsidies for workers who became disabled and were demonstrably unable to work. Intended to be narrow in reach, the program's strict eligibility criteria excluded workers whose ailments could not be clearly defined and verified through objective medical tests. These eligibility rules were subject to minor legislative and judicial amendment over the years, but no major reform has yet generated majority support.Footnote 88 As a result, the “fundamental design” of SSDI “has never been seriously reconsidered,” and its core structures “remain intact, largely untouched by the disability rights movement, the profusion of disability rights statutes, the social model of disability, or attacks on the welfare state.”Footnote 89
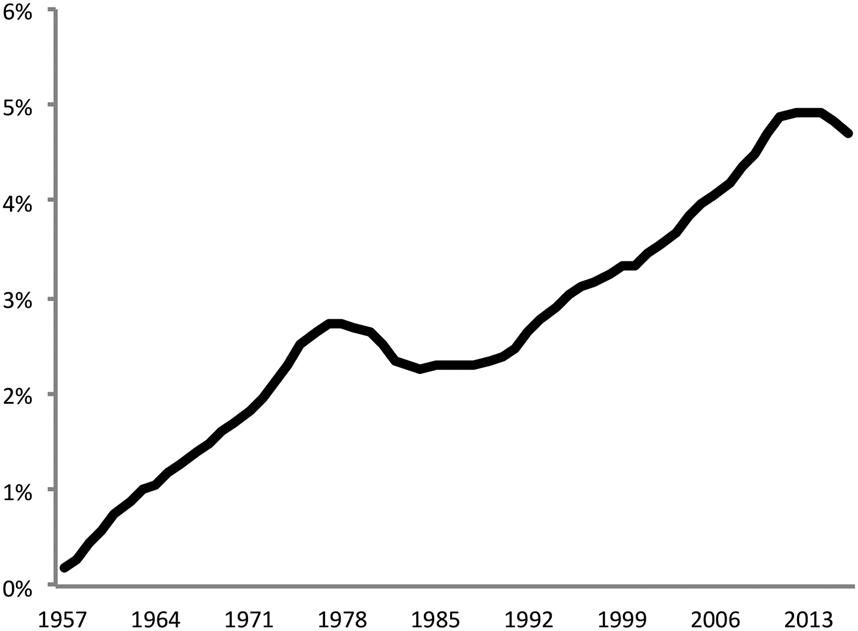
Despite its structural stability, the effects of SSDI have changed dramatically, making it a clear case of expansionary drift. The percentage of the workforce receiving SSDI benefits has grown from 0.18 percent in 1957 to 4.7 percent in 2016 (Figure 6).Footnote 90 In part, this can be attributed to demographic changes that expanded the pool of potential beneficiaries, including the influx of women in the labor force in the 1970s and 1980s, the collapse of the labor market for less educated men in the 1990s, and the aging of the workforce during the 2000s.Footnote 91 But the policy also expanded from the inside out through subterranean efforts by “sympathetic bureaucrats at the Social Security Administration” (SSA) to reinterpret eligibility rules more expansively.Footnote 92 Some of these efforts might be thought of as conversion, but many reflected the simple reality that the administrative protections embodied in the law proved less capable of handling the more complex cases before administrators.
Disabled Beneficiaries as a Share of the Adult Population, 1957–2016.
Source: Number of beneficiaries from Social Security Bulletin: Annual Statistical Supplement (2017), https://www.ssa.gov/policy/docs/statcomps/supplement/2017/index.html. Population estimates from the Current Population Survey (Bureau of Labor Statistics), annual averages, all adults over age 25, https://www.bls.gov/cps/.

As part of the backlash against Reagan's draconian cuts to disability rolls in the early 1980s, Congress passed the Disability Benefits Reform Act of 1984. The act made it more difficult to terminate benefits and required the SSA to develop new evaluative standards.Footnote 93 The agency seized the opportunity to bring about a paradigm shift in the program's operation: whereas old screening practices relied almost exclusively on objective, measurable indicators of impairment, new administrative rules required examiners to thoroughly assess whether the applicant could realistically work—by scouring their employment history, assessing their “functioning,” and giving weight to factors “that could prevent work even if they were not objectively verifiable.”Footnote 94 This shift toward what Jennifer Erkulwater calls the “functional” model (in contrast to the putatively more objective medical model) allowed claimants with even “maladaptive and inappropriate behaviors” to qualify for disability benefits.Footnote 95
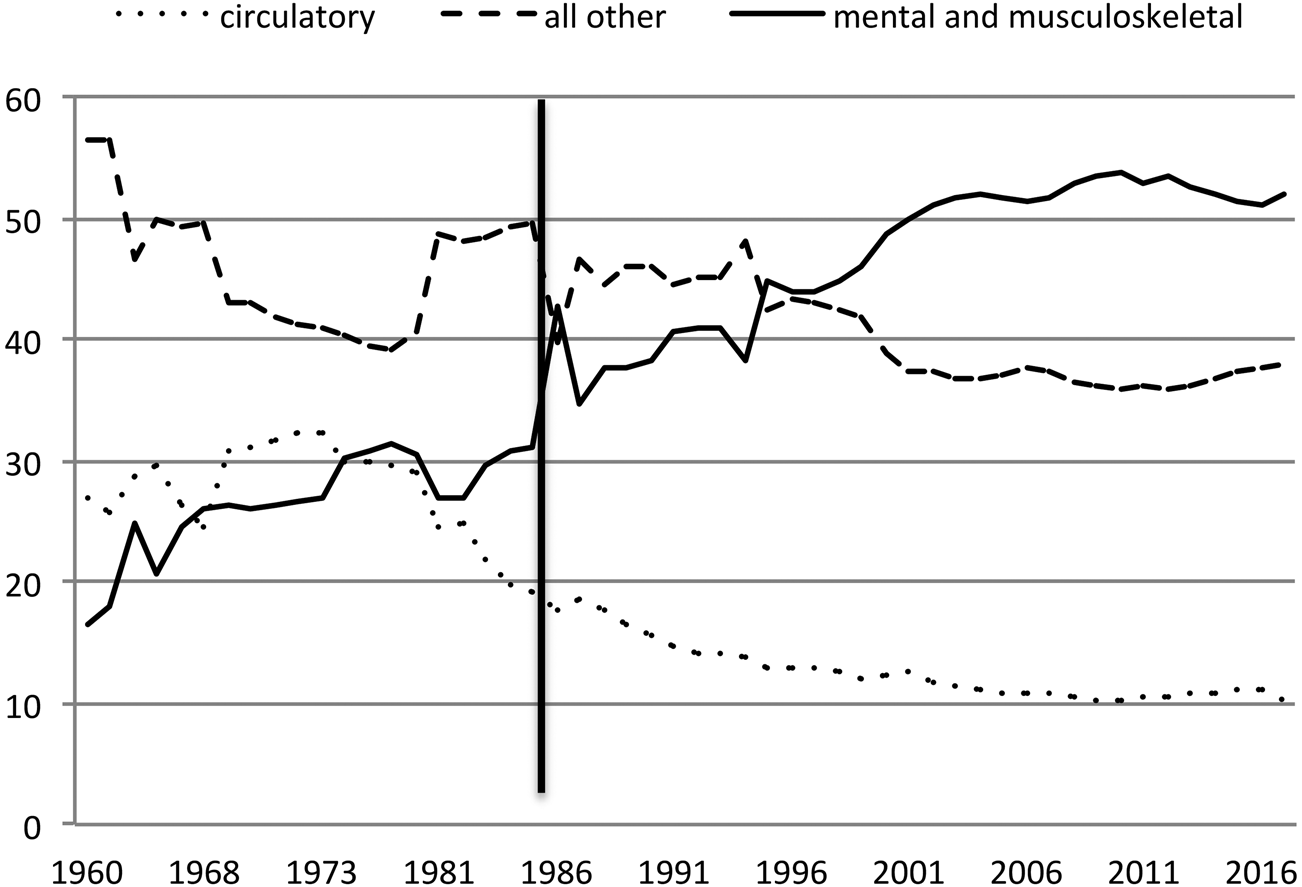
The consequences were immediately apparent. The share of recipients diagnosed with “mental and musculoskeletal” disabilities spiked and then began a steady climb: by the mid-2000s, the share of beneficiaries in that category was over 50 percent, more than all other categories combined (Figure 7).Footnote 96 Because those recipients tended to be younger, they also tended to remain on disability longer, swelling the beneficiary prevalence rate.Footnote 97
Share of SSDI Beneficiaries, by Major Category.
Source: Social Security Administration, Annual Statistical Report on the Social Security Disability Insurance Program, 2017, SSA Publication No. 13-11826. (October 2018), https://www.ssa.gov/policy/docs/statcomps/di_asr/2017/di_asr17.pdf. Vertical line indicates the Disability Benefits Reform Act of 1984.

As prevalence rates climbed, critiques did too. Conservative Republicans like Senator Rand Paul derided the program as “welfare for people too lazy to work.”Footnote 98 Prominent economists, too, have argued that the program has an “ill-defined mission” and is “a fiscal crisis unfolding.”Footnote 99 Critics contend that the program encourages able-bodied workers to remain out of the workforce and fails to encourage employers to make accommodations that might enable disabled workers to continue working. The program is also seen as too expensive, and depending on the assumptions used, its expenditures are projected to continue rising at an unsustainable rate.Footnote 100 Although some of these critiques have lacked empirical support, the debate has persisted, becoming in recent years increasingly politicized and partisan.
As in the other three cases, as the policy has drifted, considerable shifts have occurred in the constellation of groups supporting the policy. But whereas the old supportive groups in the other cases adapted to policy drift by innovating and experimenting with new approaches, in this case, the number of supportive groups proliferated as SSDI expanded. In the 1950s, key supporters included liberal Democratic elites and organized labor; by the 1980s, the volume and scope of supportive groups had grown by leaps and bounds, with many coming into existence because of the policy's expanding reach: groups representing specific disabilities, causes, or issues; groups geared toward self-help and peer support; disability lawyers; nonprofit groups offering support for applicants trying to navigate the bureaucratic process; and disability rights advocacy groups. In short, drift created a large new niche for organizational entrepreneurs seeking to capitalize on both its resource and interpretive effects.
Groups on the other side mainly consisted of business groups that opposed SSDI from the start. Although these groups did not perish (like the NWRO), they mostly abandoned the cause. Business groups “more or less withdrew from opposing SSDI, even as the program expanded,” Thomas F. Burke and Jeb Barnes write, “and have since played only a minor role in the politics of the program.”Footnote 101 In general, the feedback effects of drift for these groups have been too modest to make investing in program reform a major priority, especially given the growing ranks on the other side. Other groups opposing the expansion of SSDI are dispersed and do not constitute organized groups: For example, the cost of the payroll tax is shouldered by workers, “a diffuse and amorphous group.” Budget deficits and rising debt, too, have a famously diffuse impact. As noted, opponents also include prominent antigovernment ideologues and economists, but as of yet, policy opponents’ ranks are thin and have not presented a united front.Footnote 102
More intriguing has been the emergence of new groups seeking to combat related problems left unaddressed by SSDI. In particular, the issues of discrimination and disability rights captured the attention of both the left and the right by the mid-1980s. Arguably, the most important new group to enter this space was the National Council on the Handicapped.Footnote 103 The group began as a project of the Reagan Administration: In 1986, it issued a high-profile report entitled “Towards Independence” that advocated for disability rights and urged Congress to do more to help the private sector offer greater “opportunities and independence for individuals with disabilities.”Footnote 104 Proposed reforms to SSDI focused on integrating rehabilitation and job placement programs with the policy to help disabled persons realize their full employment potential.
On the left, emergent groups promoting the “independent living movement” sought to end the “paternalism and pity” associated with SSDI and related helping professions.Footnote 105 These new advocates sought to reform rather than replace SSDI, since it was seen as providing the resources many disabled persons needed to be autonomous and live with dignity.Footnote 106 In combination with independence advocates, this odd-bedfellows coalition shared enough common ground to mobilize collectively for policy change, but not enough to alter the fundamental structure of SSDI. As a result, SSDI was left alone, and a wholly new institutional form—the Americans with Disabilities Act of 1990 (ADA)—was layered alongside it.
A descendant of the civil rights era, the ADA prohibits discrimination on the basis of disability and guarantees equal access to public accommodations, employment, transportation, government services, and telecommunications. Similar to the distinction discussed earlier between employment law and labor law, the new law sought to address the same basic set of problems as SSDI but through different means and mechanisms—through litigation and regulation rather than direct cash subsidies (as with SSDI).
But as in the other cases, the development of workaround solutions to address new or resurgent problems generated a whole new set of problems without resolving the problems associated with drift in the first place. As Burke and Barnes explain, the “tense layering”Footnote 107 of SSDI and ADA is due to
different ideas of disability (medical versus social model), different partisan coalitions (a liberal coalition among Democrats, administrators and beneficiaries as opposed to a bipartisan coalition among disability activists and small government conservatives) and different operational logics (a federal-state agency structure versus a regime that primarily uses private enforcement through litigation).Footnote 108
Like the other cases, the layering of new ideas, coalitions, and administrative regimes alongside the old did not result in harmonious coexistence but rather an awkward juxtaposition. The friction between two contrasting definitions of disability and different perspectives on the role of social benefits (provided by SSDI) in promoting independence (embodied in ADA) generated a new institutional politics. The different layers “continue to rub up against each other,” Burke and Barnes write, “forcing policymakers to ‘muddle through’ contradictions.” In addition, attorneys have used SSDI's narrower definition of disability as a cudgel against ADA's broader one, arguing, for example, that employers need not accommodate disabled former employees who have since been accepted into SSDI because they must be unable to work.
Despite its best efforts, the Supreme Court failed to resolve these contradictions with its highly anticipated Cleveland v. Management Policy Systems decision in 1999 (526 U.S. 795). Rather than carve out legal space for workers who, after becoming disabled, may simultaneously seek both reinstatement with accommodation and disability benefits, trial-court judges were left to “make policy on a case-by-case basis,” thereby producing even more incoherence.Footnote 109 This uncertainty, paired with a diffuse opposition, has made the prospect of comprehensive reform all the more unlikely. Sensible solutions advanced by policy experts propose to link disability policies to multiple additional policy arenas (such as job training, support services, transportation, housing, and health care), thereby layering new political and policy complications atop SSDI's existing complexities and requiring ambitious new investments. Even the most hopeful advocates acknowledge it would be far more expensive to implement such changes than simply to maintain the current system and watch it grow.Footnote 110
The financial pressure for change may have lessened in recent years as well, since in 2019, the Annual Report of the Board of Trustees of the Federal Old-Age and Survivors Insurance and Federal Disability Insurance Trust Funds stated that the Disability Insurance Trust Fund “is projected to be able to pay full benefits until 2052, 20 years later than indicated in last year's Social Security report.”Footnote 111 For the time being, then, SSDI appears likely to remain fixed in place, advancing certain goals while undermining others, generating a new politics around its continued drift.
4. Housing Policy as a Shadow Case of Modest Drift
The four preceding cases all represent major instances of drift, in which policy moved far from its original purposes over time. But what about cases of relatively modest drift, in which briefer periods of stalemate are punctuated by more frequent formal revisions to address emergent problems? A large number of policies, ranging from tariff and tax levels to defense spending, likely fall into this category. Do these cases exhibit the same basic dynamics we have seen in the cases of labor law, health care, welfare, and disability? In areas where policymakers update a policy on a more regular basis, yet some drift nonetheless occurs, should we see also see some degree of institutional layering, organizational adaptation, and group formation over time?
We think the answer is yes. So long as drift switches the position of opponents and proponents and gives rise to new problems, the same dynamics should emerge, albeit in a more muted form. A good illustrative case is housing policy, which Chloe N. Thurston examines in her book At the Boundaries of Homeownership. As Thurston explains, since the federal government created the hybrid public-private mortgage and credit markets in the 1930s, the rules governing access to credit have systematically excluded certain groups of citizens.Footnote 112 As late as the 1970s, for example, women were explicitly treated as higher credit risks than men and systematically denied mortgages. The ostensible economic rationale behind these discriminatory practices centered on anticipated disruptions in women's incomes due to pregnancy, childbearing, and family care responsibilities. Yet it also relied on faulty measures of women's credit scores as well as stereotypes about women's abilities to maintain their homes and retain their market values.
In the 1960s and 1970s, however, these policies came under pressure due to drift. Discriminatory practices were increasingly at odds with, for example, women's rising labor-force participation, growing evidence that women actually posed less of a credit risk than men, and the conspicuous lack of evidence linking pregnancy to foreclosure. In short, the unfounded assumptions on which lenders relied to pursue the core goals of U.S. housing policy increasingly ran afoul of the basic aim of extending credit to qualified applicants.Footnote 113
As women and their advocates came to recognize the state's role in legitimizing their exclusion, they began to mobilize across a range of venues (applying regulatory pressure, filing lawsuits, pushing for legislative change, and conducting administrative oversight) to expose and contest lenders’ market-based rationales and challenge existing practices. Policy drift in this area, in other words, was punctuated by the mobilization of women positioned just outside the boundaries of access, which Thurston calls “boundary groups.”Footnote 114 Private lenders, who had the greatest stake in the status quo ante (the winners), sought to adapt and delay so as to maintain their market position and preserve their flexibility and discretion in assessing risk, only partially acceding to new demands. Ultimately, drift came to an end with the enactment of the Housing and Community Development Act and the Equal Credit Opportunity Act of 1974, which prohibited discrimination on the basis of sex in housing or any other type of lending.
Even in this case of relatively modest, contractionary drift that ultimately resulted in formal reform, the anticipated responses theorized in Table 1 are apparent, albeit in diluted form. First, layering: Although the losers did not engage in outright institutional layering to circumvent the drifting policy, women's groups did do a fair amount of venue shopping and searching for alternative forms of leverage—pushing, for example, for procedural and regulatory changes when the barriers to statutory change appeared too high and creatively mobilizing along multiple fronts to achieve their aims.
Likewise with old group adaptation: Although the responses of those with the greatest stake in the status quo ante (private lenders) were less prominent than in our four core cases, they found themselves on the defensive, scrambling to identify and lock in new revenue streams and alternative sources of organizational nourishment to enable them to survive and endure policy changes.
Similarities are also evident in the emergence of new groups in this policy space: second-wave feminist advocacy groups like the National Organization for Women (NOW) and others were not new—these were preexisting or latent groups already working to advance women's rights in other domains—but they responded as expected to their constituents’ demands for advocacy by moving into the housing policy niche for the first time, reorienting their operations around resolving their constituents’ collective action problems, and lobbying government for authoritative policy changes. Thus, even in this case of relatively modest drift, where the duration of drift was truncated, we see an attenuated version of the same basic political dynamics that appeared in the four core cases.
5. Conclusion
Drift is among the most pervasive ways in which policies or institutions change in our increasingly polarized political system. Failing to update policies or institutions when they cease to function as intended is a powerful way of altering their impact. And yet, we know surprisingly little about how drift reshapes politics over time. The growing body of research on policy feedback tells us that big policies have big political effects. The smaller but also expanding body of research on drift tells us that failing to update policies or institutions in the face of changing circumstances can have profound consequences for those who depend on their benefits or pay their costs. Yet the feedback effects of drift—the way these profound consequences reshape politics—remain largely unexplored.
In this article, we have sought to bridge this gap by providing both a broad conceptual map and a series of focused case studies. In our map, what makes drift distinctive is that the policy or institution at issue is stuck in place. This, in turn, leads to consistent yet countervailing effects. On the one hand, the problems created by drift encourage political actors to focus on alternative venues and to develop new institutions, organizations, and strategies. On the other hand, the constraints imposed by drift channel these responses in certain directions rather than others. In particular, drift encourages policy layering, the adaptation of old groups, and the emergence of new groups in response to new problems. It is this Janus-faced combination of continuity and change that marks the imprint of drift across otherwise-varied policy domains.
In each of our four cases, we see developments distinctive to that domain. Yet in each, we also see the core attributes of drift at work, shaping the political calculus of actors and groups on both sides and ultimately the resulting political dynamics as well. The imprint of drift appears in the new workaround solutions crafted by reformers, in the innovative but highly constrained adaptations of old groups, and in the substantive goals and operational strategies of newly emergent organizations. These distinctive political effects are, of course, clearest in the cases in which drift was never addressed through formal policy updating. But even where big reforms finally broke through, the animating organizations and coalitions and the policy departures they produced all evidence drift's powerful influence.
In the two cases of stalemate (labor law and disability insurance), drifting policies came together with institutional innovations—employment laws and the ADA, respectively—to generate dueling incentives and doctrinal abrasions that served to undercut efforts at reform. State employment laws, for example, offered new rights to individual workers but did not provide anything like national labor law's mechanisms for generating collective action. Similarly, the dueling definitions of disability embodied in SSDI and the ADA divided the coalitions supporting each policy and made comprehensive reform all the more difficult.
In some cases, reform did ultimately materialize (welfare and health care). Even here, however, the solutions were only partial and highly circumscribed, reflecting the limited common ground on which the tenuous new winning coalitions could be built. In tackling the perception that welfare policy disincentivized work, the reform coalition failed to address persistent problems of poverty, created new problems regarding child care, and left unaddressed many of the challenges poor women face in the capricious and precarious low-wage labor market. In health care, the design of the ACA reflected the varied interests of key stakeholders in temporary alliance and their limited room to maneuver at a particular moment in time. The result was a weaker-than-expected support coalition that ultimately protected the law against repeal but could not prevent opponents from chipping away at its design and administration year after year.
In short, each of these cases reveals drift as an important driver of political development, triggering reactions that shape downstream politics while constraining those dynamics in identifiable ways. We make no claim that the effects highlighted here exhaust the possibilities. But we do think they are emblematic of how political development occurs in the dense policy environment of contemporary politics. More important, we believe they provide new insights into how even subterranean policy changes can fuel significant shifts in the political landscape over time. The implications extend well beyond American politics research: They are applicable to any polity in which the updating of institutions or policies is constrained by counter- or super-majoritarian institutions, powerful organized actors, or both.
The political effects of policy drift are a window into the dynamics of power and resistance in a polarized age of big government. In many respects, what is visible through the window must be troubling to those who believe policies or institutions should be responsive to democratic majorities. Drift reveals a means of wielding power that is most favorable to highly resourceful and organized actors, occurs in large part outside the public eye, and often leads to sclerotic government seemingly untethered from present-day realities. Yet drift also reveals a politics of innovation in which new approaches, new groups, and new alliances form out of a crucible of mounting challenges—and sometimes bring policies closer in line with what citizens demand. In such constrained but often consequential contestation, the arc of political development is forged.