INTRODUCTION
In cattle, thermal stress from either heat or cold may result in large losses in production. Physiological responses to heat stress include cutaneous vasodilation, sweating, increased respiration and decreased feed intake. An initial reaction to increased environmental temperature is vasodilation, which increases blood flow to the surface of the skin to bring warm blood in close proximity to the skin surface and thus increase heat loss through convection (Finch Reference Finch1985). Increases in sweating and respiration rate also increase latent heat loss in the animal (Allen Reference Allen1962; Thomas & Pearson Reference Thomas and Pearson1986; Gaughan et al. Reference Gaughan, Mader, Holt, Josey and Rowan1999). Ultimately, if physiological processes cannot compensate for the excess body-core heat, a decrease in heat production can be achieved through decreased feed intake (Brown-Brandl et al. Reference Brown-Brandl, Nienaber, Eigenberg, Hahn and Freetly2003; Beatty et al. Reference Beatty, Barnes, Taylor, Pethick, Mccarthy and Maloney2006). Increasing heat loss through increasing vasodilation and respiration and sweating rates also increases the maintenance requirement for the animal, and decreasing feed intake further limits the amount of energy and nutrients directed towards tissue growth or milk production. The increased maintenance requirement and decreased intake lead to a decrease in animal performance (Blackshaw & Blackshaw Reference Blackshaw and Blackshaw1994; Mitloehner & Laube Reference Mitloehner and Laube2003), which results in an economic loss for producers.
Because of the economic losses associated with heat stress, temperature–humidity indices (THI) were created to estimate level of heat stress of the animal. The THI, proposed by Thom & Bosen (Reference Thom and Bosen1959), takes into account temperature and humidity to determine the level of heat stress for the animal. However, these indices do not account for physical processes behind the phenomena and therefore have limited capacity in predicting dynamic changes in body-core temperature, physiological and production responses and in evaluating different mitigation options. Therefore, a model that simulates heat flow between the animal and its environment, and heat production by the animal, can be useful to understand mechanisms of thermal stress, improve prediction of losses in animal performance and, therefore, evaluate the effectiveness of possible management interventions.
The objective of the current work was the creation of a dynamic, mechanistic model to:
• estimate major flows of heat into and out of a bovine
• use heat balance to calculate changes in body-core temperature for growing and mature B. indicus and B. taurus in response to climatic factors: air temperature, relative and vapour pressure, radiation/shade and wind.
MATERIALS AND METHODS
Model design
A dynamic model, rather than a steady-state model such as that of Turnpenny et al. (Reference Turnpenny, McArthur, Clark and Wathes2000a, Reference Turnpenny, Wathes, Clark and McArthurb), was developed since experimental results (e.g. Brown-Brandl et al. Reference Brown-Brandl, Eigenberg, Nienaber and Hahn2005) have shown that variables such as body-core temperature and respiration rate lag behind changes in environmental variables such as ambient air temperature and incident solar radiation by several hours.
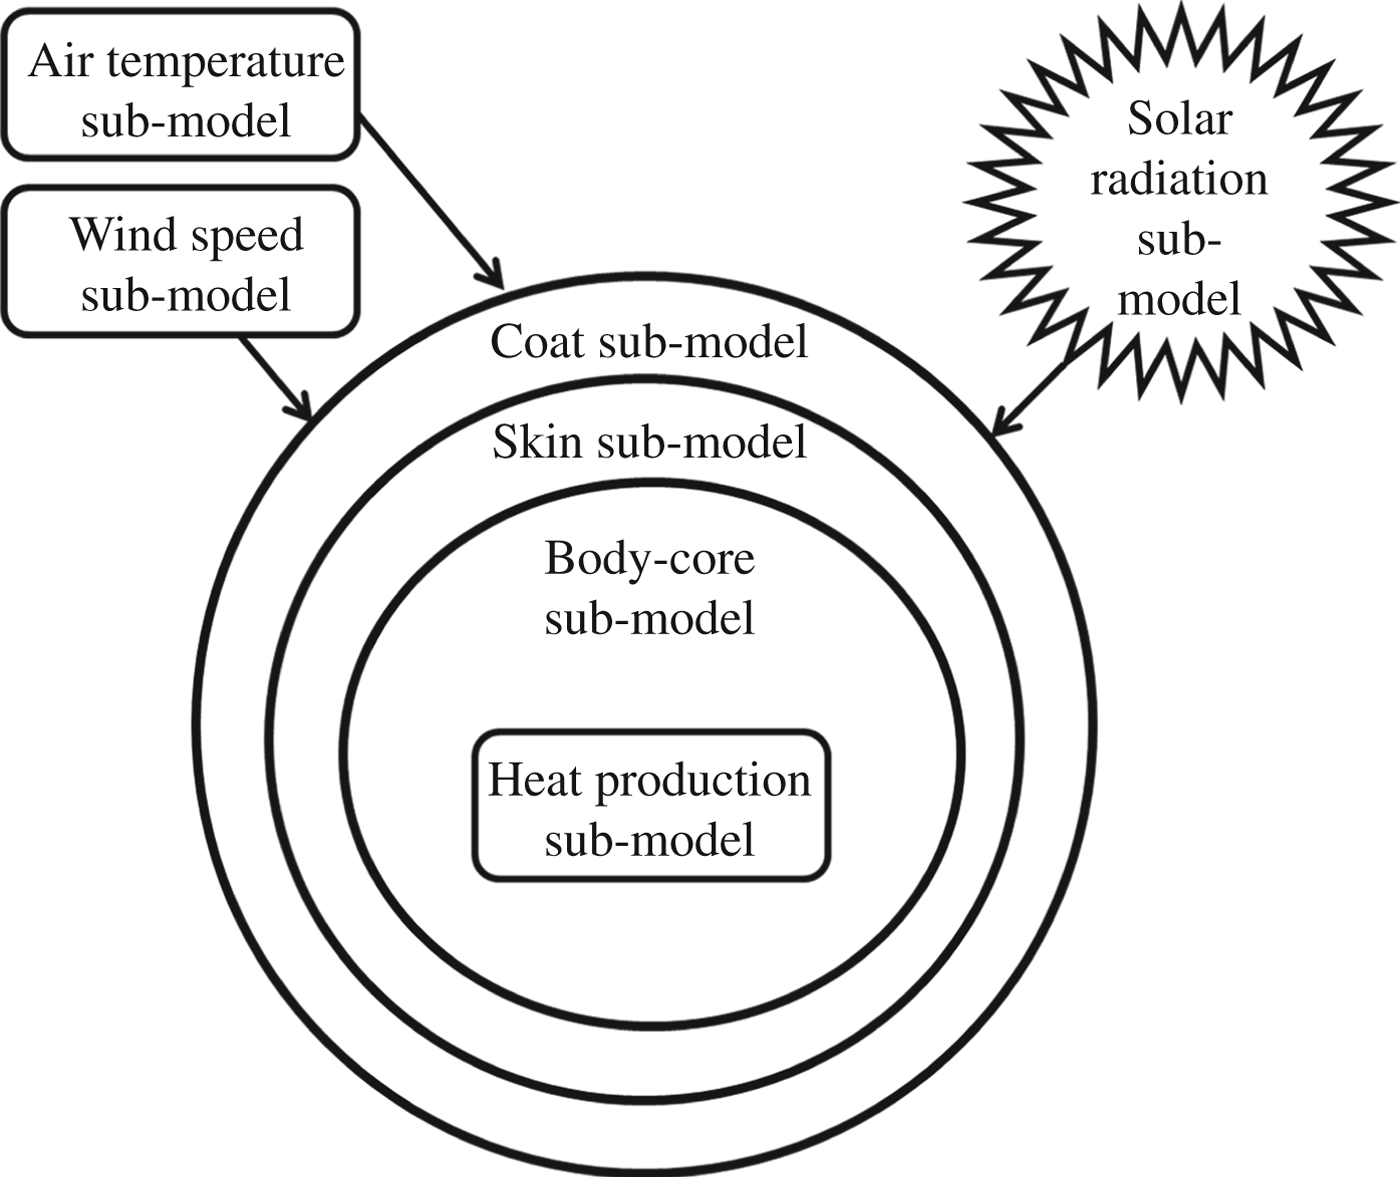
The heat balance model is a three-node model with three state variables: heat contents for body core, skin and coat. Figure 1 shows an overview of the model with all of the flows. A number of three-node heat transfer models have appeared in the literature over the years (see, for example, Porter & Gates Reference Porter and Gates1969; Vera et al. Reference Vera, Koong and Morris1975; Bakken Reference Bakken1976; McGovern & Bruce Reference McGovern and Bruce2000). Similar multi-node models have appeared in the human thermal model literature, for example: Stolwijk & Hardy (Reference Stolwijk and Hardy1966), Gagge et al. (Reference Gagge, Stolwijk and Nishi1971) and Huizenga et al. (Reference Huizenga, Hui and Arens2001). The present model is similar to that developed by Gagge et al. (Reference Gagge, Stolwijk and Nishi1971), which is also known as the Pierce model (Gagge & Gonzalez Reference Gagge, Gonzalez and Terjung2010). The Pierce model is often called a two-node model, although in reality it contains a steady-state energy balance for clothing (for cattle: coat) temperature (Doherty & Arens Reference Doherty and Arens1988). The Pierce model continues to be applied in problems such as automobile comfort (Kaynakli & Kilic Reference Kaynakli and Kilic2005) and exercise physiology (Takada et al. Reference Takada, Kobayashi and Matsushita2009).
Overview of the Thompson model. The three concentric circles represent the three layers of the animal: the body-core, skin and coat sub-models. The heat production sub-model is within the body-core. The solar radiation sub-model gives heat to the coat sub-model. The air and wind speed sub-models directly affect all three layers of the animal.

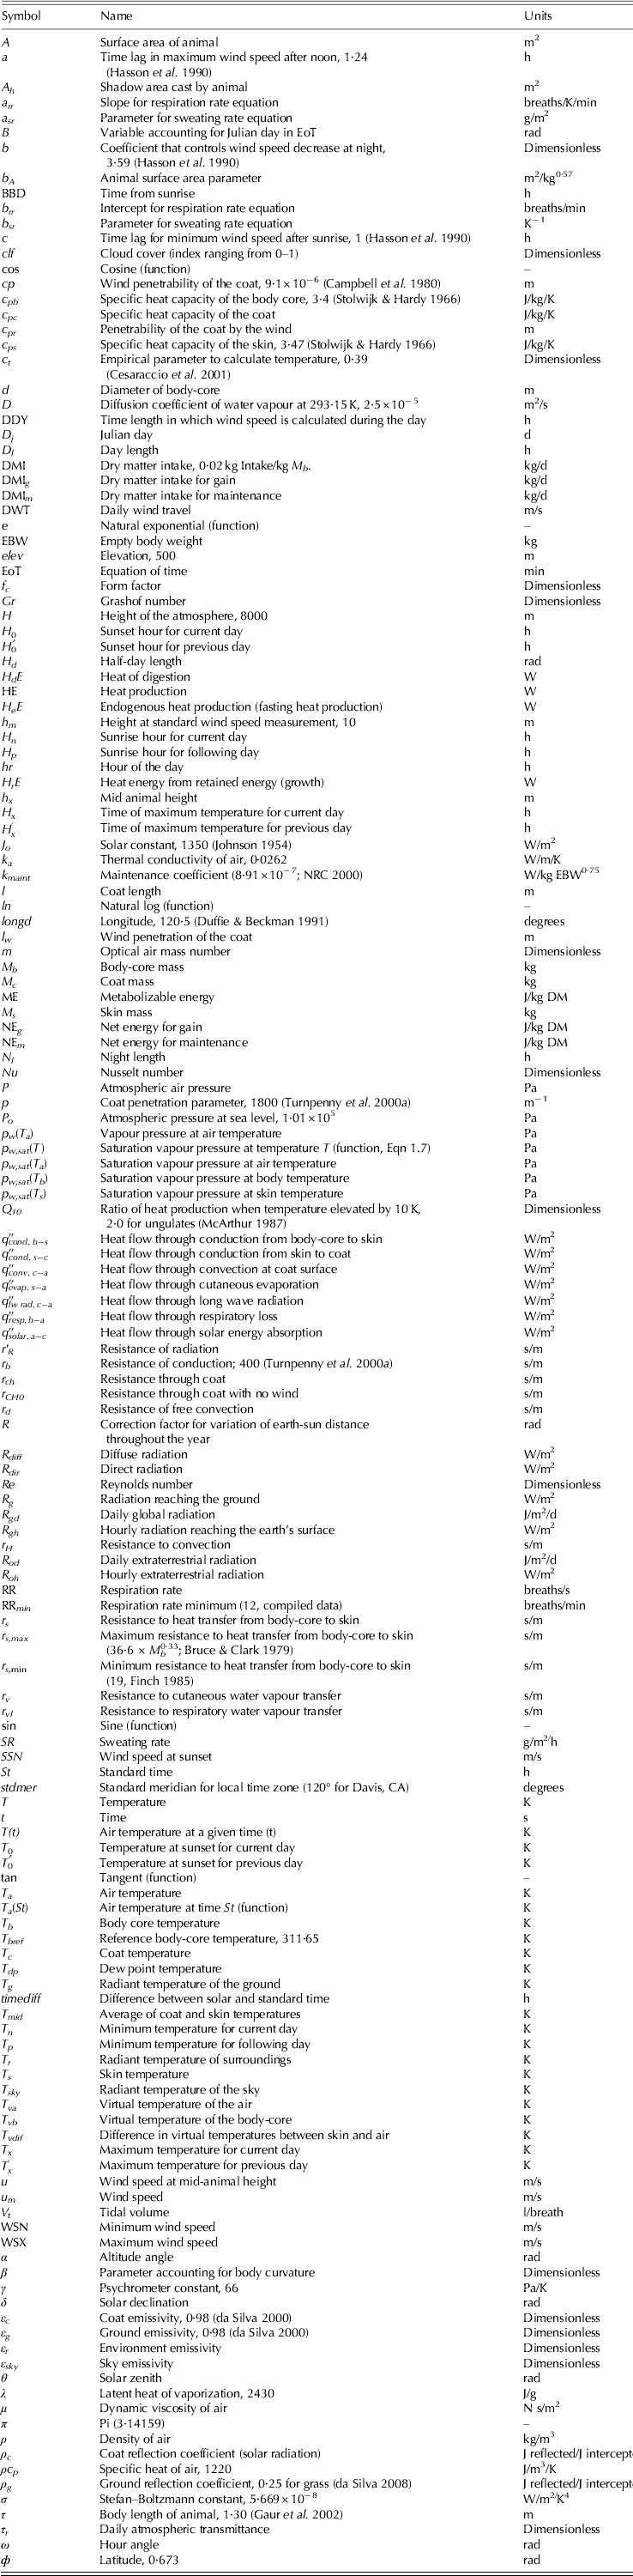
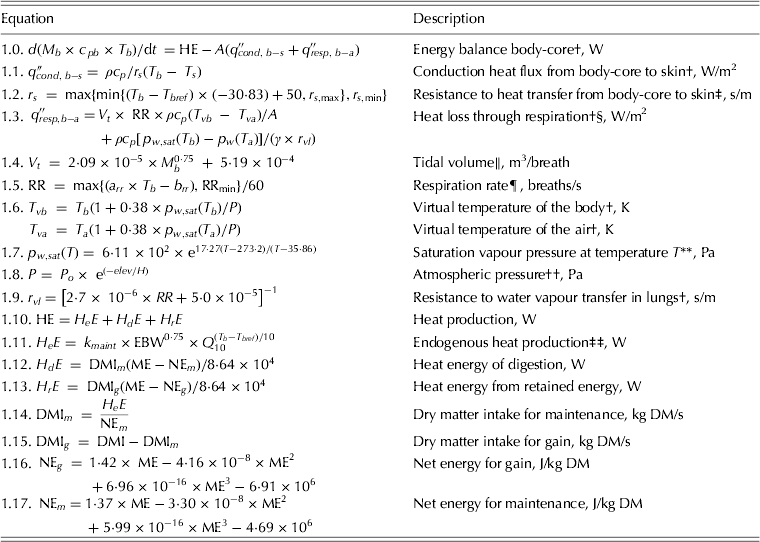
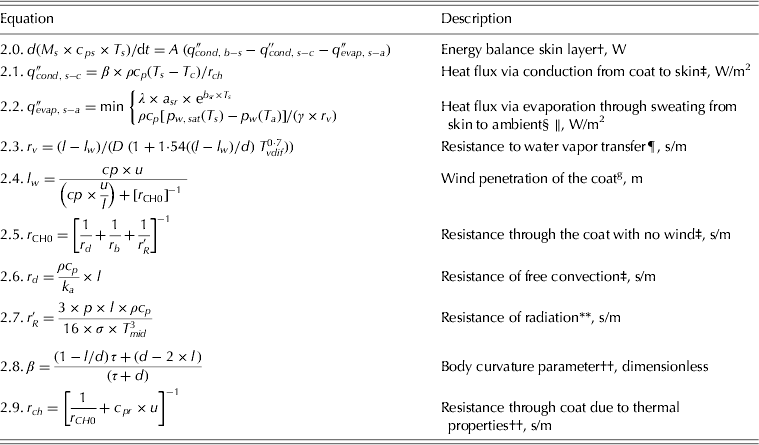
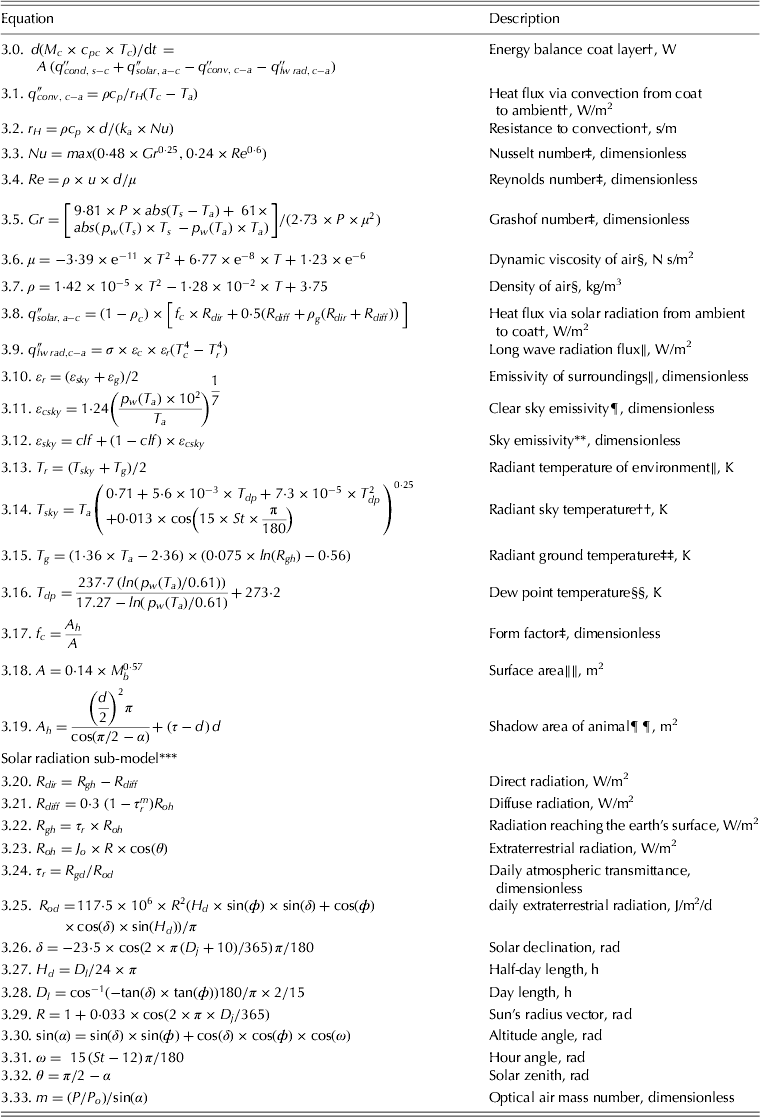
All variables, parameters and inputs in the heat balance model are defined in Table 1. The model has three equations (Eqns 1.0, 2.0 and 3.0, in Tables 2 to 4, respectively), with the first two being differential equations and the third being an algebraic equation, and three unknowns: temperature of the body core, skin and coat (T b, Ts and T c, respectively, K). Equation 1.0 represents the change in heat content in the body core (Table 2), Eqn 2.0 represents the change in heat content in the skin layer (Table 3) and Eqn 3.0 represents the heat content balance in the coat (Table 4). Equation 3.0 is similar to that proposed for clothing by Voelker et al. (Reference Voelker, Hoffmann, Kornadt, Arens, Zhang and Huizenga2009) without the evaporation terms. The heat balance model assumes that the storage term in the coat energy balance is small and can be neglected. This is similar to the assumption made for clothing in the early human thermal models (Huizenga et al. Reference Huizenga, Hui and Arens2001). Thus, the change in heat content for the coat layer (Eqn 3.0) is set to zero. All of the heat fluxes on the right-hand side of Eqns 1.0, 2.0 and 3.0 are either functions of T b, Ts and T c or known functions of time under ambient weather conditions. Heat transfer from appendages (head and legs) is accounted for through skin and coat surface area. The heat transfer through the skin and coat are multiplied by the total surface area, which includes appendages and the dewlap. The assumption is that the resistance within the coat, skin and body core are uniform and thus an average value can be multiplied by the total surface area to represent total heat flows.
Description of all variables, parameters and inputs used in the model
Body-core component*
* All symbols, variables and parameters are described in Table 1.
† McArthur (Reference McArthur1987).
‡ Finch (Reference Finch1985).
§ McGovern & Bruce (Reference McGovern and Bruce2000).
∥ Empirically fit equation.
¶ Thompson et al. (Reference Thompson, Fadel and Sainz2011).
** Murray (Reference Murray1967).
†† Olson (Reference Olson1962).
‡‡ Eqns (1.10) to (1.17): (NRC 2000).
Skin layer component*
* All symbols, variables and parameters are described in Table 1.
† References: (McArthur Reference McArthur1987).
‡ Turnpenny et al. (Reference Turnpenny, McArthur, Clark and Wathes2000a).
§ Thompson et al. (Reference Thompson, Fadel and Sainz2011).
∥ Monteith & Unsworth (Reference Monteith and Unsworth2008).
¶ Cena & Monteith (Reference Cena and Monteith1975).
** Cena & Clark (Reference Cena and Clark1978).
†† McArthur & Monteith (Reference McArthur and Monteith1980).
Coat layer component*
* All symbols, variables and parameters are described in Table 1.
† Turnpenny et al. (Reference Turnpenny, McArthur, Clark and Wathes2000a).
‡ Monteith & Unsworth (Reference Monteith and Unsworth2008).
§ Empirically fit equations.
∥ da Silva (Reference Da Silva2000).
¶ (Brutsaert Reference Brutsaert1975).
** Crawford & Duchon (Reference Crawford and Duchon1999).
†† Duffie & Beckman (Reference Duffie and Beckman1991).
‡‡ Turco et al. (Reference Turco, da Silva, de Oliveira, Leitão, de Moura, Pinheiro, Padilha and da2008).
§§ derived from Magnus Tetens equation; Murray (Reference Murray1967).
∥∥ Brody (Reference Brody1945).
¶¶ Geometric calculation.
*** All solar radiation equations are from Duffie & Beckman (Reference Duffie and Beckman1991) and Oyarzun et al. (Reference Oyarzun, Stockle and Whiting2007).
Model energy balances were derived using a ‘physical formulation’ of the finite-difference method for one-dimensional transient conduction problems (Myers Reference Myers1971). The model assumes that the temperatures in the body core, skin and coat layer are uniform, similar to Crosbie et al. (Reference Crosbie, Hardy and Fessenden1961) and Stolwijk & Hardy (Reference Stolwijk and Hardy1966). The equations that represent the change in heat content of the body core, skin and coat layers (Eqns 1.0, 2.0 and 3.0, respectively; all in W), with respect to time are as follows:
 $$\eqalign{{\rm d}(M_b \!\times\! c_{\,pb} \!\times\! T_b )/{\rm d}t\; = {\rm HE} \!- \! A(q{''}_{\hskip-4.5pt cond,\; b - s} + q{''}_{\hskip-4.5ptresp,\; b - a} )}$$
 $$\eqalign{ & {\rm d}(M_s \times c_{ps} \times T_s )/{\rm d}t\; = \; \cr & A(q{''}_{\hskip-4.5ptcond,\; b - s} - \; q{''}_{\hskip-4.5pt cond,\; s - c} - q{''}_{\hskip-4.5pt evap,\; s - a} )} $$
 $$\eqalign{ & {\rm d}(M_c \times c_{\,pc} \times T_c )/{\rm d}t =0 = \cr & A(q{''}_{\hskip-4.5pt cond,\; s - c} + q{"}_{\hskip-4.5pt solar,\,a - c} - q{''}_{\hskip-4.5pt conv,\; c - a} - \; q{''}_{\hskip-4.5pt lw\; rad,\,c - a} )}$$
More detailed mathematical descriptions of the above equations are presented below and in Tables 2 to 4.
Body-core layer
The energy balance for the body core is described in Table 2. The heat fluxes are modelled using constitutive equations taken from the literature. The body-core heat content is a function of heat production (HE, W; W=J/s; Eqn 1.10, Table 2) and exchanges with the skin and environment by means of conduction and respiration, respectively.
The flow of heat from the body core to the skin,  $q{\Prime}_{\hskip -4.5pt cond,\; b - s} $(W/m2; Eqn 1.1) was modelled with a standard heat flow equation (McArthur Reference McArthur1987), which is a function of the temperatures of the body core and skin (T b and T s, K) and the resistance to heat transfer (r s, s/m; Eqn 1.2). The effect of vasodilation/vasoconstriction is represented by r s; it has a linear relationship with the difference between the reference body-core temperature (T bref; 311·65 K) and the actual body-core temperature and is constrained by minimum and maximum values (Finch Reference Finch1985).
The heat loss through respiration,  $q{\Prime}_{\hskip -4pt resp,b - a} $(W/m2; Eqn 1.3), is split into convection and evaporation. The heat lost through respiratory convection is a function of tidal volume (V t; m3/breath; Eqn 1.4), respiration rate (RR; breaths/s; Eqn 1.5), the specific heat of air (ρc p; 1220 J/m3/K), surface area (A; m2) and the virtual temperatures of the body core and air (T vb and T va; K) (McGovern & Bruce Reference McGovern and Bruce2000). Virtual body core and air temperatures (Eqn 1.6) depend on saturation vapour pressure (p w,sat(T)); Pa; Eqn 1.7), atmospheric air pressure (P; Pa; Eqn 1.8) and temperature (T; K) (McArthur Reference McArthur1987). The p w,sat(T) function is evaluated through the Magnus Tetens equation (Murray Reference Murray1967) for any temperature variable, i.e. the T argument may assume the values of T b or T s.
The calculation for V t is derived from an equation by McGovern & Bruce (Reference McGovern and Bruce2000), which has a working temperature range from 15 to 40 °C. The genotype-specific parameter values used in the calculation of RR were obtained from a meta-analysis of a wide range of literature data (Thompson et al. Reference Thompson, Fadel and Sainz2011). Estimates of these parameter values are as follows: B. taurus, a rr=0·6212 and b rr=192·7; B. indicus, a rr=0·7303 and b rr=227·2 (a rr, slope for respiration rate equation, breaths/K/min; b rr, intercept for respiration rate equation, breaths/min).
The heat loss by evaporation from the lungs is modelled following McArthur (Reference McArthur1987), using the psychrometer constant (γ; 66 Pa/K), the saturation vapour pressure of the body core (p w,sat(T b); Pa; Eqn 1.7), the vapour pressure of the air (p w(T a); Pa; model input), and the resistance to water vapour transfer in the lungs (r vl; s/m; Eqn 1.9). McGovern & Bruce (Reference McGovern and Bruce2000) presented an equation for respiratory evaporative heat loss, but unlike that for convective loss, it greatly overpredicted heat loss. Therefore, McArthur's equation for respiratory evaporation is used in the model.
Heat production (HE; W; Eqn 1.10, Table 2) is modelled with the use of equations adapted from the NRC (1984), where H eE is endogenous heat production (W), H dE is heat energy of digestion (W), and H rE is heat energy from retained energy (W; Eqns 1.10 to 1.13). Heat energy of digestion and from retained energy are calculated from metabolizable energy (ME; J/kg DM), net energies for gain (NEg, J/kg DM; Eqn 1.16) and maintenance (NEm, J/kg DM; Eqn 1.17) of the diet (NRC 2000).
Skin layer
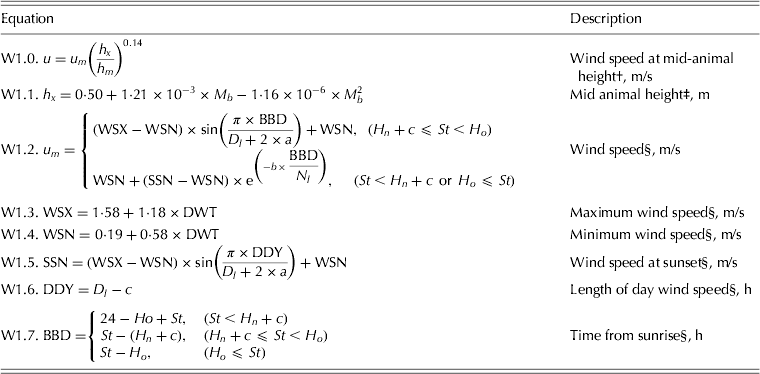
The equations for the skin layer sub-model are shown in Table 3. The flow of heat from the skin to the coat ( $q{\Prime}_{\hskip -4pt cond,\; s - c} $; W/m2; Eqn 2.1) is a function of body curvature (β; dimensionless; Eqn 2.8), resistance of flow due to coat thermal properties (r ch; s/m; Eqn 2.9) and wind speed (u; m/s; Eqn W1.0 (Table 5); McArthur & Monteith Reference McArthur and Monteith1980), where c pr is penetrability of the coat by the wind (2·4×10−5 m) and r CH0 is resistance of the coat in still air (s/m; Eqn 2.5).
* All symbols, variables and parameters are described in Table 1.
† Albright (Reference Albright1990).
‡ ASABE (2006).
§ Peterson & Parton (Reference Peterson and Parton1983) and Hasson et al. (Reference Hasson, Al-Hamadani and Al-Karaghouli1990).
Cutaneous evaporation
Latent heat loss from the surface of the animal is limited by either its sweating rate or its potential evaporation rate, depending on environmental conditions. Therefore, the minimum values of the functions for sweating and potential evaporation rates are used to model latent heat loss from cutaneous evaporation (q evap,s−a; W/m2; Eqn 2.2), where the upper equation represents the heat loss due to sweating rate and the lower represents the maximum heat loss given the potential evaporation rate, which is subject to environmental conditions.
The maximum evaporation rate is a function of temperature, wind and vapour pressure, where p w,sat(T s) (Pa; Eqn 1.7) is the saturation vapour pressure of the skin and r v is the resistance to water vapour transfer (s/m; Eqn 2.3). The equation for r v is a function of coat length (l; m) and body-core diameter (d; m) (Turnpenny et al. Reference Turnpenny, Wathes, Clark and McArthur2000b).
The sweating rate for the animal is modelled using an empirical equation that has species-dependent parameters obtained from a meta-analysis of a wide range of data from the literature (Thompson et al. Reference Thompson, Fadel and Sainz2011). This equation was obtained through regressions of sweating data v. skin temperature for both B. taurus and B. indicus. The parameter values for B. taurus and B. indicus are a sr=2·75×10−18, b sr=0·147 and a sr=3·93×10−18, b sr=0·222, respectively (a sr, g/m2; b sr, per K).
Skin thickness is used to calculate the skin mass. There are species differences in skin thickness (Pan Reference Pan1963), but these had no impact on the heat balance for the two species, thus skin thickness was kept at a constant value.
Coat layer
The coat layer sub-model is shown in Table 4. Conduction loss through the ground is not included in this model. The animal is most likely to be standing while heat stressed and in this position there is minimal contact with the ground, making conduction loss negligible. Moreover, O'Connor & Spotila (Reference O'Connor and Spotila1992) explain that conduction loss calculations are often difficult, rendering the results inaccurate, and thus are usually omitted from animal heat balance models.
The surface area of the animal, A (m2; Eqn 3.18), is calculated with the use of the equation developed for B. taurus (Brody Reference Brody1945) and is a function of body-core mass (Mb; kg) and an animal surface area parameter, b A (0·140 m2/kg0·57). Johnston et al. (Reference Johnston, Hamblin and Schrader1958) found that B. indicus have c. 12% more surface area than do B. taurus, so for B. indicus the parameter b A=0·157 m2/kg0·57.
Long-wave radiation
Long-wave radiation ( $q{\Prime}_{\hskip -4pt lw\,\,rad} $; W/m2; Eqns 3.9 to 3.15) is a function of the emissivities and radiant temperatures of the animal and surroundings and the Stefan–Boltzmann constant (σ; W/m2/K4). The emissivities in the infrared are given by ε c, for the surface of the animal (0·98; da Silva Reference Da Silva2000), and by ε r, for the environment, the latter being the average of the ground (ε g; dimensionless; 0·98 for vegetation; da Silva Reference Da Silva2000), and sky emissivities (ε sky; dimensionless). Sky emissivities is calculated as a function of p w(T a), T a (Brutsaert Reference Brutsaert1975) and cloud cover (clf; index ranging from 0 to 1 where 0 represents clear skies and 1 represents complete cloud cover; Crawford & Duchon Reference Crawford and Duchon1999).
The coat surface temperature and radiant temperature of the surroundings are given by T c and T r (K), respectively: T r (Eqn 3.13) is calculated as the average of the sky (T sky; Eqn 3.14) and ground (T g; Eqn 3.15) radiant temperatures (K). Dew point temperature (T dp; K) is calculated with the use of p w(T a), according to the Magnus Tetens equation (Murray Reference Murray1967).
Convection
Convection at the coat surface ( $q_{conv,\; \; c - a}{\Prime} $; W/m2; Eqns 3.1 to 3.7) is calculated with the temperature difference between the coat and air divided by the resistance to convective heat transfer (r H; s/m; Eqn 3.2). The r H, which uses the Nusselt number (Nu; dimensionless), is dependent on the animal size and decreases as wind speed increases (Turnpenny et al. Reference Turnpenny, McArthur, Clark and Wathes2000a); Nu (Eqn 3.3) is a function of both wind speed and animal geometry and is calculated with the use of Reynolds (Re, dimensionless; Eqn 3.4) and Grashof (Gr, dimensionless; Eqn 3.5) numbers (Monteith Reference Monteith1973; Incropera & DeWitt Reference Incropera and Dewitt1990; McGovern & Bruce Reference McGovern and Bruce2000) For natural convection, where Gr>16×Re 2, Nu=0·48×Gr 0·25. For forced convection, where Gr<0·1×Re 0·6, Nu=0·24×Re 0·6. Otherwise, when wind speed is low, Nu will be the greater of the two above estimates.
The Re and Gr numbers are functions of wind speed u (m/s; Eqn W1.0, Table 5), animal diameter d (m), the dynamic viscosity of air μ (N s/m2; Eqn 3.6), and the density of air ρ (kg/m3; Eqn 3.7). The viscosity and density of air were fitted to equations, both of which are a function of the mean of the skin and air temperatures (K).
The model operates with the assumption that values of daily measurements of minimum and maximum air temperature, maximum solar radiation, vapour pressure (at any time throughout the day) and daily wind travel (DWT) are known.
Solar radiation
Solar radiation absorbed by the animal ( $q{\Prime}_{\hskip -4pt solar,\; a - c}\! $; W/m2; Eqn 3.8) comes from three sources: direct radiation (R dir; Eqn 3.20), diffuse radiation (R diff; Eqn 3.21) and radiation reflected from the ground surface, which is a function of R dir and R diff, all in W/m2. Absorbed radiation is a function of reflection coefficients for the animal and the ground, ρ c and ρ g (J reflected/J intercepted), respectively, and form factor (f c; dimensionless; Eqn 3.17). Form factor is a function of the animal's body angle in relation to the sun and its body dimensions (Monteith & Unsworth Reference Monteith and Unsworth2008) and is calculated as the quotient of the shadow area of the animal (A h; m2; Eqn 3.19) and A. The shadow area of the animal is a function of the animal's body length (τ; m), d and the altitude angle of the sun (α; rad; Eqn 3.30).
The solar radiation sub-model is shown in Table 3 (Eqns 3.20 to 3.33). The calculation of R dir and R diff first requires the calculation of daily extraterrestrial radiation, R od (MJ/m2/d), with the use of solar declination (δ; rad; Eqn 3.26), latitude (ϕ; rad), half-day length (H d; rad; Eqn 3.27) and the correction factor for the variation of the earth–sun distance throughout the year (R; rad; Eqn 3.29) (Duffie & Beckman Reference Duffie and Beckman1991; Oyarzun et al. Reference Oyarzun, Stockle and Whiting2007).
Solar declination is the angle of the earth in relation to the sun (0° is reached twice a year at the equinox), based on the Julian day, D j (1 Jan is 1 and 31 Dec is 365; d; Eqn 3.28). Altitude angle of the sun is the altitude of the sun at any given point throughout the day: at noon on the equator during the equinox it is 90° or π/2. Solar zenith (θ; rad) is the complement to α. Hour angle (ω; rad; Eqn 3.31) is the daily rotation of the earth at any given hour (where midnight is 0), and is a function of standard time (St; h), which is the hour of the day using a 24-h clock.
The extra-terrestrial radiation, R oh (W/m2; Eqn 3.23) is calculated with the use of the solar constant, J o (1350 W/m2; Johnson Reference Johnson1954). The radiation reaching the earth's surface, R gh (W/m2; Eqn 3.22) is then calculated with the use of the daily atmospheric transmittance (τ r; dimensionless; Eqn 3.24) and R oh. τr is the ratio of the daily global radiation (R gd; J/m2/d), which is obtained from data collected through weather stations, to R od. Cloud cover is accounted for through τ r, which decreases as cloud cover increases. Diffuse radiation increases in proportion to total radiation as cloud cover increases and τ r decreases.
Diffuse radiation (Eqn 3.21) is a function of τ r, Roh, and optical air mass number, m (dimensionless; Eqn 3.33). Atmospheric pressure and atmospheric pressure at sea level are given by P (Pa; Eqn 1.8) and P o (1·01×105 Pa), respectively. Ground elevation is elev (500 m), and H is the height of the atmosphere (8000 m). Direct radiation (Eqn 3.20) is calculated as the difference between R gh and R diff.
Air temperature
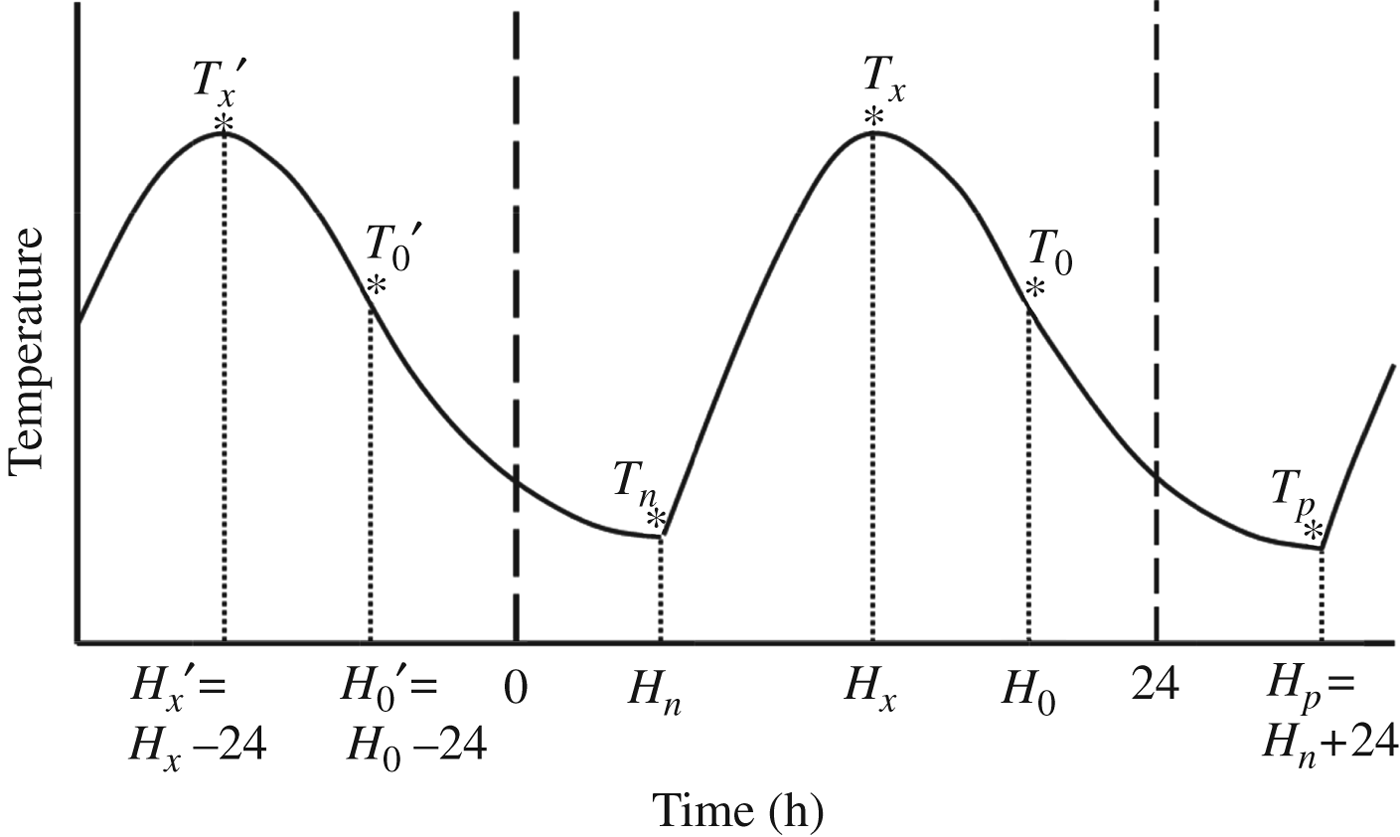
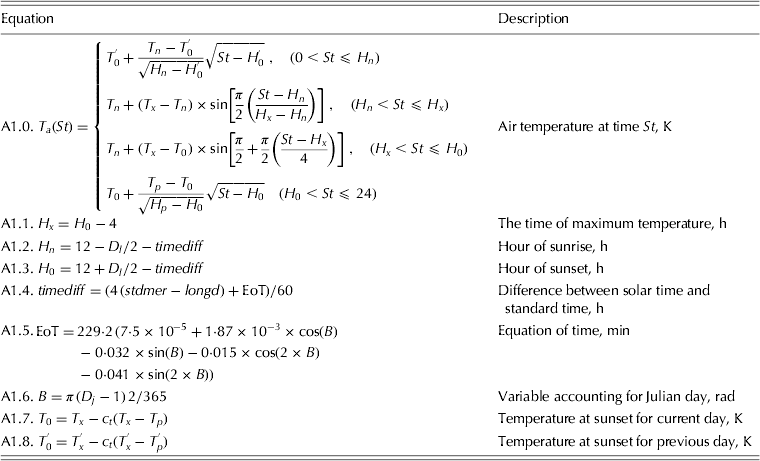
The equations used to calculate air temperature (Table 6) come from Cesaraccio et al. (Reference Cesaraccio, Spano, Duce and Snyder2001) and from the variables calculated in the Solar Radiation section (Table 4). Figure 2 shows a sketch of the inputs needed for the air temperature sub-model, where all temperatures are in K and all of the times, St, are in hours (h). The air temperature calculation, T a(St) (Eqn A1.0), is separated into four different parts of the day: from midnight to sunrise (H n), from H n to time of maximum air temperature (H x), from H x to sunset (H 0) and then from H 0 to midnight.
Sketch of the temperature model (Cesaraccio et al. Reference Cesaraccio, Spano, Duce and Snyder2001). T n is the minimum temperature for current day, T x is the maximum temperature for current day,  $T_x^' $ is the maximum temperature for previous day, T 0 is the temperature at sunset for current day, T 0’ is the temperature at sunset for previous day and T p is the minimum temperature for following day (all in K). H n is the sunrise hour for current day, H 0 is the sunset hour for current day, H 0’ is the sunset hour for previous day, H x is the time of maximum temperature for current day,
 $H_x^' $ is the time of maximum temperature for previous day and H p is the sunrise hour for next day (all in standard time, h).
* All symbols, variables and parameters are described in Table 1.
† Eqns (A1.2)–(A1.6) are from Duffie & Beckman (Reference Duffie and Beckman1991), whereas the rest are from Cesaraccio et al. (Reference Cesaraccio, Spano, Duce and Snyder2001).
The difference between solar time and standard time is timediff (h; Eqn A1.4). timediff is calculated with the use of equation of time (EoT; min; Eqn A1.5), standard meridian for local time zone (stdmer; 120° for Davis, CA) and longitude (longd; 120·5° for Davis, CA) (Duffie & Beckman Reference Duffie and Beckman1991).
Wind speed
The wind speed sub-model, shown in Table 5, comes from Peterson & Parton (Reference Peterson and Parton1983), with some revisions by Hasson et al. (Reference Hasson, Al-Hamadani and Al-Karaghouli1990). The inputs for wind speed calculations are DWT (m/s) and Julian day (D j). Maximum (WSX; m/s; Eqn W1.3) and minimum (WSN; m/s; Eqn W1.4) wind speeds are calculated from DWT (Hasson et al. Reference Hasson, Al-Hamadani and Al-Karaghouli1990).
Wind speed at mid-animal height (u; m/s; Eqn W1.0) is a function of wind speed (u m; m/s) at height h m (m) and mid-animal height (h x; m). Wind speed is a two-part equation, which has day and night components (Eqn W1.2): u m during the day (Eqn W1.2) is a function of WSX and WSN, the time from sunrise (BBD; h; Eqn W1.7) and two parameters a and c, which are the lag in maximum wind speed after noon (a=1·24; h) and the lag in minimum wind speed after sunrise (c=1; h), respectively. Wind speed at night is a function of WSN, the length of time that the wind speed is calculated during the day (DDY; h; Eqn W1.6), the coefficient that controls wind speed decrease at night (b=3·59; dimensionless), day length (D l; h), night length (N l=24 – D l; h) and the wind speed at sunset (SSN; m/s; Eqn W1.5) (Hasson et al. Reference Hasson, Al-Hamadani and Al-Karaghouli1990).
Wind speed at height h m, is converted into u at h x with the use of the equation by Albright (Reference Albright1990). Mid-animal height is calculated with the use of a regression equation, which was fit to B. taurus data and is multiplied by 1·2 for B. indicus (Eqn W1.1; ASABE 2006).
Both air temperature and wind speed sub-models had slope discontinuities, but this did not result in numerical difficulties in the solutions of the model and they compared well with hourly data.
Model simulation
The model was coded in Matlab (2010) and used a built-in ordinary differential equation solver (ode23t). It is capable of handling systems of differential algebraic equations (DAEs) (Shampine et al. Reference Shampine, Reichelt and Kierzenka1999), such as Eqns 1.0, 2.0 and 3.0. The climate input data (temperature, vapour pressure, solar radiation and wind speed) were obtained from regional weather stations for 21–24 June 2006 in Davis, CA (CIMIS 2009) as daily inputs (Thompson et al. Reference Thompson, Sainz, Strathe, Rumsey and Fadelin press). Hourly weather data, if available, can be implemented in the model, replacing the climate equations with interpolation routines.
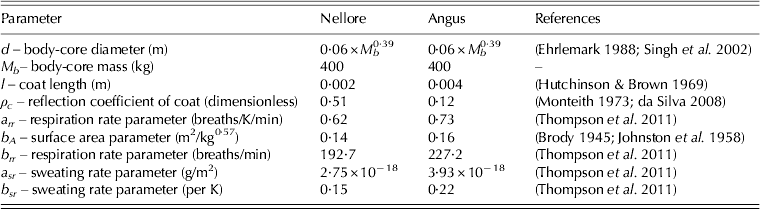
Animal inputs (shown in Table 7) are species-specific. Bos indicus have some adaptations which make them more tolerant to a tropical climate than B. taurus, such as a large dewlap, higher sweating rates, lighter coat, change in distribution of body reserves (large hump) and thicker skin (Pan Reference Pan1963; Hansen Reference Hansen2004). The model accounts for the dewlap with increased surface area. Preliminary analysis showed that the thicker skin of B. indicus had no impact on heat balance. The differences in basal metabolic rate have little impact on heat balance (this was fully evaluated with the sensitivity analysis as described in Thompson et al. Reference Thompson, Sainz, Strathe, Rumsey and Fadelin press). The higher sweating rate and shorter coat are also both accounted for in the animal inputs section. McDowell et al. (Reference McDowell, McDaniel and Hooven1958) found that the hump had no impact on heat regulation, thus this was not included in the model. The animal inputs also allow for a wide range of animal maturity from growing to mature cattle. This excludes pre-weaned calves as well as lactating and gestating animals, as such animals would require additional model changes, which may include sweating rates, heat of lactation and metabolic heat production.
Animal inputs for Nellore and Angus
RESULTS AND DISCUSSION
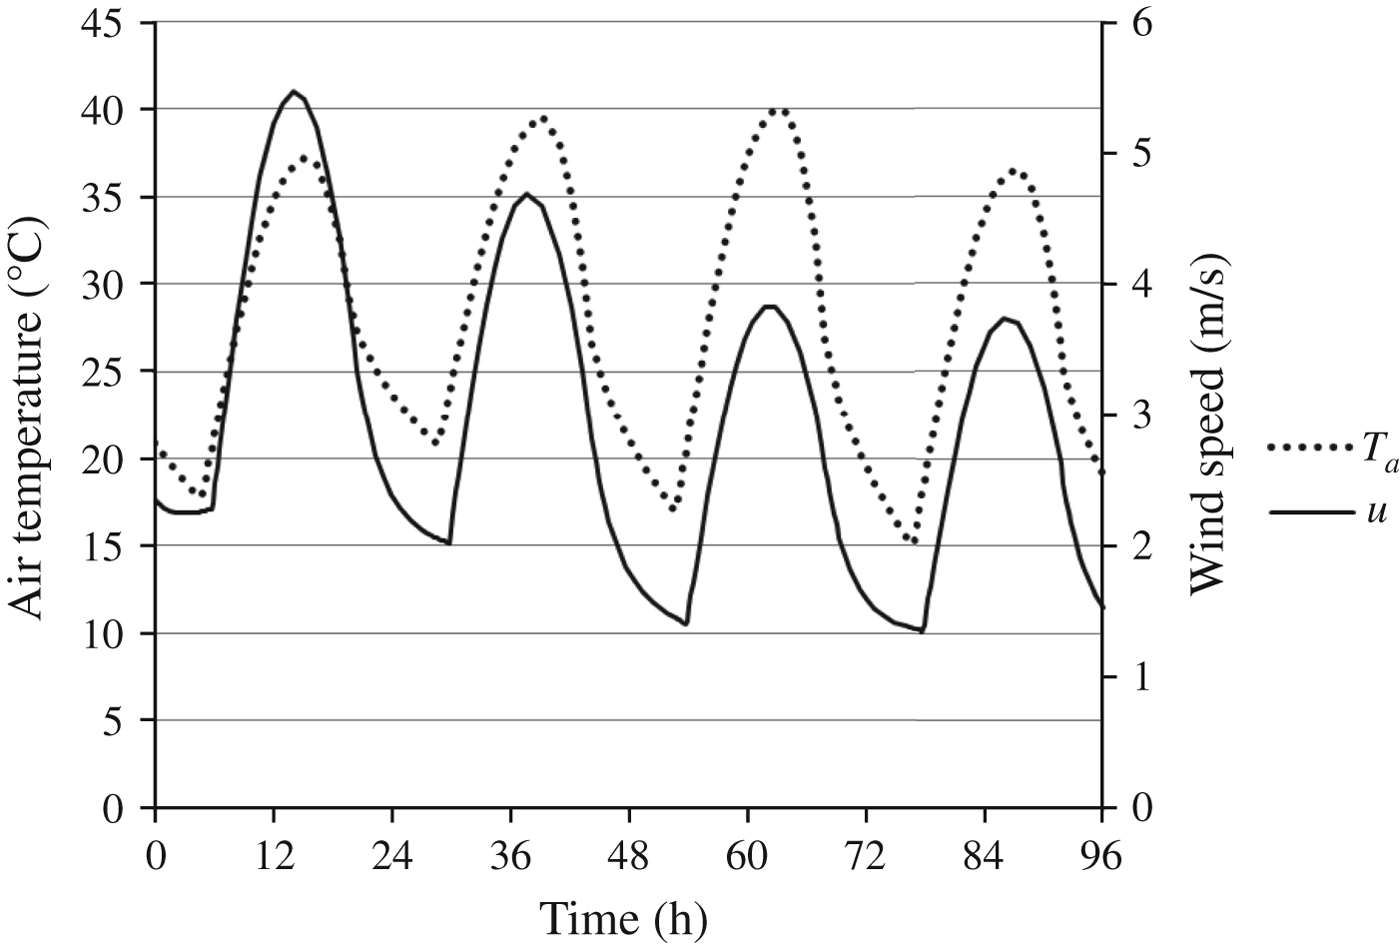
As shown in Fig. 3, the patterns for air temperature and wind speed were similar, a pattern also found by Cesaraccio et al. (Reference Cesaraccio, Spano, Duce and Snyder2001), Peterson & Parton (Reference Peterson and Parton1983) and Hasson et al. (Reference Hasson, Al-Hamadani and Al-Karaghouli1990). The nadir in the diurnal fluctuations occurred at sunrise (or shortly thereafter in the case of wind speed) and the zenith some time after noon and before sunset. The inputs for this figure consisted of climate data from 21 to 24 June 2006 in Davis, CA (CIMIS 2009).
Air temperature (T a; °C) and wind speed (u; m/s) over four days. Both lines follow similar diurnal fluctuations with nadirs at sunrise and zeniths in the early afternoon.
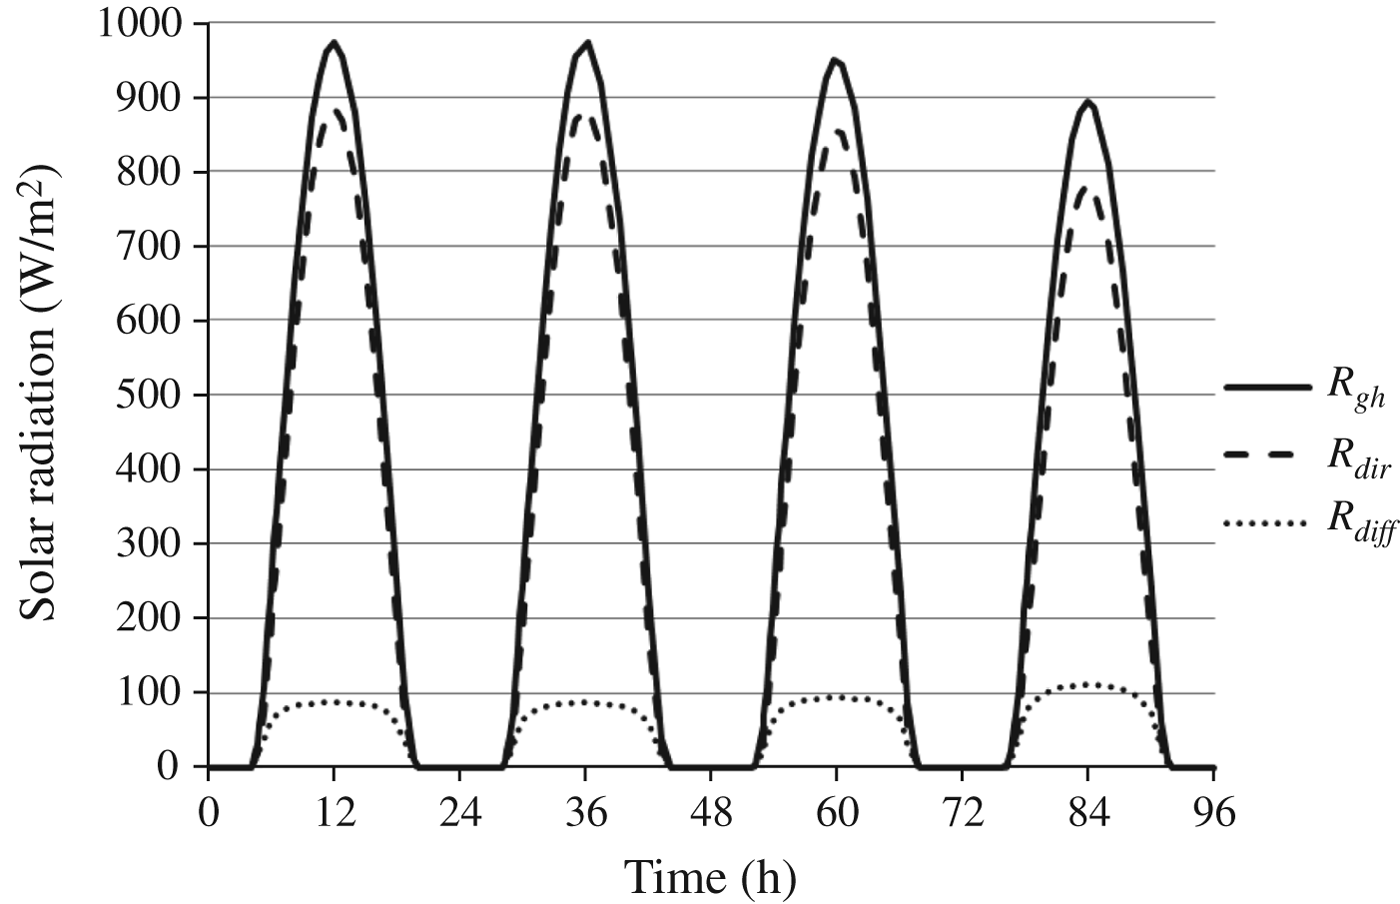
Figure 4 shows the ground level diffuse, direct and total radiation (W/m2). The peak for diffuse radiation was much flatter than those for direct and total radiation. In the early morning and late afternoon, the sun must travel through more of the earth's atmosphere, and the proportion of diffuse to direct radiation increases as more radiation is ‘scattered’ (Duffie & Beckman Reference Duffie and Beckman1991). During the midday hours, although total radiation peaks, a lower proportion of the radiation is diffuse. On the fourth simulation day, the amount of total radiation and direct radiation fell, but the amount of diffuse radiation rose, due to the presence of cloud cover on that day. Cloud cover can increase the proportion of diffuse radiation from 0·1–0·3 to 1·0 of total radiation (Sen Reference Sen2008).
Solar radiation on a horizontal surface at the ground. Radiation is separated into three lines, total, direct and diffuse (R gh, Rdir and R diff, respectively).
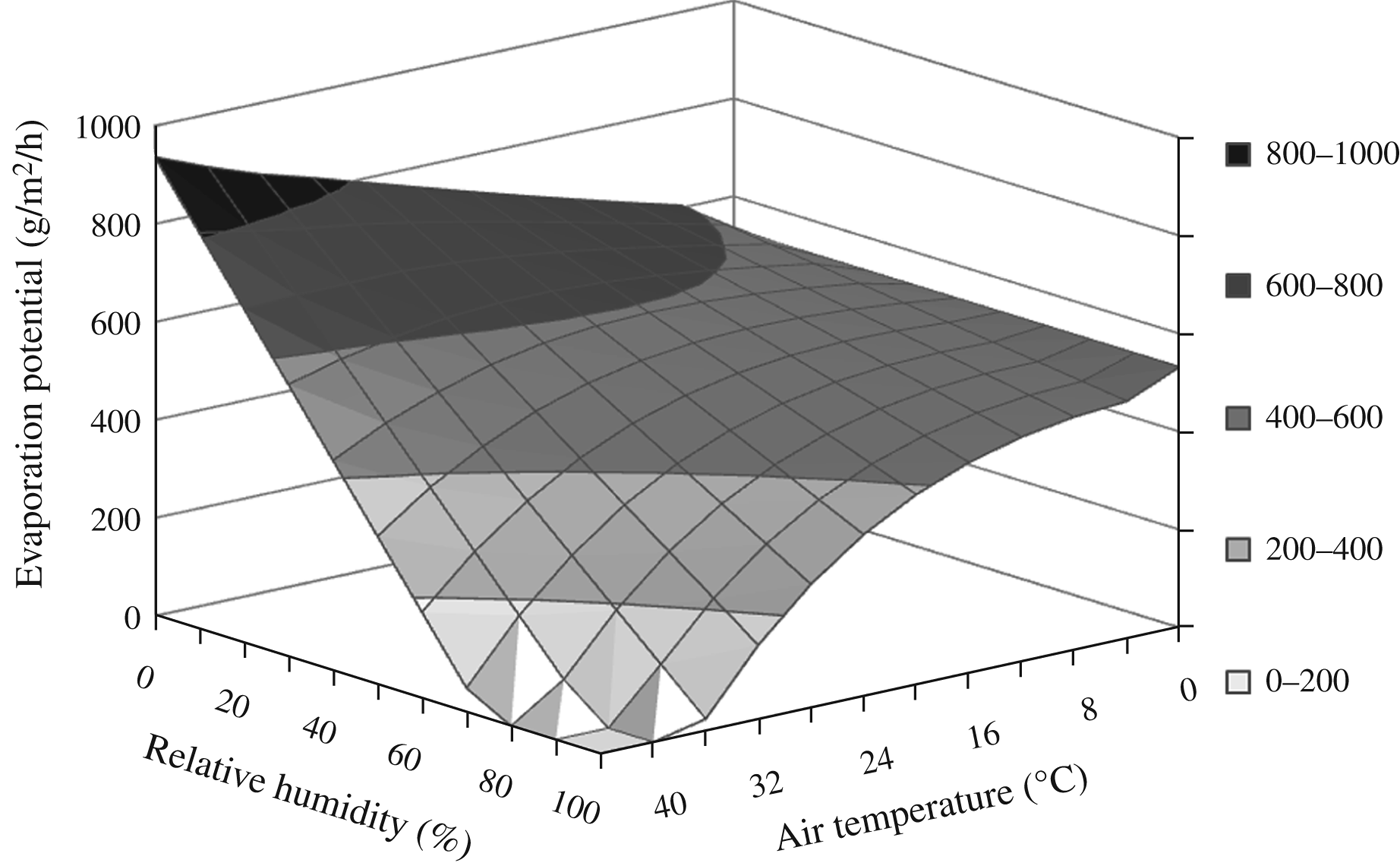
The simulated evaporation potential (Eqn 2.2) behaved as expected, sharply decreasing at both high temperature and high humidity, as commonly seen in the humid tropics (Fig. 5). Evaporation potential increases as air temperature increases at low relative humidity, because absolute humidity potential increases with air temperature. However, at high relative humidity, the evaporation potential decreases as air temperature increases. At high relative humidity, the vapour pressure gradient decreases as air temperature nears body-core temperature, making it more difficult for the animal to lose water vapour to its surrounding environment.
Simulated evaporation potential of sweat on the skin of cattle v. air temperature and relative humidity.
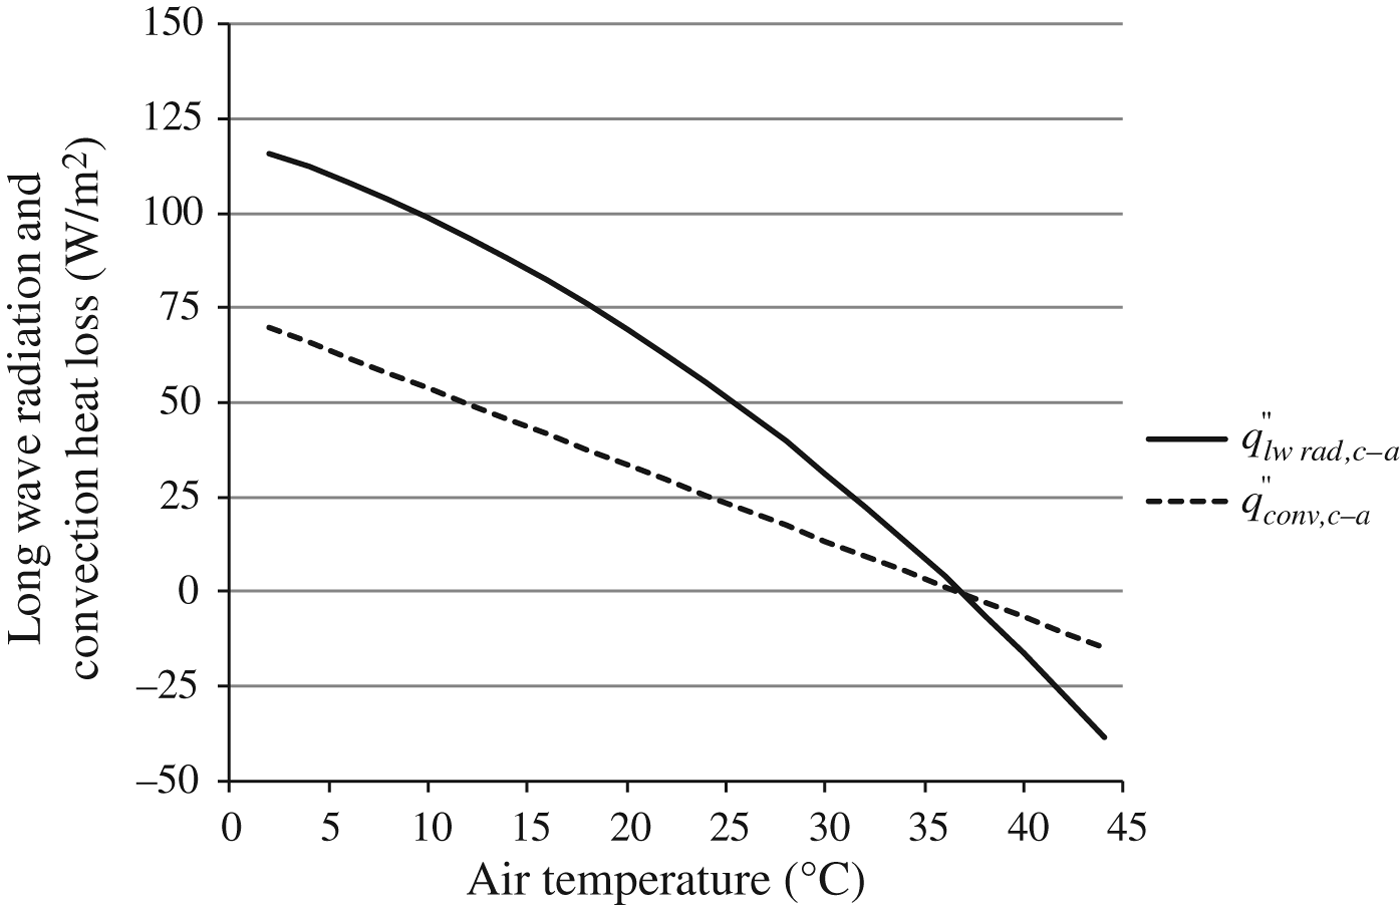
The long-wave radiation and convection losses (Eqns 3.9 and 3.1, respectively) from the animal are shown in Fig. 6 with increasing air temperature (wind speed is zero). The gradient between air and body-core temperatures drives these equations, which are independent of humidity. The difference between the temperature of the animal and its environment increases as air temperature decreases, which increases both the long-wave radiation and the convection losses from the animal. Above 36 °C, both long-wave radiation and convection became negative, indicating a net sensible heat gain by the animal, as also reported by Gebremedhin (Reference Gebremedhin1987). Even though Zhang et al. (Reference Zhang, Gupta and Baker2007) found that humidity increases convection losses, it does so only for objects with temperatures ranging from 77 to 177 °C, which is above the range for the surface of cattle. The increasing humidity resulted in water collecting on surfaces, which then evaporated, resulting in turn in greater sensible heat losses.
Long-wave radiation ( $q{\Prime}_{\hskip -4pt lw\; rad,\,c - a} \kern -2pt $) and convection (
 $q{\Prime}_{\hskip -4pt conv,\; c - a} $) losses from cattle at zero wind speed over air temperature (°C).
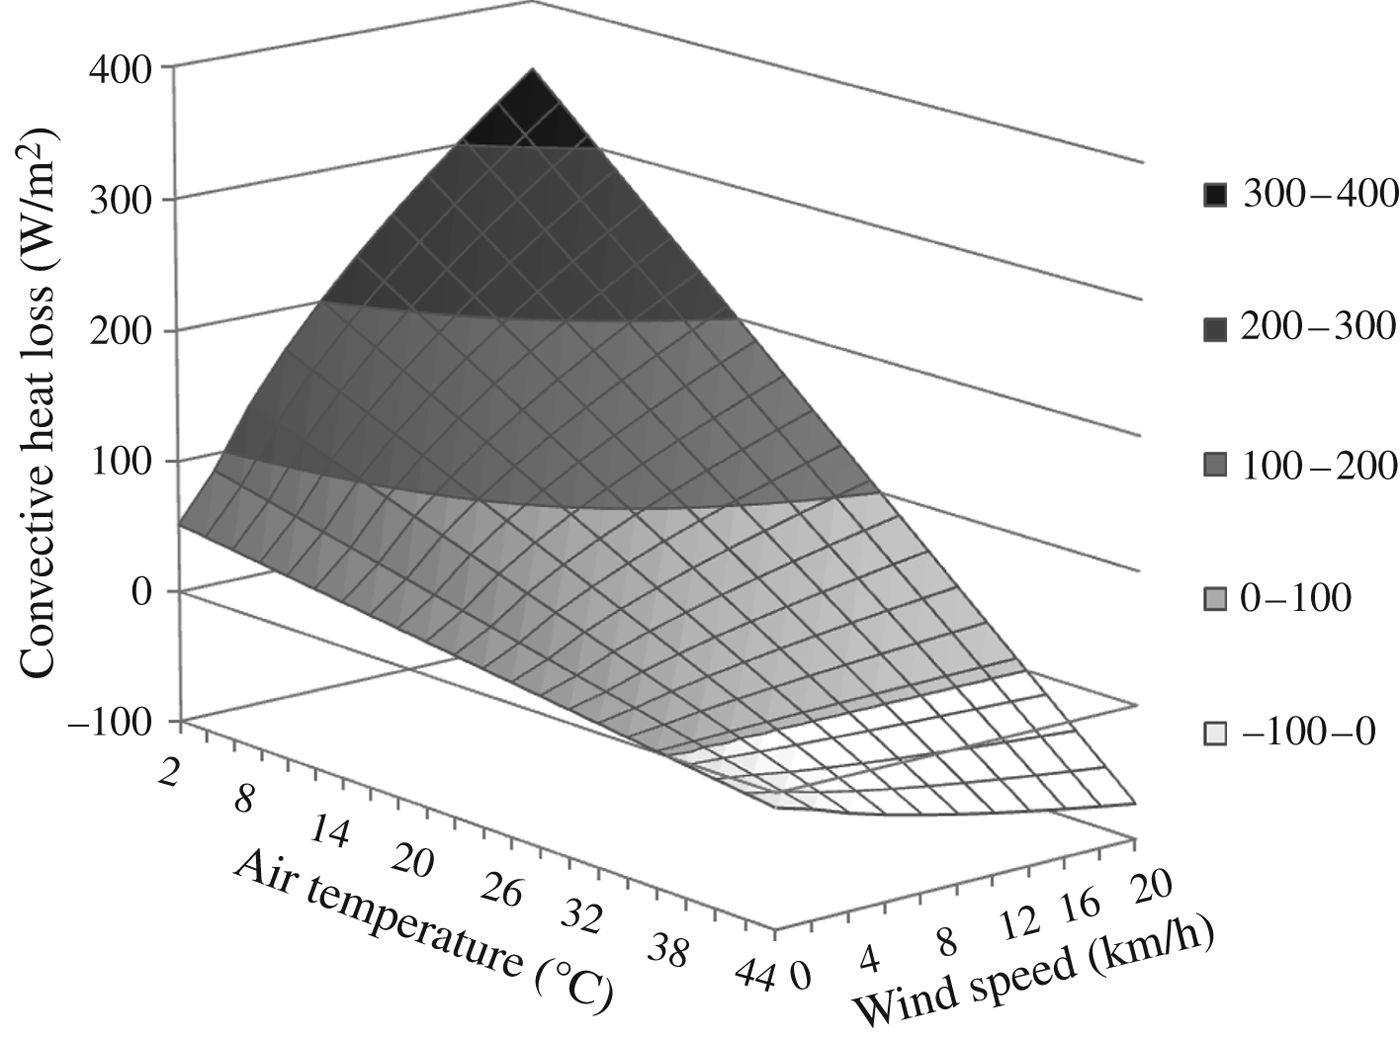
Figure 7 shows the surface plot of convective heat loss v. air temperature and wind speed. At low air temperature, increasing wind speed increases the convection loss experienced by the animal. Conversely, at high air temperature, increasing wind speed increases convection gain experienced by the animal. The results obtained by McArthur (Reference McArthur1991) and Gebremedhin (Reference Gebremedhin1987) exhibited similar relationships among convective heat loss, air temperature and wind speed. Wind decreases resistance to convective heat transfer; thus, when the air temperature is low and the animal is losing heat due to convection, increasing wind speed will increase the rate of this loss, and when air temperature is high and the animal is gaining heat due to convection, increasing wind speed will increase the rate of this gain.
Convective heat loss from the animal v. air temperature and wind speed.
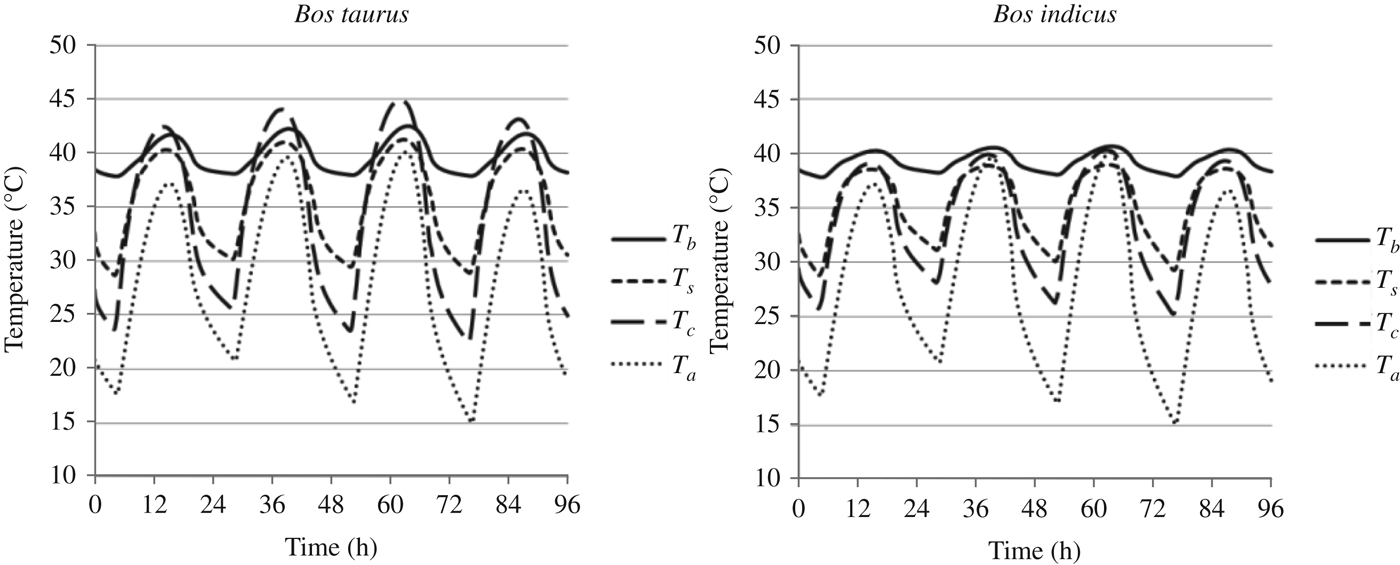
The model simulation outputs for B. taurus and B. indicus are shown in Fig. 8. The points for skin temperature lie between those for body-core and air temperatures, a relationship consistent with findings by Gebremedhin et al. (Reference Gebremedhin, Hillman, Lee, Collier, Willard, Arthington and Brown-Brandl2008), Allen (Reference Allen1962) and Thomas & Pearson (Reference Thomas and Pearson1986). Maia et al. (Reference Maia, Da Silva and Loureiro2008) found coat temperatures to be between 2 and 14 °C above air temperature, which is consistent with the results reported for B. taurus in the current work. The B. indicus body-core, skin and coat temperatures are all lower than the B. taurus due to their adaptations to hot climate conditions. For both species, the fluctuations in daily skin and coat temperatures are slightly offset from those in air temperature, due to the impact of solar radiation. Peak air temperature occurred around 15·00 h, while peak solar radiation occurred at midday. The increase in solar load on the animal resulted in an increase in coat temperature slightly before the increase in air temperature, and as soon as air temperature decreased, the solar load was no longer substantial, so the coat temperature could decrease along with air temperature.
Simulation outputs for Bos taurus and Bos indicus. The model was simulated over four days (96 h). The outputs are body-core, T b, skin, T s, coat, T c and air, T a, temperatures.
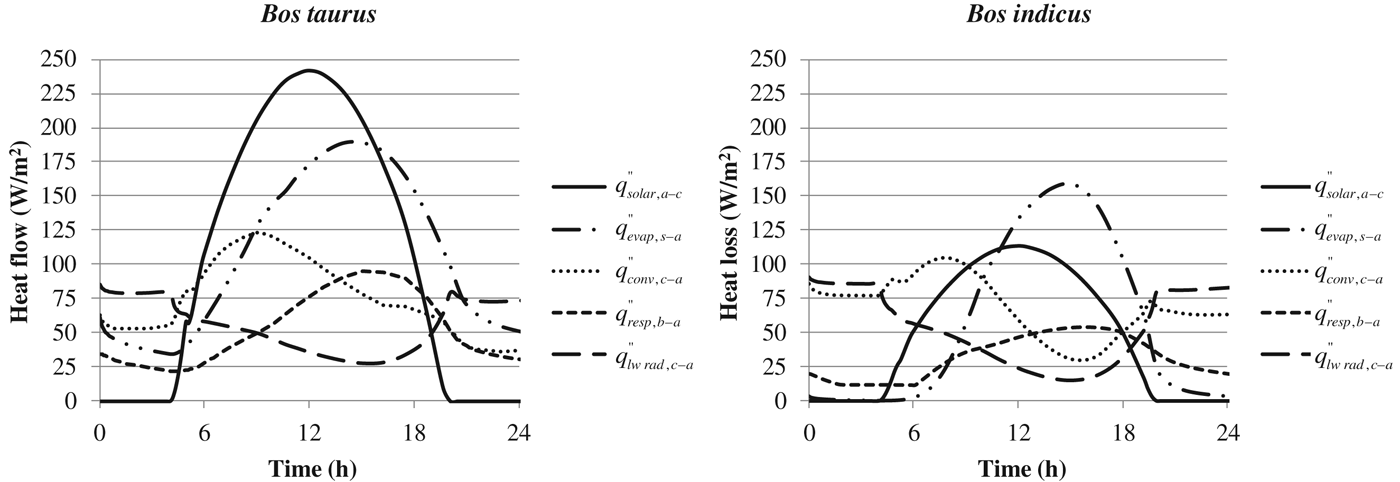
Figure 9 shows the heat flows between the animal and its environment for B. taurus and B. indicus. For B. taurus, the highest incoming flow was solar radiation absorption, which exhibited a peak during solar hours around noon. The inputs for this figure consisted of climate data from 21 to 22 June 2006, which includes the summer solstice, around which time incoming solar radiation is the highest for the year (reaching 973 W/m2 at 12·00 h). Bos indicus have lower solar radiation absorption due to higher coat reflectivity. For both species, cutaneous evaporation and respiratory losses account for the majority of heat loss during the day, especially near 16·00 h when air temperature reaches its maximum. Long-wave radiation and convection losses are greatest at night and in the early morning hours, as shown in studies by Kibler & Yeck (Reference Kibler and Yeck1959), Kelly et al. (Reference Kelly, Bond and Heitman1954) and Gebremedhin (Reference Gebremedhin1987), who found that, as air temperature decreases both convection and long wave radiation losses increase, whereas evaporative loss decreases. Bos taurus and B. indicus exhibit similar trends, although the flows for B. taurus are generally higher due to higher heat stress and thus increased need to dissipate excess heat.
Heat flows between a Bos taurus and Bos indicus animal and its environment (W/m2). The flows are heat loss due to cutaneous evaporation,  $q{\Prime}_{\hskip -4pt evap,\; s - a} $, solar absorption,
 $q{\Prime}_{\hskip -4pt solar,\,a - c} $, convection losses,
 $q{\Prime}_{\hskip -4pt conv,\; c - a} $, long wave radiation losses,
 $q{\Prime}_{\hskip -4pt lw\; rad,\,c - a} $ and respiration losses,
 $q{\Prime}_{\hskip -4pt resp,\,b - a} $.
CONCLUSION
Future development for the current model could be the addition of a dynamic heat production component, which includes eating behaviour, a detailed representation of cloud cover and rainfall, a sprinkler/mister component, which includes droplet size and a heat production component of gestation and lactation.
Although many parts of this model can be evaluated independently, the prediction potential and extensive model analysis will be presented in the subsequent paper (Thompson et al. Reference Thompson, Sainz, Strathe, Rumsey and Fadelin press). The current model integrates concepts and data relating to heat flows between animals and their environment. The equation forms and parameters are largely based on generally accepted physical, anatomical and physiological principles. Even though this model must be further evaluated against more complete, extensive datasets to assess its ability to predict body-core temperature in response to different environmental conditions for both B. taurus and B. indicus, the results produced by the model are physiologically sound and follow the trend of known biology.
This research was supported by the Lyons Fellowship, the Jastro Shields Award (V.A.T.) and the W. K. Kellogg Endowment, USDA NIFA Multistate Research Project NC-1040. We gratefully acknowledge the infrastructure support of the Department of Animal Science, College of Agricultural and Environmental Sciences, the California Agricultural Experiment Station of the University of California, Davis and Embrapa Cerrados, Planaltina, Brazil.