INTRODUCTION
Deep-sea bottom longline fisheries of the Hatton Bank
Deep-sea bottom longline fisheries are conducted both on the deep-sea slopes and shallower waters of the Hatton Bank, targeting deep-water sharks, Greenland halibut and gadoids (Bensch et al., Reference Bensch, Gianni, Gréboval, Sanders and Hjort2008). Accordingly, the North East Atlantic Fisheries Commission (NEAFC) and the European Union (EU) have closed a part of the Hatton Bank to bottom fishing (EC, 2009; NEAFC, 2010), in order to protect vulnerable marine ecosystems (VMEs) threatened by deep-sea fisheries (FAO, 2009). Catch limitations for most deep-water species were also implemented by the EU and currently no directed fisheries for deep-water sharks are permitted for Community vessels (EC, 2008a). Deep-water sharks Centrophorus squamosus (Bonnaterre, 1788) and Centroscymnus coelolepis (Bocage & Capello, 1864) have conservative reproductive strategies that suggest that they may not sustain intensive commercial exploitation (Clarke et al., Reference Clarke, Connolly and Bracken2001). Both were included in the list of threatened and/or declining species and habitats of the OSPAR Convention for the protection of the marine environment of the north-east Atlantic (OSPAR, 2008).The first is also included under the ‘vulnerable category’ (White, Reference White2003) by the International Union for Conservation of Nature (IUCN) and the second one is considered to be ‘near threatened’ (Stevens & Correia, Reference Stevens and Correia2003). Molva dypterygia (Pennant, 1784) and Brosme brosme (Ascanius, 1772), are gadoid species belonging to the family Lotidae (lotids). The first grows much faster than most deep-water species but it is particularly vulnerable to fishing because spawning aggregations can be targeted (ICES, 2008a), meanwhile the second one is more vulnerable due to a slow growth rate and a higher age at first maturity (ICES, 2008b).
Longline impacts
There appears to be little information on impacts of static gears on the Hatton Bank. But VMEs could be negatively affected by bottom longlining (Bavestrello et al., Reference Bavestrello, Cerrano, Zanzi and Cattaneo-Vietti1997; Krieger, Reference Krieger, Willison, Hall, Gass, Kenchington, Butler and Doherty2001; Fosså et al., Reference Fosså, Mortensen and Furevik2002; Reed, Reference Reed2002). Moreover the mortality of seabirds in bottom longline fisheries (Brothers et al., Reference Brothers, Cooper and Løkkeborg1999), particularly Fulmarus glacialis (Linnaeus, 1761), could be large. However, in the north-east Atlantic, longlines are not currently regarded as a serious threat for the fulmar (Tasker et al., Reference Tasker, Camphuysen, Cooper, Garthe, Montevecchi and Blaber2000), since their populations are now large. The species is listed as being of ‘least concern’ by IUCN (BirdLife International, 2008). Nevertheless, reduction of seabird by-catch, as well as conservation of VMEs, discard research and impact assessments are issues addressed by the United Nations General Assembly resolution 61/105 on sustainable fisheries (UNGA, 2006).
Aim of the survey
The objective of the survey was to study the potential for a sustainable longline fishery over the rocky outcrop of the Hatton Bank area (unusual ground for the Spanish longliners) and furthermore to describe the effects of longlining on fish communities and the benthic ecosystem, as well as the interactions between fishing and seabirds. In addition, the survey provided a chance to collect extra data on marine litter and derelict deep-sea gillnets. Collaborative research with longline fishermen provided an opportunity to target large predators and scavengers in rugged terrain and hard substrate (Fossen et al., Reference Fossen, Cotton, Bergstad and Dyb2008) and offered a cost-effective means of gaining valuable insight into the longlining techniques. The working hypothesis is that longlining, regarded as a more selective fishing method than trawling (Bjordal & Løkkeborg, Reference Bjordal and Løkkeborg1996), could produce impacts in sensitive species when their distributions overlap with fishing grounds. The purpose of this paper is to contribute to the understanding of the deep-sea fishery and to provide input to advisory processes. The inclusion of data collected in collaboration with stakeholders into the process, will improve stakeholder comprehension, the degree of acceptance and potential for success of conservation measures.
MATERIALS AND METHODS
Study area
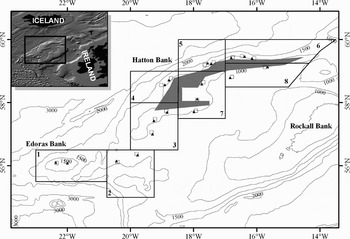
The study area (Figure 1) in international waters of the north-east Atlantic, occurs within the NEAFC Regulatory Area (ICES Subdivision VIb1 and Division XIIb), on the Hatton Bank area (750–1500 m depth). Hatton Bank is a large offshore bank, situated to the west of the European continental shelf. Its geophysical setting has been recently summarized by Sayago-Gil et al. (Reference Sayago-Gil, Long, Hitchen, Díaz-del-Río, Fernández-Salas and Durán-Muñoz2010). Evidence of outcropping bedrock, coral carbonate mounds and cold-water coral assemblages were reported (Roberts et al., Reference Roberts, Henry, Long and Hartley2008; Howell et al., Reference Howell, Davies and Narayanaswamy2010) in the shallowest area of the bank (<1000 m depth). Along the deep western flank (>1000 m depth), the habitats (Durán Muñoz et al., Reference Durán Muñoz, Sayago-Gil, Cristobo, Parra, Serrano, Díaz del Rio, Patrocinio, Sacau, Murillo, Palomino and Fernández-Salas2009) are located on two distinct geomorphological domains, namely: (i) the contouritic sedimentary seabed of the Hatton Drift (McCave & Tucholke, Reference McCave, Tucholke, Vogt and Tucholke1986), a ground frequented by trawlers; and (ii) the rugged seabed of the Hatton Bank outcrop, a ground feasible for longlining. The term outcrop, sensu stricto, refers to those parts of the bank that project from the seabed surface and which are not covered—or slightly covered, up to 15 m—by sedimentary deposit (drift). Three areas of cold-water corals have been identified by Durán Muñoz et al. (Reference Durán Muñoz, Sayago-Gil, Cristobo, Parra, Serrano, Díaz del Rio, Patrocinio, Sacau, Murillo, Palomino and Fernández-Salas2009) along the outcrop in the western deep slopes of the bank.
Map of the study area showing the boundaries of the sampling blocks (solid line) and the start positions of the longline hauls (white squares, multifilament gear; black triangles, monofilament gear). Longlines were deployed outside the NEAFC/EU closed area (shadow area).

Survey methodology
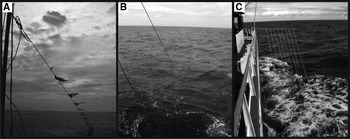
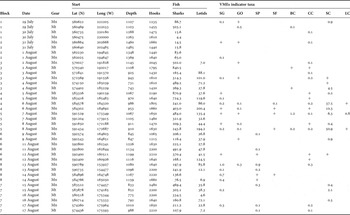
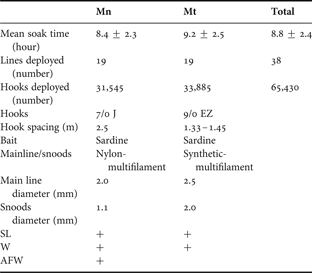
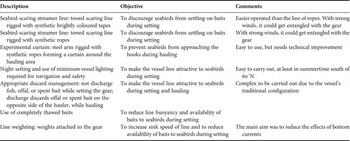
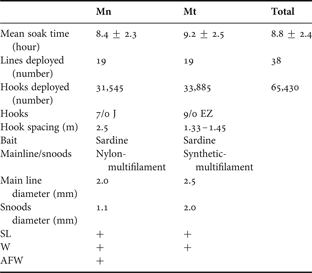
The experimental survey was developed by the Spanish Institute of Oceanography (IEO) in collaboration with fishermen. The study was carried out over twenty days during the summer of 2008, on-board a Spanish bottom longliner (336 gross tonnage) predominantly used to fish hake in European waters. The study area was divided into eight sampling blocks, based on the previous knowledge of the seabed morphology (Sayago-Gil et al., Reference Sayago-Gil, Long, Hitchen, Díaz-del-Río, Fernández-Salas and Durán-Muñoz2010) and the fishing grounds (Durán Muñoz et al., Reference Durán Muñoz, Sayago-Gil, Cristobo, Parra, Serrano, Díaz del Rio, Patrocinio, Sacau, Murillo, Palomino and Fernández-Salas2009). Three blocks were delineated within the western slope, considering the main outcrop areas (as given in ICES, 2008c): (i) Central Area (block 4); (ii) Ridges and Mounds Area (block 5); and (iii) North-western Area (block 6). The remaining represent (iv) the eastern flank of the bank (blocks 3, 7 and 8), (v) the adjacent Edoras Bank (block 1), and a transitional area between both banks (block 2). The objective of this sampling scheme (Figure 1; Table 1) was to study mainly the zones of the rocky outcrop open to bottom fishing activities. With this aim, 19 fishing stations were distributed outside the cold-water coral protection area (EC, 2008b; NEAFC, 2007, 2008). At each station, two different experimental bottom longlines (monofilament type and multifilament type; Table 2) were deployed at similar depths, by means of a manual longlining method (Bjordal & Løkkeborg, Reference Bjordal and Løkkeborg1996). The choice of the gears is related with the objective to sample fish distributed at various depths near the bottom. The monofilament longline was designed modifying a gear to catch hake while a multifilament one was designed modifying a gear to catch deep-water species (Piñeiro et al., Reference Piñeiro, Casas and Bañón2001). With the aim to reduce negative impact of the study, a relatively limited number of longlines (38) and hooks (65,430) were deployed. Hooks of relatively small size were used with the purpose to sample a wide size-range of fish. Gears were adapted for deep-water fishing on hard substrates: longlines were attached to a safety line in order to avoid loss of gear if it gets stuck and breaks. The lines were weighted in order to reduce the effects of bottom currents and also to increase sink speed to minimize seabird by-catch. Coordination of deployment of two different gears in the same station was complex, making difficult to obtain the same soak times for both gears. Several seabird by-catch mitigation strategies were used in a combined manner (Figure 2; Table 3). Most of them have been described in the EU regulation applicable to Antarctic fisheries (EC, 2004). Control settings without any means of preventing seabird by-catch were not carried out, because the objective was to avoid by-catch using simple solutions (Hall et al., Reference Hall, Alverson and Metuzals2000), not to assess their effectiveness, which has been already described (Løkkeborg, Reference Løkkeborg1998, Reference Løkkeborg2003; Weimerskirch et al., Reference Weimerskirch, Capdeville and Duhamel2000; Løkkeborg & Robertson, Reference Løkkeborg and Robertson2002; Bull, Reference Bull2007). Longlines were deployed just before dawn (night-setting): one seabird-scaring streamer line was used in combination with minimum lighting, line weighting, thawed baits and appropriate discard management. In order to prevent entanglement due to strong winds, eight longlines were deployed without any scaring strimmer line. Longlines were hauling during the day (day-hauling): an experimental curtain, based on the ‘Brickle curtain’ (Brothers et al., Reference Brothers, Cooper and Løkkeborg1999) was always used in combination with appropriate discard management.
Photographs showing the seabird mitigation devices. (A) Towed streamer line rigged with tapes; (B) towed streamer line rigged with ropes; (C) experimental curtain for hauling.

Characteristics of the longline hauls. Sampling block (Block), date, monofilament gear (Mn), multifilament gear (Mt), start position (Lat, latitude; Long, longitude), average start depth (m), and hooks deployed (number). For each set, catch in weight (kg) of deep-water sharks, lotids and vulnerable marine ecosystems indicator taxa are given (values <0.1 are noted as +). SG, sponges; GO, gorgonians; SP, sea pens; SF, soft corals; BC, black corals; CC, cup corals; SC, stony corals; LC, lace corals.

Technical characteristics of the bottom longlines. (Mn, monofilament gear; Mt, multifilament gear). Average values ± SD of the mean soak time are given. Presence of safety line (SL), weighs (W) and alternate floats and weights (AFW) is noted as +.
Seabird by-catch mitigation strategies used during the survey.

Data collection and analysis
Two scientific observers experienced in deep-water fisheries were onboard the vessel. At each station, they recorded information on: (i) longline characteristics, number of hooks deployed, location, time and depth for setting and hauling; (ii) landings and discards in weight (iii) fish length; (iv) by-catch of benthic invertebrates; and (v) behaviour/by-catch of seabirds. Any litter and gillnets found were also recorded. Fish and seabirds were identified at the lowest possible taxonomic level using available literature. Photographs were taken for subsequent verification. Invertebrates (hooked/entangled) were recorded, including the epifauna over the substrata collected by the gear. Samples were photographed and preserved in ethanol as ‘voucher’ specimens for subsequent final identification at the laboratory. Standard measurements of fish species were taken by sex (total length, in the case of deep-water sharks and lotids). In each set, all the individuals of the target species were measured, except when the numbers were excessively large or the individuals were damaged. In this case, a sample was taken randomly. Total catch per unit of effort (CPUE) was calculated as a relative index of abundance, following the equation: CPUE = catch in kg/1000 hooks on the longline. Average depth of each longline was calculated as the arithmetic mean of depth at start, middle and end positions. Despite expected differences in catchability, catch data from the two gears were pooled in order to simplify analyses. Spanish multidisciplinary surveys (undertaken between 2005 and 2007) on the western slope of Hatton Bank (Durán Muñoz et al., Reference Durán Muñoz, Sayago-Gil, Cristobo, Parra, Serrano, Díaz del Rio, Patrocinio, Sacau, Murillo, Palomino and Fernández-Salas2009) provided data used in this study.
RESULTS
Catch composition and discards
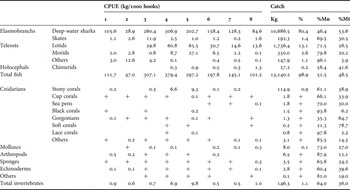
Catch composition is presented in Tables 1, 4, 5 & 6. Deep-water sharks (Scyliorhinidae, Pseudotriakidae, Dalatiidae and Centrophoridae) dominated the catches and contributed with 80.4% in terms of weight. This was due mainly to the predominance of Centrophorus squamosus and Centroscyllium fabricii (Reinhardt, 1825). Lotids (Lotidae), Molva dypterygia and Brosme brosme, were the predominant teleosts in terms of weight (13.1%). Cnidarians were the clearly dominant invertebrates, particularly the stony corals (colonial Scleractinea), Madrepora oculata (Linnaeus, 1758), Lophelia pertusa (Linnaeus, 1758) and to a lesser extent Solenosmilia variabilis (Duncan, 1873). They contributed 0.9% in terms of weight. In terms of catch composition by gear (Table 4), 53.6% of the catches of sharks in weight were obtained with the multifilament longline. In the case of lotids and stony corals, catches from the monofilament longline represented 71.5% and 61.1% of the total weight captured of these taxa respectively.
Values of catch per unit effort (CPUE) (kg/1000 hooks) obtained in the Hatton Bank area, by taxa and sampling block. For each taxon, the contribution to the total catch in weight (kg) and percentage (%) is presented. Percentages of total catch obtained with monofilament gear (%Mn) and multifilament gear (%Mt) are also given. Values < 0.1 are noted as +. Taxa are listed by weight.

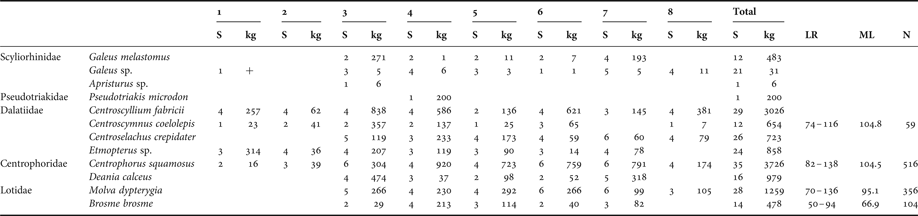
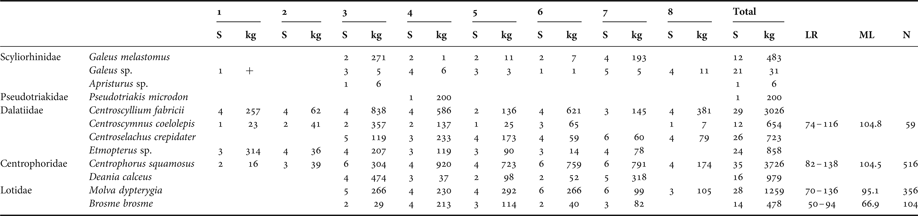
Deep-water sharks and lotids captured with longlines in the Hatton Bank area. For each species, the number of longline sets (S) where the species was encountered and the catch in weight (kg) in each sampling block are given (values < 0.1 are noted as +). For the vulnerable species referred to in the text, information on length-range (LR) and mean length (ML) in cm, and number of individuals measured (N) is presented.
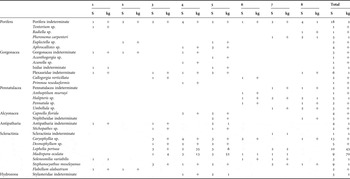
Vulnerable marine ecosystems indicator species captured with longlines in the Hatton Bank area. For each species, the number of longline sets (S) where the species was encountered and the catch in weight (kg) in each sampling block are given (values < 0.1 are noted as +).

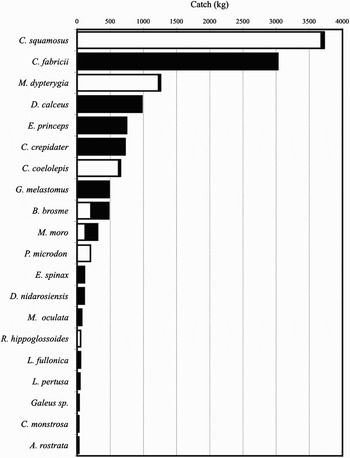
Discards represented 54% of the total catch in terms of weight. The discarded and retained fractions for the species with total catch greater than 25 kg are presented in Figure 3. Discards were dominated by deep-water sharks that contributed nearly 84% of total weight discarded. Discards were composed of non-commercial species as well of individuals from the commercial ones, discarded due to damages caused by amphipods and predators.
Discarded (white) and retained (black) fractions for the main species (total catch >25 kg) in terms of weight. The species are listed by total catch.

Distribution patterns of vulnerable, threatened and/or declining fish species
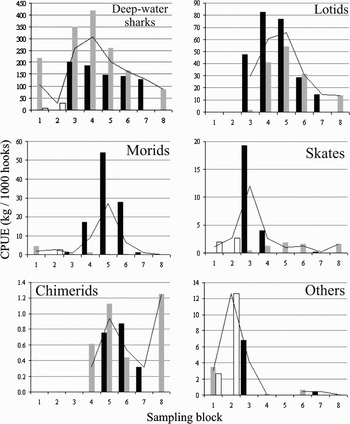
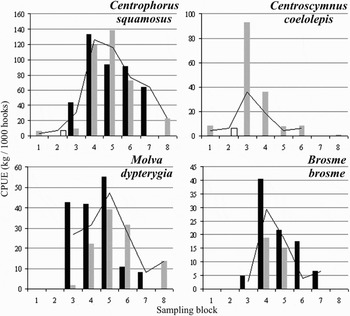
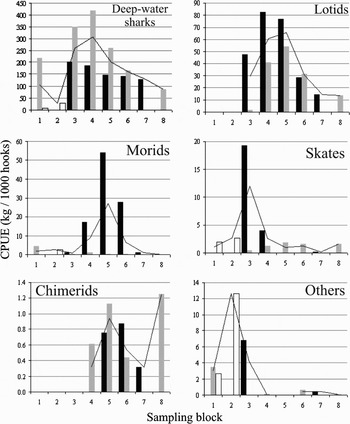
Table 4 and Figure 4 present CPUE values for main taxa. Deep-water sharks and lotids show high values along the western slope and south-eastern flank of the Hatton Bank. Morids (Moridae) and holocephals (Chimeridae) were abundant along the western slope, while skates (Rajidae) were caught along the whole study area. All other species were pooled in a group of ‘others’. It was more abundant in the south. Centrophorus squamosus and Centroscymnus coelolepis occurred along the study area in deep waters (Figure 5). The first was caught predominantly on the western slope of the Hatton Bank (blocks 4, 5 and 6) at depths ranging from 750 to 1200 m, while the second was more abundant on the south-eastern flank (block 3) and Central Area (block 4) at depths from 1000 to 1200 m, being absent in shallow depths (<1000 m). Molva dypterygia and Brosme brosme, were also more abundant along the Hatton Bank (Figure 5), but Brosme brosme was absent on the north-eastern flank (block 8). Lotids were not found south to 57°N (blocks 1 and 2). Highest CPUE values for both species were obtained at shallow depths (<1000 m) on the western slope (blocks 4, 5 and 6). Length-range and mean length for these four vulnerable species are presented in Table 5, showing that longline catches were composed of large individuals.
Values of catch per unit of effort (kg × 1000 hooks) for the main taxa of fish, by depth strata (black bars, <1000 m; grey bars, 1001–1200 m; white bars, >1201 m; black line, total) and sampling block.
Values of catch per unit of effort (kg × 1000 hooks) for the main vulnerable deep-water sharks and gadoid species, by depth strata (black bars, <1000 m; grey bars, 1001–1200 m; white bars, >1201 m; black line, total) and sampling block.

Distribution patterns of vulnerable benthic invertebrates
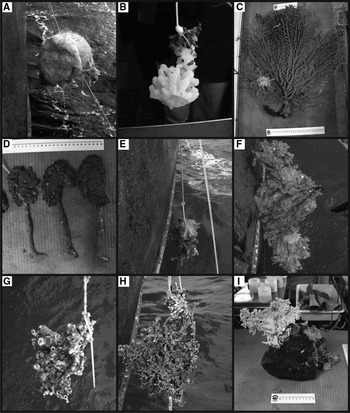
Deep-water sponges (demosponges and hexactinellids) and cold-water corals (reef builders and coral garden components) were identified in longline by-catch (Tables 1, 4 & 6; Figure 6). According to the FAO (2009), these are examples of taxa which may contribute to forming VMEs. Coral by-catch occurred when longlines were deployed along the western flank of the Hatton Bank. Stony corals (colonial Scleractinia) were recorded in the Central Area (block 4) and the Ridges and Mounds Area (block 5). Cup corals (solitary Scleractinia), gorgonians such as bamboo corals and seafans (Gorgonacea), soft corals (Alcyonacea), black corals (Antipatharia), and lace corals (Stylasteridae), were also captured. Although corals occurred between 850 and 1150 m depth, stony corals by-catch was higher at shallow depths (<1000 m). In the North-western Area (block 6) stony corals were also recorded, in addition to gorgonians and cup corals. The strict outcrop was a suitable hard substratum to most vulnerable species, but some of them are associated with a sandy-mud deposit (drift) that sometimes slightly covers the outcrop (Sayago-Gil et al., Reference Sayago-Gil, Long, Hitchen, Díaz-del-Río, Fernández-Salas and Durán-Muñoz2010). This is possibly why sea pens (Pennatulacea) were observed in this area. Here, corals were obtained at depths from 850 to 1200 m. Stony corals, cup corals and sponges were captured also in the southern part of the bank (block 3). Large hexactinellid sponges that characterize sponge-dominated biotopes (Barthel et al., Reference Barthel, Tendal and Tiel1996) on sandy-muddy grounds were recorded in the eastern slopes (blocks 7 and 8) at depths ranging from 800 to 1200 m. Sea pens and cup corals also occurred in such areas at similar depth-range. A small demospongid species was found in block 8 (1100 m depth) while fragile and small hexactinellid glass sponges were found in shallow waters (<1000 m) of the western slopes (blocks 4 and 5). Stony corals, black corals, sponges and particularly gorgonians occurred in the Edoras Bank (block 1) at depths ranging from 1000 to 1200 m. Cup corals were also recorded in this zone (>1200 m depth).
Photographs showing some examples of vulnerable marine ecosystems indicator species captured. (A) Large hexactinellid sponge; (B) small glass sponge; (C) gorgonian; (D) sea pens; (E) soft coral; (F) black coral; (G) cup corals over coral skeletons; (H) stony corals; (I) lace coral.

Seabirds
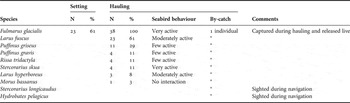
Ten seabird species were identified and their behaviour was recorded (Table 7). Fulmarus glacialis was sighted during 23 night-setting operations (61% of the total) flying near the stern end of the vessel, and looking for baited hooks just behind the streamer line. Seabirds were not observed in the remaining night-setting operations: this does not necessarily indicate absence of seabirds, since sightings were very difficult due to darkness in the absence of vessel lights. Seabirds, particularly Fulmarus glacialis, were observed near the vessel during the day-hauling operations. This species was always present during the hauling (sometimes more than 300 estimated individuals). Seabirds waited on the opposite side of the hauler (close to where offal, spent baits and discards were discharged) or were near the line-hauler side, swimming or waiting for fallen fish or fallen bait. One individual of Fulmarus glacialis was captured during haul-in operations within block 6. The seabird was freed and it survived.
Seabirds observed in the Hatton Bank area and interactions with longlining. For each species the setting/hauling operations in which the species was observed are presented, in number (N) and percentage (%). Seabird behaviour during hauling is summarized: feeding fishing waste and generally in front of the hauling area feeding fall fish/baits (very active), feeding fishing waste following the vessel (moderately active), feeding fishing waste following the vessel, but generally far away (few active), interaction was not observed (no interaction). Seabird by-catch and other observations are also given (no by-catch is noted as *).

Extra data on marine litter and derelict deep-sea gillnets
A variety of litter items weighing 13 kg were recovered in the longlines, including some fishery-related items: (i) glass; (ii) plastic; (iii) steel and other metals; and (iv) textile. Fragments of derelict deep-sea gillnets were fished in north-western (block 6) and southern parts of the bank (block 3), a fragment of longline was captured in the north-eastern part (block 8) and a piece of steel rope (trawl rope?) was recovered in shallow block 7. Moreover, an abandoned gillnet was observed in block 7 (800 m depth).
DISCUSSION
Effects on vulnerable fisheries resources
Effects of the longline fishery on fish species are strictly related to the size of hooks, the particular type of longline, the bait, and the feeding behaviour of fish (Bjordal & Løkkeborg, Reference Bjordal and Løkkeborg1996). Here, the catch composition was dominated by deep-water sharks as in previous studies (Clarke et al., Reference Clarke, Borges and Officer2005; Fossen et al., Reference Fossen, Cotton, Bergstad and Dyb2008) suggesting that large deep-water chondrychthyes have high catchability to bottom longlining, in particular in complex coral habitats such as the Hatton Bank outcrop. Sharks and gadoids species may be more abundant in cold-water coral habitats (Table 4) than elsewhere (Husebø et al., Reference Husebø, Nøttestand, Fosså, Furevik and Jørgensen2002; Costello et al., Reference Costello, McCrea, Freiwald, Lundälv, Jonsson, Bett, van Weering, de Haas, Roberts, Allen, Freiwald and Roberts2005; Ross & Quattrini, Reference Ross and Quattrini2007; Buhl-Mortensen et al., Reference Buhl-Mortensen, Vanreusel, Gooday, Levin, Priede, Mortensen, Gheerardyn, King and Raes2010). The length distributions observed in the catches when compared with minimum size of sexual maturity, indicates that in the study area, summertime longline catches of both Centrophorus squamosus and Centroscymnus coelolepis, were mainly composed of large individuals. Longlines were rigged with relatively small hooks, but small individuals of both shark species were not caught as in previous studies based upon trawl and longline catches (Girard & Du Buit, Reference Girard and Du Buit1999; Clarke et al., Reference Clarke, Connolly and Bracken2002; Bañón et al., Reference Bañón, Piñeiro and Casas2006). Centrophorus squamosus ranged in length from 82 to 138 cm (ML = 104.5 cm, N = 516). Only two individuals were larger than 128 cm, the size of female maturation, but 70% of the individuals measured were larger than 101 cm in length, the size of male maturation (Clarke et al., Reference Clarke, Connolly and Bracken2002). With regard to Centroscymnus coelolepis (LR = 74–116 cm, ML = 104.8 cm, N = 59), 72% of the individuals were larger than 102 cm in length, the size of female maturation (Girard & Du Buit, Reference Girard and Du Buit1999). Length-ranges of sharks captured with longlines were narrower than those reported previously based upon trawl catches (Girard & Du Buit, Reference Girard and Du Buit1999; Clarke et al., Reference Clarke, Borges and Officer2005). Catches of lotids were also preferentially composed of large and adult individuals. 80% of Molva dypterygia (LR = 70–136, ML = 95.1 cm, N = 356) were larger than 88 cm in length, the size of female maturation (Magnusson & Magnusson, Reference Magnusson, Magnusson and Hopper1995). In the case of Brosme brosme (LR = 50–94, ML = 66.9 cm, N = 104), all of the individuals were larger than 45 cm, the maturity size for both sexes (Magnusson et al., Reference Magnusson, Bergstad, Hareide, Magnusson and Reinert1997). Longlines appear to select for larger lotids than commercial trawls (ICES, 2009).
The high discard ratio observed during the experimental survey, was a consequence of the longline catch composition in the outcrop area: catches were largely dominated by deep-water sharks, which have low market interest, except Centrophorus squamosus and Centroscymnus coelolepis, the main retained species. Among teleosts, only Molva dypterygia, Brosme brosme and a few other species captured such as Mora moro (Risso, 1810), Reinhardtius hippoglossoides (Walbaum, 1792), Lophius piscatorius (Linneaus, 1758) and Aphanopus carbo (Lowe, 1839) have currently commercial interest in longline fisheries. The current ban of deep-water shark fisheries, as well as the restrictive quotas for other commercial deep-sea species (EC, 2008a) suggests that bottom longlining in the Hatton Bank cannot be profitable now because the main catch can no longer be marketed.
Effects on benthic habitat
Chuenpagdee et al. (Reference Chuenpagdee, Morgan, Maxwell, Norse and Pauly2003) indicate that the level of by-catch and the habitat impact associated with demersal longlines is moderate. However, the present longline survey agrees with previous studies (Bavestrello et al., Reference Bavestrello, Cerrano, Zanzi and Cattaneo-Vietti1997; Butler & Gass, Reference Butler, Gass, Willison, Hall, Gass, Kenchington, Butler and Doherty2001; Krieger, Reference Krieger, Willison, Hall, Gass, Kenchington, Butler and Doherty2001; Witherell & Coon, Reference Witherell, Coon, Willison, Hall, Gass, Kenchington, Butler and Doherty2001; Fosså, et al., Reference Fosså, Mortensen and Furevik2002; Krieger & Wing, Reference Krieger and Wing2002; Reed, Reference Reed2002; Gass & Willison, Reference Gass, Willison, Freiwald and Roberts2005; Mortensen et al., Reference Mortensen, Buhl-Mortensen, Gordon, Fader, McKeown, Fenton, Barnes and Thomas2005, Reference Mortensen, Buhl-Mortensen, Gebruk and Krylova2008; Orejas et al., Reference Orejas, Gori, Lo Iacono, Puig, Gili and Dale2009) suggesting that bottom longlining has negative impact on VMEs when their distributions overlap with the fishing grounds. In the presence of strong currents, large weights were required for bottom longlining, and such weights can also damage corals as Reed (Reference Reed2002) suggests. Equally, weighting lines to increase sink speed to minimize seabird by-catch can also contribute to entangling on corals. In the present study, movements of the longlines over the seabed were often recorded. This suggests bigger impacts of strong currents dragging the lines across the bottom causing coral entangling, as was indicated previously by Clark & Koslow (Reference Clark, Koslow, Pitcher, Morato, Hart, Clark, Haggan and Santos2007). Even though bottom longlines are expected to be much less damaging to corals than trawls, it may still represent a threat if fishing intensity is high (Bavestrello et al., Reference Bavestrello, Cerrano, Zanzi and Cattaneo-Vietti1997; Mortensen et al., Reference Mortensen, Buhl-Mortensen, Gordon, Fader, McKeown, Fenton, Barnes and Thomas2005). An additional concern is the ability to use longlines to fish rocky areas that are inaccessible to trawls. The present survey indicates that the Hatton Bank outcrop is a key area for VMEs indicator species (cold-water corals and sponges; Table 6) as was reported in previous studies (Roberts et al., Reference Roberts, Henry, Long and Hartley2008; Durán Muñoz et al., Reference Durán Muñoz, Sayago-Gil, Cristobo, Parra, Serrano, Díaz del Rio, Patrocinio, Sacau, Murillo, Palomino and Fernández-Salas2009; Howell et al., Reference Howell, Davies and Narayanaswamy2010). By-catch data confirm the presence of VMEs within the current NEAFC cold water coral protection area (EC, 2009; NEAFC, 2010), but also suggest some areas of VME indicator species close to the current closure boundary, further suggesting some revision of closure boundaries should be considered.
Interactions with seabirds
As in previous studies (Bertellotti & Yorio, Reference Bertellotti and Yorio2000; Weimerskirch et al., Reference Weimerskirch, Capdeville and Duhamel2000), here it was observed that discharged discards and offal are attractive as a food source for seabirds (particularly scavengers) and possibly have a positive effect on population size trends as Furness (Reference Furness2003) suggests. But by-catch can cause direct mortality in Fulmarus glacialis and reduce their abundance. The survey showed that seabirds can also be accidentally captured during hauling (however they can be easily released alive). Nevertheless, seabird scaring-strimmer lines and curtains used in combination with the operational measures described in the literature (Bull, Reference Bull2007) can reduce seabird by-catches. Most of these mitigation strategies used have been successfully implemented in other high seas areas (e.g. the Antarctic), and could be used in the NEAFC Regulatory Area. Mitigation devices are simple, economic to manufacture by the crew, and easy and safe to use, at least in summertime south of 60°N. The traditional longliner configuration needs to be improved in order to manage discards and offal better (the ability to discharge offal on the opposite side of the hauler is recommended).
Other environmental issues
Most of the encounters with litter were recorded on the eastern slope of the Hatton Bank. Litter, particularly plastics, can produce damage on diverse marine fauna (Hutton et al., Reference Hutton, Carlile and Priddel2008; Graham & Thompson, Reference Graham and Thompson2009). Hess et al. (Reference Hess, Ribic and Vining1999) suggest that distribution of benthic litter possibly may be due to hydrodynamic circulation and human activity patterns. Despite the ban of gillneting in deep-waters of the NEAFC Regulatory Area (NEAFC, 2006; EC, 2007), a derelict deep-sea gillnet was observed there. This suggests that retrieval exercises to recover gillnets would be welcome in order to prevent ‘ghost fishing’ (Matsuoka et al., Reference Matsuoka, Nakashima and Nagasawa2005) on the rocky bottoms of the Hatton Bank, but gillnet-retrieval gears (Large et al., Reference Large, Graham, Hareide, Misund, Rihan, Mulligan, Randall, Peach, McMullen and Harlay2009) could produce damage to vulnerable benthos.
ACKNOWLEDGEMENTS
We are grateful to the longliner shipowners and crew, who collaborated with data collection. Thanks are also due to IEO staff involved in the study, especially to E. Román, T. Patrocinio, G. Fernández and X. Valeiras, for their help with taxonomy. We thank the anonymous referees for their constructive and valued suggestions on the draft manuscript. The survey was funded by the European Union (EFF), the Spanish Government, General Secretary of the Sea (SGM) and the Spanish Institute of Oceanography (IEO) under the Spanish ECOVUL/ARPA project.