1. Introduction
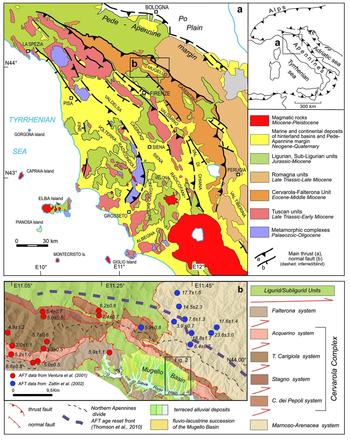
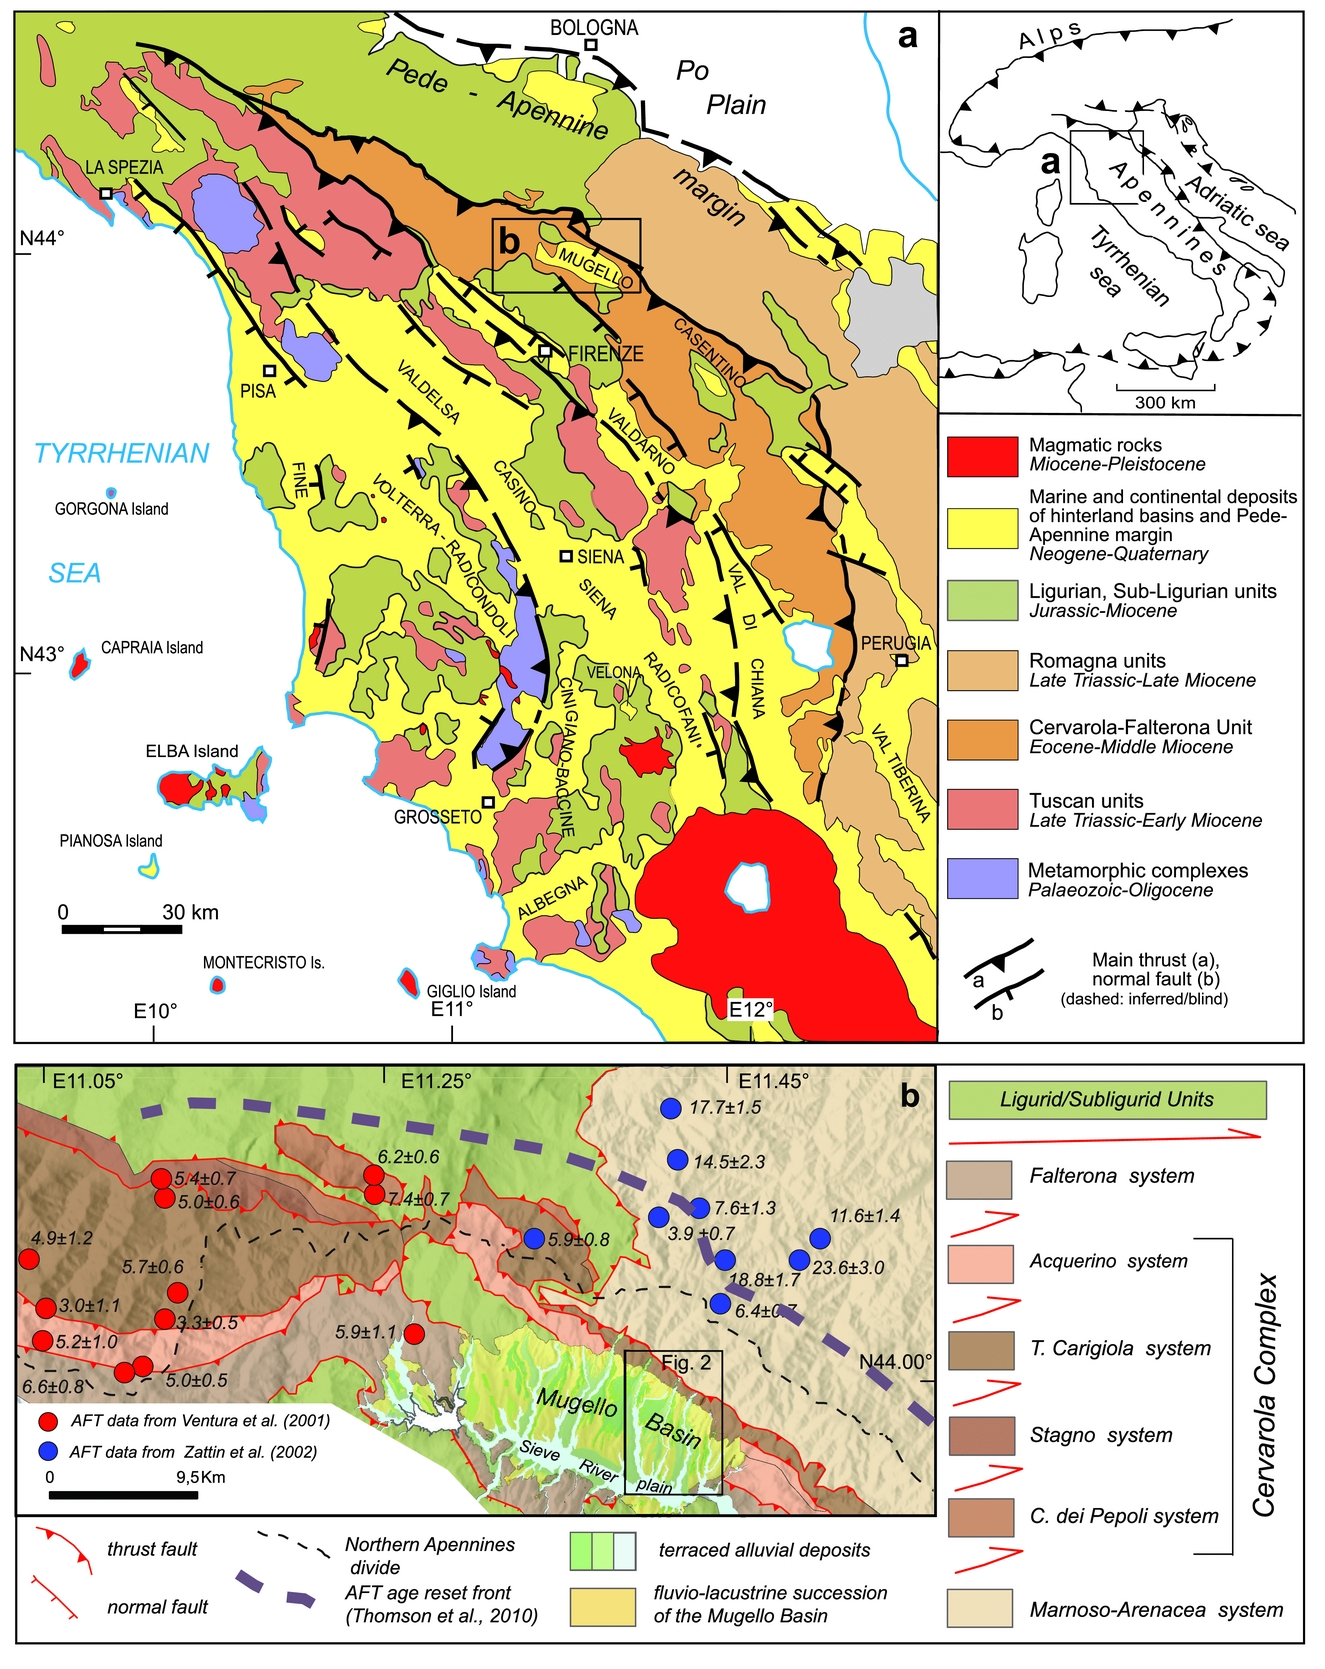
Detrital thermochronology of samples collected following the stratigraphic order through the sedimentary succession of a basin may supply insights into the exhumation history of basin shoulders, providing that no reheating to temperature above the thermal sensitivity of the used thermochronometer has occurred after deposition (e.g. Garver et al. Reference Garver, Brandon, Roden-Tice, Kamp, Ring, Brandon, Willett and Lister1999; Bernet & Spiegel, Reference Bernet, Spiegel, Bernet and Spiegel2004). When basin shoulders are composed of lithostratigraphic units that differ regarding their age patterns, the analysis of their age signatures in the sediments can reveal subtle structural relationships that the complex shoulder architecture can make difficult to ascertain even in the field. In this study, we apply detrital apatite fission-track (AFT) thermochronology to the fan-delta sediments exposed along the NE shoulder of Mugello Basin in the Northern Apennines. The Mugello Basin is the youngest intermontane basin, and the closest to the main Apennine watershed (Fig. 1a). Its shoulders are made of tectonosedimentary units piled up in an imbricated thrust-sheet system related to the development of the Northern Apennines Orogen (Fig. 1b), which formed during the Cenozoic subduction and northwards translation of the Adriatic slab beneath the European Plate (e.g. Molli & Malavieille, Reference Molli and Malavieille2011; Argnani, Reference Argnani2012; Malusà et al. Reference Malusà, Faccenna, Baldwin, Fitzgerald, Rossetti, Balestrieri, Danišík, Ellero, Ottria and Piromallo2015). Basin formation in the hinterland sector of the Northern Apennines chain is classically framed within a post-late Miocene extensional tectonic regime superimposed onto the previous compressional structures (Martini & Sagri, Reference Martini and Sagri1993). However, recognition of compressive deformation structures involving also the basin fills and reconsideration of basin tectonosedimentary development have suggested an alternate or dominant role of crustal compression in basin origin, with extensional tectonics superimposed only at a later stage (Bonini & Sani, Reference Bonini and Sani2002; Sani et al. Reference Sani, Bonini, Piccardi, Vannucci, Delle Donne, Benvenuti, Moratti, Corti, Montanari, Sedda and Tanini2009). A first attempt to use detrital thermochronology to differentiate between different styles of deformation affecting basin shoulders was performed by the authors in the more internal Valdelsa Basin (Balestrieri, Benvenuti & Tangocci, Reference Balestrieri, Benvenuti and Tangocci2013) (Fig. 1a). In that study a general model that allows discrimination between the different deformation styles affecting syntectonic basin systems, on the basis of the different signature released in the basin-fill by superimposed tectonostratigraphic units, was proposed.
(a) Simplified tectonic sketch of the Northern Apennines including the Quaternary Mugello Basin. (b) Sketch map of the axial portion of the Northern Apennines. Previously published AFT data from the bedrock units are indicated.
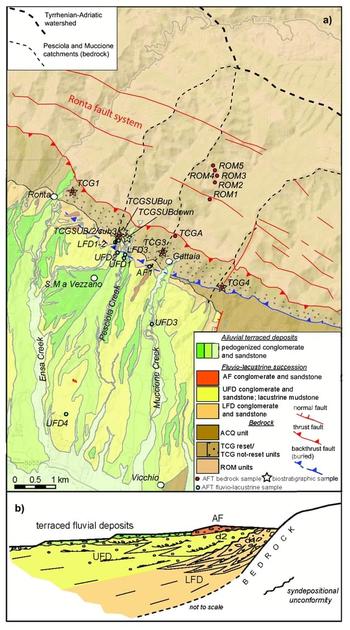
In the present study, we applied detrital AFT thermochronology to the proximal lower Pleistocene fan-delta sediments exposed along the NE margin of the Mugello Basin and progressively deformed by the syndepositional activity of a SW-verging backthrust. The aim was to test the capability of detrital thermochronology to discriminate between the different styles of deformation and to constrain the timing of backthrust activity. As the modern creeks along the NE flank of the basin drain the same catchments (Fig. 2a) as the early Pleistocene fan deltas (Benvenuti, Reference Benvenuti1997, Reference Benvenuti2003), the signals detected in the sedimentary section are truly representative of the evolution of the adjacent basin shoulder. The availability of a large apatite FT and U–Th/He bedrock dataset across the Northern Apennine chain (Thomson et al. Reference Thomson, Brandon, Reiners, Zattin, Isaacson and Balestrieri2010) allows for a straightforward coupling of the detrital signatures in basin sediments and their bedrock sources. To complement the available bedrock thermochronological data close to the study area (Fig. 1b), we also analysed some bedrock samples that gave unexpected insights into the pre-Quaternary tectonostratigraphic setting of this axial sector of the Northern Apennines, well before the formation of the Mugello Basin. These new bedrock data extend back in time to the syn-chain formation history, the information obtained through our AFT study, whereas detrital data helped to determine the deformation pattern of the NE shoulder of the Mugello Basin and its implication for the late-stage evolution of the Northern Apennines chain.
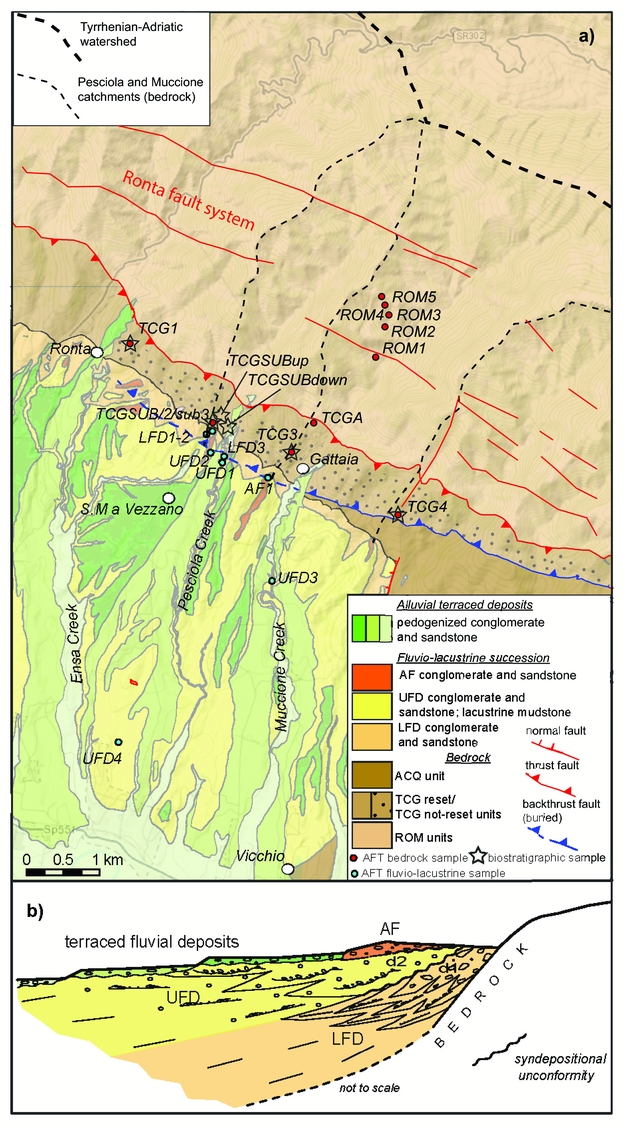
(a) Detailed geological map of the study area and location of the samples for AFT and biostratigraphic analysis. ROM – Romagna units; TCG – Torrente Carigiola Unit; ACQ – Acquerino; LFD – lower fan delta; UFD – upper fan delta; AF – alluvial fan. (b) Stratigraphic scheme of the fluvio-lacustrine succession characterizing the NE margin of the Mugello Basin (after Benvenuti, Reference Benvenuti2003).
2. Geological setting
2.a. Substratum geology
The Mugello Basin, located c. 30 km north of Florence, is a WNW–ESE intermontane depression 25 km long and 15 km wide, filled with Quaternary alluvial and lacustrine deposits and drained by the Sieve River, one of the most important Arno River tributaries. The internal basin hydrography consists of a dense network of small tributaries of the Sieve River descending from the basin margins (Fig. 1b). The substratum of the basin is made of tectonosedimentary units piled up in an imbricated thrust-sheet system developed during the Cenozoic formation of the Northern Apennine chain. They consist of turbidite sediments accumulated in migrating successive foredeep basins (Cibin et al. Reference Cibin, Di Giulio, Martelli, Catanzariti, Poccianti, Rosselli, Sani, Lomas and Joseph2004; Di Giulio et al. Reference Di Giulio, Mancin, Martelli and Sani2013), and later underthrust beneath the ocean-derived Ligurian units forming a Cretaceous–Palaeogene accretionary prism (Cerrina Feroni, Ottria & Ellero, Reference Cerrina Feroni, Ottria, Ellero, Crescenti, D'Offizi, Merlino and Sacchi2004; Malusà et al. Reference Malusà, Faccenna, Baldwin, Fitzgerald, Rossetti, Balestrieri, Danišík, Ellero, Ottria and Piromallo2015). The underthrusting beneath the Ligurian units in the area corresponding to the modern Mugello Basin is of Langhian age (Zattin et al. Reference Zattin, Landuzzi, Picotti and Zuffa2000), and their erosion above the NE shoulder of the basin is constrained to the end of Pliocene time (Fig. 1b).
The bedrock of the NE margin of the Mugello Basin is represented by the Tuscan units (Falterona–Cervarola complex, Fig. 1b) in turn overthrust onto the Romagna units (Fig. 2a). From a lithological point of view, all these units are composed of sandstones and siltstones forming a thick monotonous succession of graded tabular beds deposited during early–middle Miocene time. These rocks are rich in apatite (Gazzi, Reference Gazzi1965; Gandolfi, Paganelli & Zuffa, Reference Gandolfi, Paganelli and Zuffa1983) and, with rather uniform lithology, they are inferred to have similar apatite fertility, which is defined as the variable propensity of different parent rocks to yield detrital grains when exposed to erosion (Malusà, Resentini & Garzanti, Reference Malusà, Resentini and Garzanti2016). Mineral fertility of the eroded bedrock is a critical issue because it may vary over an order of magnitude and is potentially the largest source of bias in detrital studies.
In detail, the stratigraphically lowermost unit of the foredeep complex is represented by the Chattian–Aquitanian Falterona turbidite system made of up to 2000 m of thickly bedded, frequently amalgamated, medium-to-very coarse sandstone at the base and sand- to mud-dominated, thick-to-thin beds to the top. The Chattian – lower Langhian Cervarola complex follows, including four turbidite systems: (1) Acquerino; (2) Torrente Carigiola; (3) Stagno; and (4) Castiglione dei Pepoli (Fig. 1b). They represent two main foredeep depocentres developed during Chattian – early Burdigalian time (Acquerino) and late Aquitanian – early Langhian time (Torrente Carigiola, Stagno and Castiglione dei Pepoli) (Cibin et al. Reference Cibin, Di Giulio, Martelli, Catanzariti, Poccianti, Rosselli, Sani, Lomas and Joseph2004; Di Giulio et al. Reference Di Giulio, Mancin, Martelli and Sani2013). As well as palaeogeographic and chronologic differences, these 1000–1400 m thick turbidite successions show fining- and thinning-upwards lithofacies stacking patterns similar to that of the Falterona system (Cibin et al. Reference Cibin, Di Giulio, Martelli, Catanzariti, Poccianti, Rosselli, Sani, Lomas and Joseph2004; Di Giulio et al. Reference Di Giulio, Mancin, Martelli and Sani2013). The Falterona–Cervarola complex is in turn overthrusted onto further uppermost Burdigalian–Tortonian turbiditic deposits of the Romagna units (Marnoso Arenacea Formation; Fig. 1b).
According to previous thermochronology studies (e.g. Thomson et al. Reference Thomson, Brandon, Reiners, Zattin, Isaacson and Balestrieri2010; Malusà & Balestrieri, Reference Malusà and Balestrieri2012), in the axial zone of the Northern Apennines the load of the Ligurian units and overlying Epiligurian successions fully reset the AFT system in the underlying foredeep units. Close to the study area, AFT data are available either for the Falterona and Cervarola units (Ventura, Pini & Zuffa, Reference Ventura, Pini and Zuffa2001) and for the Romagna units (Zattin, Picotti & Zuffa, Reference Zattin, Picotti and Zuffa2002). Fully reset AFT ages vary between 7.4±0.7 and 3.0±1.1 Ma (Fig. 1b).
In the study area, the Northern Apennines NE-verging thrust-sheet system is complicated by a backthrust (Fig. 2a) active during the Quaternary development of the fluvio-lacustrine basin (Boccaletti et al. Reference Boccaletti, Bonini, Moratti, Sani, Cello, Deiana and Pierantoni1995; Cerrina Feroni, Levi & Ottria, Reference Cerrina Feroni, Levi and Ottria2008; Sani et al. Reference Sani, Bonini, Piccardi, Vannucci, Delle Donne, Benvenuti, Moratti, Corti, Montanari, Sedda and Tanini2009). Furthermore, the NE margin is affected by a system of steeply SW-dipping normal faults (Ronta fault system; Coli et al. Reference Coli, Landuzzi, Sani, Vai and Bortolotti1992) subparallel to the thrust faults and to the backthrust (Fig. 2a), which hints at a recent extensional regime superimposed onto the crustal shortening structures.
2.b. The fluvio-lacustrine succession of the Mugello Basin
The infilling of the basin occurred during a fluvio-lacustrine phase and an alluvial phase (Benvenuti Reference Benvenuti1997, Reference Benvenuti2003). At the onset of the early fluvio-lacustrine phase (early Pleistocene), the Mugello Basin had an internal drainage; peat and silty clay up to 100 m thick were deposited in a palustrine environment in the western part of the basin and more than 600 m of sediment accumulated in the wider central sector of the basin. This thick succession consists of a basal wedge of alluvial conglomerate c. 20 m thick, detected only by cores (GEMINA, 1962), overlain by lacustrine silty clay with lignite lenses interbedded with fan-deltaic conglomerate and sandstone dominating towards the NE margin. The sediment dispersal during the fluvio-lacustrine phase was persistently from the NE, fed by torrential palaeostreams that generally matched the present hydrography (Fig. 2a). The fan-delta deposits along the NE basin margin dip towards the SSW with inclination ranging from vertical in the oldest strata to 10° in the youngest (Benvenuti, Reference Benvenuti1997, Reference Benvenuti2003). The transition from steeply to gently inclined strata varies from gradual to markedly unconformable, as indicated by two main angular unconformities d1 and d2 (Fig. 2b). Unconformity d1 delimits the lower fan-delta system (LFD) from the upper fan-delta system (UFD), whereas unconformity d2 separates the fan-delta deposits from alluvial-fan conglomerate and sandstone (AF) accumulated at the end of the fluvio-lacustrine phase. This tectonostratigraphic pattern is believed to be the result of a syndepositional deformation related to the activity of a SW-verging buried backthrust, hinting at shortening as the prevailing mode of stress affecting the basin during early Pleistocene time (Benvenuti, Reference Benvenuti1997; Sani et al. Reference Sani, Bonini, Piccardi, Vannucci, Delle Donne, Benvenuti, Moratti, Corti, Montanari, Sedda and Tanini2009).
The chronostratigraphic extent of the fluvio-lacustrine phase, based on continental vertebrate biochronology (Abbazzi et al. Reference Abbazzi, Benvenuti, Rook and Masini1995), corresponds mostly to early Pleistocene time (?Gelasian – upper portion of the Calabrian; 2–0.8 Ma). During the subsequent alluvial phase (?latest Calabrian – Holocene; 0.7–0 Ma) three major episodes of base-level fall occurred, resulting in a distinctly terraced alluvial succession comprising variably pedogenized gravels, sands and muds (Sanesi, Reference Sanesi1965; Benvenuti, Reference Benvenuti1997). Despite Quaternary basin evolution, glacial–interglacial fluctuations typical of this period did not leave clear footprints in the sedimentary record.
The deposits of the youngest fluvio-lacustrine subunit overlying the backthrust are not deformed. Accordingly, the end of backthrust activity can be dated to the end of early Pleistocene time.
3. The study area and AFT sampling
The fluvio-lacustrine succession has been sampled for detrital AFT analysis in the NE sector of the Mugello Basin (Fig. 2a), specifically in the present catchments of the Pesciola and Muccione creeks where LFD, UFD and AF deposits are exposed in the valleys and on their slopes (Fig. 2a, b). To avoid disturbances of the detrital grain age pattern by sediment mixing due to axial transport, we exclusively sampled sites entirely sourced by transverse creeks.
In the palaeo-Pesciola fan-delta complex, three detrital samples were collected from the LFD (LFD1–3) and 3 from the UFD (UFD1–2 and 4). Two samples were collected in the palaeo-Muccione fan delta: one in the UFD (UFD3) and the other in the AF (AF1).
In the two catchments, the pre-Quaternary bedrock overlain by the fluvio-lacustrine deposits consists of the Torrente Carigiola turbidite system thrusted onto the Marnoso–Arenacea Formation (Romagna units).
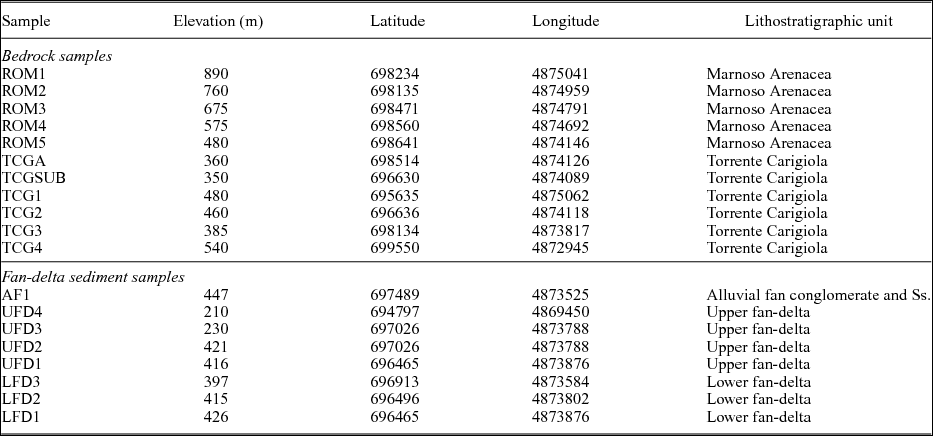
In the Pesciola catchment, two samples were collected from a sandstone outcrop in the Torrente Carigiola (TCGSUB, TCG2) at the stratigraphic contact between the bedrock and the LFD deposits. In the Muccione catchment, one sample comes from the Torrente Carigiola (TCGA) and five samples from the Marnoso–Arenacea (ROM1–5). They were collected following an elevation gradient from the lowermost (TCGA) to the highest (ROM5) samples. Further, three samples were collected along-strike in the Torrente Carigiola (TCG1, 3, 4) in a NW–SE direction (Fig. 2a). Geographic coordinates of all the samples are reported in Table 1.
Locations of Mugello Basin samples.

4. Methods
4.a. Fission-track method
Fission tracks in minerals represent linear damage zones produced by the radioactive decay of 238U. Over geological time fission tracks are fully retained in apatite at temperatures below 60°C, while they are only partially retained between 60°C and 120°C (partial annealing zone, PAZ) with a mean closure temperature of 110±10°C (Green & Duddy, Reference Green and Duddy1989). The annealing behaviour of fission tracks is sensitive to chemical composition. Diameter of etched spontaneous fission tracks measured parallel to apatite crystallographic c-axis (Dpar) is used as a proxy for track annealing kinetic properties (O'Sullivan & Parrish, Reference O'Sullivan and Parrish1995; Barbarand et al. Reference Barbarand, Carter, Wood and Hurford2003). In the present study Dpar values were measured in the bedrock samples. Measurement of fission-track lengths yields information about the way the rocks cooled through the PAZ. A quantitative evaluation of thermal history can be obtained through the application of statistical modelling procedures that find temperature–time (T–t) paths compatible with the fission-track data (Gallagher, Reference Gallagher1995; Ketcham, Reference Ketcham, Reiners and Ehlers2005; Ketcham, Donelick & Donelick, Reference Ketcham, Donelick and Donelick2000). In this paper, HeFty program v. 1.8.3 was employed. The program defines envelopes in a time–temperature space containing all paths that statistically yield ‘good’ and ‘acceptable’ fits with observed data, respectively. A model is considered ‘good’ if all statistical parameters are greater than 0.50, while it is considered ‘acceptable’ when statistical parameters are above 0.05.
For processing the sand and rock samples a standard method was applied at the FT laboratory of the CNR Institute of Geosciences and Earth Resources (Balestrieri et al. Reference Balestrieri, Pandeli, Bigazzi, Carosi and Montomoli2011).
In the detrital samples, all the available apatite grains were dated. In all the samples we managed to count over 60 grains and in 5 samples we counted more than 95 grains, which correspond to the 95% probability that no fraction ≥0.085 and ≥0.005 of the total, respectively, is missed (Vermeesch, Reference Vermeesch2004). The FT grain-age distributions were subjected to the χ 2 test (Galbraith, Reference Galbraith1981) to detect whether the datasets contained any extra-Poissonian error. A χ 2 probability of less than 5% denotes a significant spread of single-grain dates. For those samples that failed the χ 2 test, FT grain-age distributions were decomposed into main grain-age components using the binomial peak-fit method after Galbraith & Green (Reference Galbraith and Green1990) and Brandon (Reference Brandon1992, Reference Brandon1996). Peak ages were calculated with the BinomFit program (Brandon, Reference Brandon1992).
4.b. Biostratigraphy
Biostratigraphic analysis was performed on samples prepared from unprocessed material as smear slides, following standard procedures (Bown & Young, Reference Bown, Young and Bown1998). The calcareous nannofossils were observed using a light microscope at 1250× magnification. The presence and abundance of species diagnostic for dating and correlating the sampled sandstones to the Torrente Carigiola unit were evaluated quantitatively by counting a prefixed number of taxonomically related specimens (Rio, Raffi & Villa, Reference Rio, Raffi, Villa, Kastens and Mascle1990).
5. Results
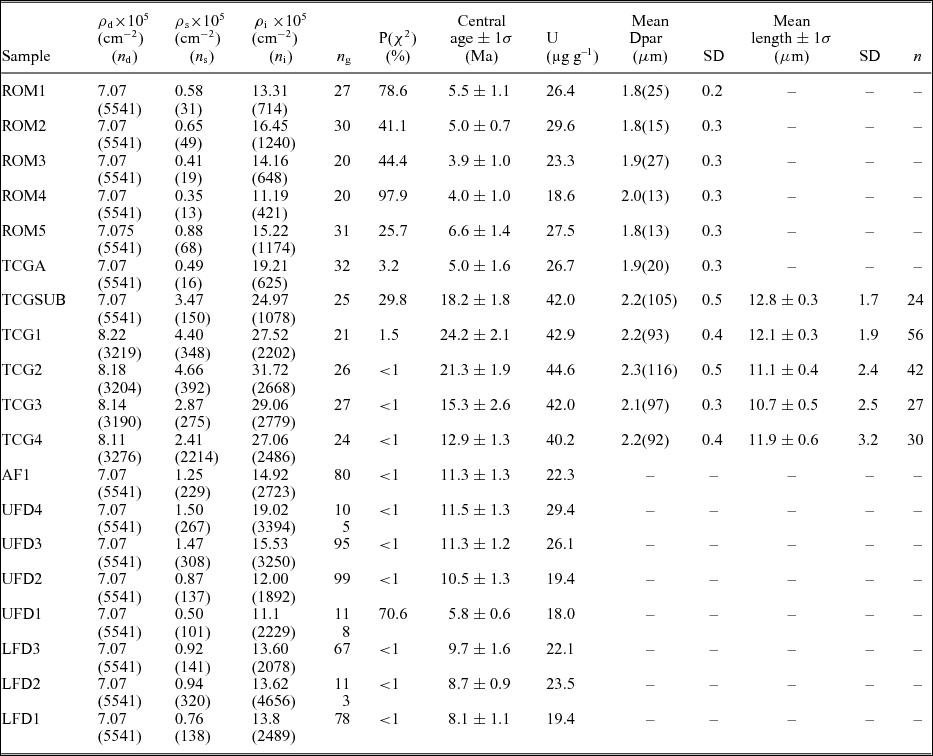
Results of the AFT analysis performed on bedrock and fluvio-lacustrine deposits are reported in Tables 2 and 3 and summarized as follows.
Apatite fission-track ages from Mugello Basin.
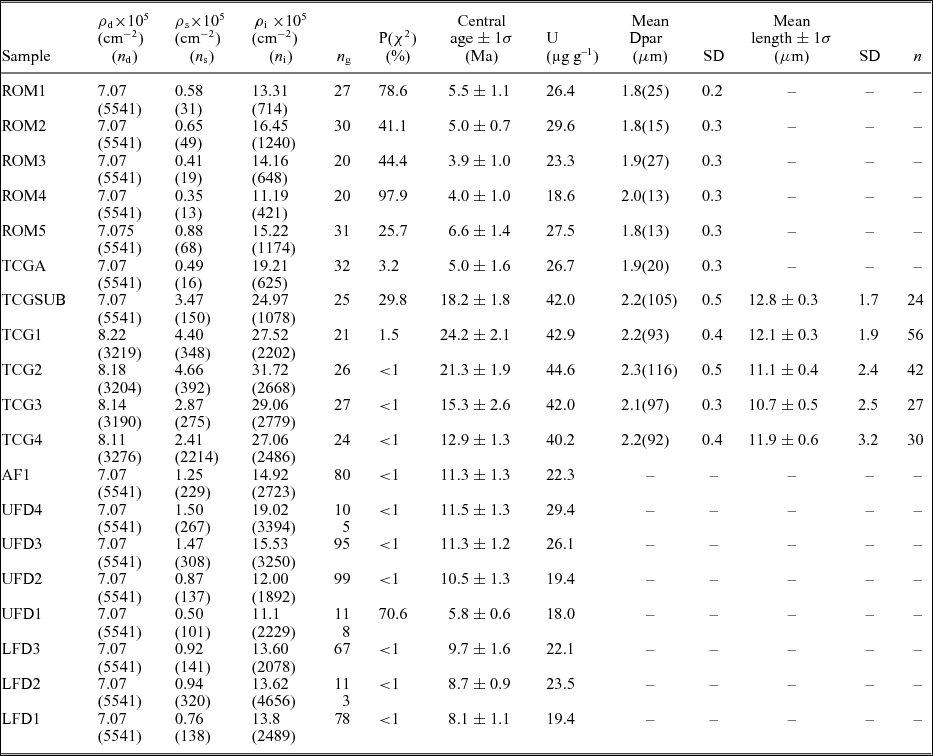
Notes: Ages determined by external detector method using a zeta value for dosimeter CN5 ζ = 360 ± 11 (referred to Fish Canyon Tuff and Durango apatite standards; Hurford, Reference Hurford1990). ρ d, ρ i: standard and induced track densities measured on mica external detectors; ρ s: spontaneous track densities on internal mineral surfaces. Track densities are given in 105 tracks cm−2. n d, n i, n s: number of tracks on external detectors and on mineral surfaces; n g: number of counted mineral grains. Central age calculated using Trackkey program (Dunkl, Reference Dunkl2002). U: content in uranium; P(χ)2: (χ 2) probability (Galbraith, Reference Galbraith1981); Dpar: mean etch pit diameter parallel to the c-axis for age grains, in brackets number of total measured Dpars; n: number of total measured track lengths.
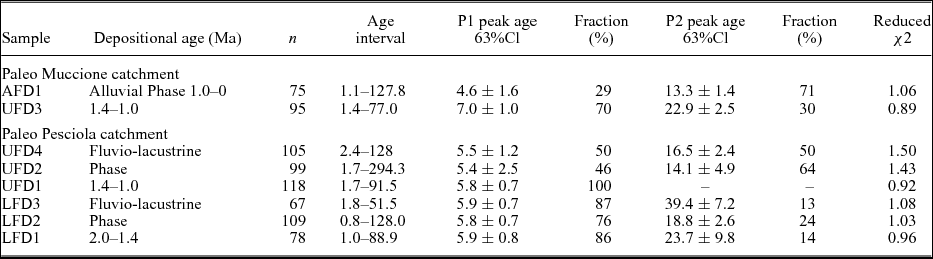
Mugello fan-delta sediments apatite fission-track peak ages.
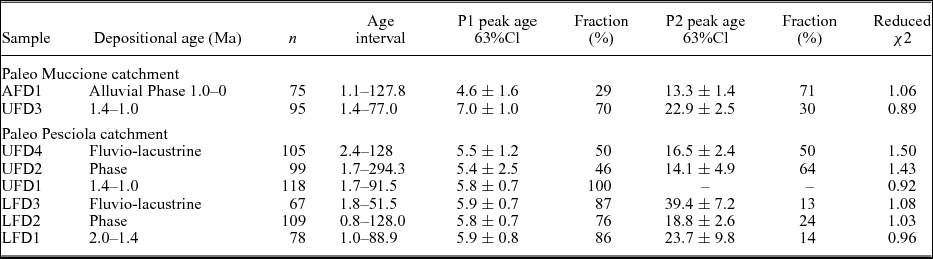
Notes: n, number of grains analysed for binomial peak fitting. Fraction of the analysed grains belonging to an age population in percent. Reduced (χ)2 test describing the probability of the fitting curve where a value of 1 coincides with a good fit.
5.a. Bedrock samples
The Marnoso–Arenacea Formation bedrock samples (ROM1-5) from the vertical profile collected in the Muccione catchment yielded FT ages ranging from 3.9 ± 1.0 Ma to 6.6 ± 1.4 Ma (Table 2). The TCGA sample at the base of the vertical profile (Table 2) has an age of 5.0 ± 1.6 Ma. Dpar vary between 1.8 and 2.0 µm. It was not possible to measure track lengths for samples from the vertical profile.
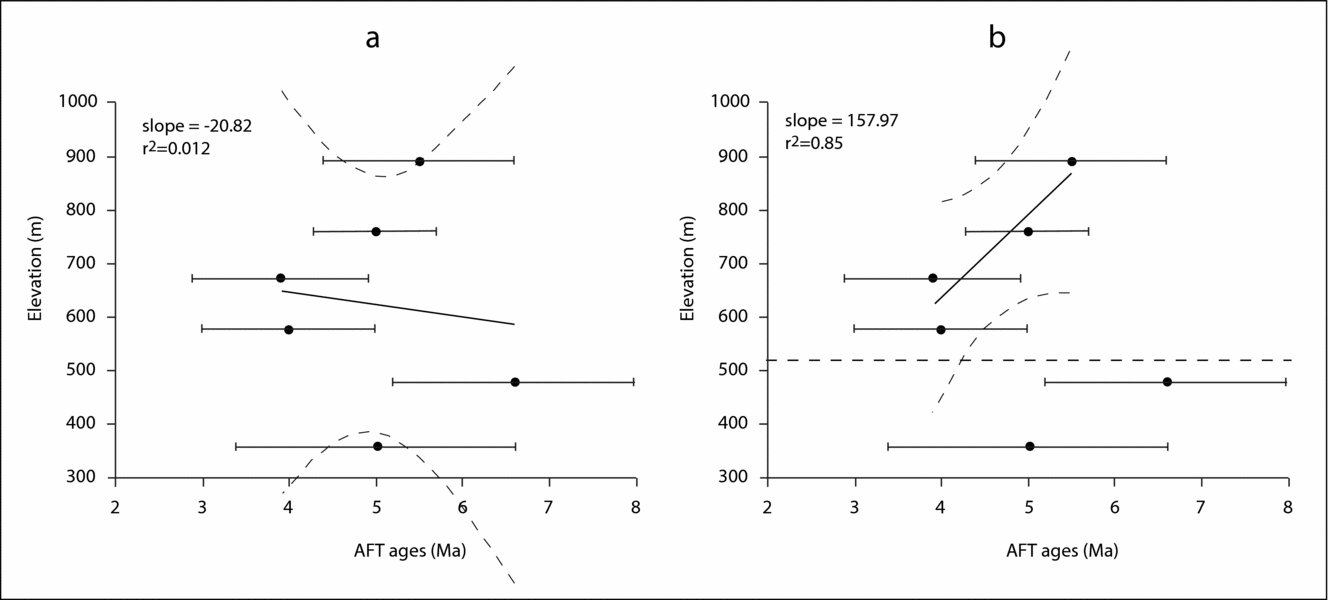
The NE shoulder of the Mugello Basin across which the vertical profile samples were taken is located inside the zone of the fully reset AFT ages at the core of the orogen (Thomson et al. Reference Thomson, Brandon, Reiners, Zattin, Isaacson and Balestrieri2010; Fig. 1b). AFT ages of the Marnoso–Arenacea samples (ROM1–5) are in the range of the completely reset samples of internal Marnoso–Arenacea Unit of the extensive study of Zattin, Picotti & Zuffa (Reference Zattin, Picotti and Zuffa2002). The AFT age of the TCGA sample (5.0 ± 1.6 Ma) at the base of the profile is in the same range as those from the same formation in the northern part of the basin (Ventura, Pini & Zuffa, Reference Ventura, Pini and Zuffa2001). In Figure 3a, the age–elevation relationship (AER) for the samples from the Muccione catchment vertical profile is shown. The regression analysis shows an unusual negative slope and a very poor linear correlation (r 2 = 0.012). In this case, any inference about the exhumation rate from our AER is impossible. Assuming that the age pattern along the vertical profile was perturbed by a late-stage faulting event disrupting the AER at c. 500 m a.s.l., for samples at higher elevation we obtain an estimate of the exhumation rate of 158 m Ma–1 from the slope of the regression line through the data with a much better linear correlation (r 2 = 0.85; Fig. 3b). This value is not far from those found in other AERs in the Northern Apennines (Thomson et al. Reference Thomson, Brandon, Reiners, Zattin, Isaacson and Balestrieri2010) but, due to the reduced height of the profile (c. 400 m), this estimate has to be considered with caution. Due to the presence of the Ronta fault system (Fig. 2a) affecting the NE margin with throws of a few hundred metres (Coli et al. Reference Coli, Landuzzi, Sani, Vai and Bortolotti1992), the hypothesis of a normal fault disrupting our AER is likely.
AFT age–elevation relationships (AER) for the samples collected along the vertical profile in the Muccione catchment. (a) Regression line and 95% confidence level (a) through all samples and (b) excluding the two lower samples, hypothesizing a normal fault disrupting the AER at the level of the horizontal dotted line through the plot. Calculated values of the slope (approximation of the exhumation rate) are reported on the plots.

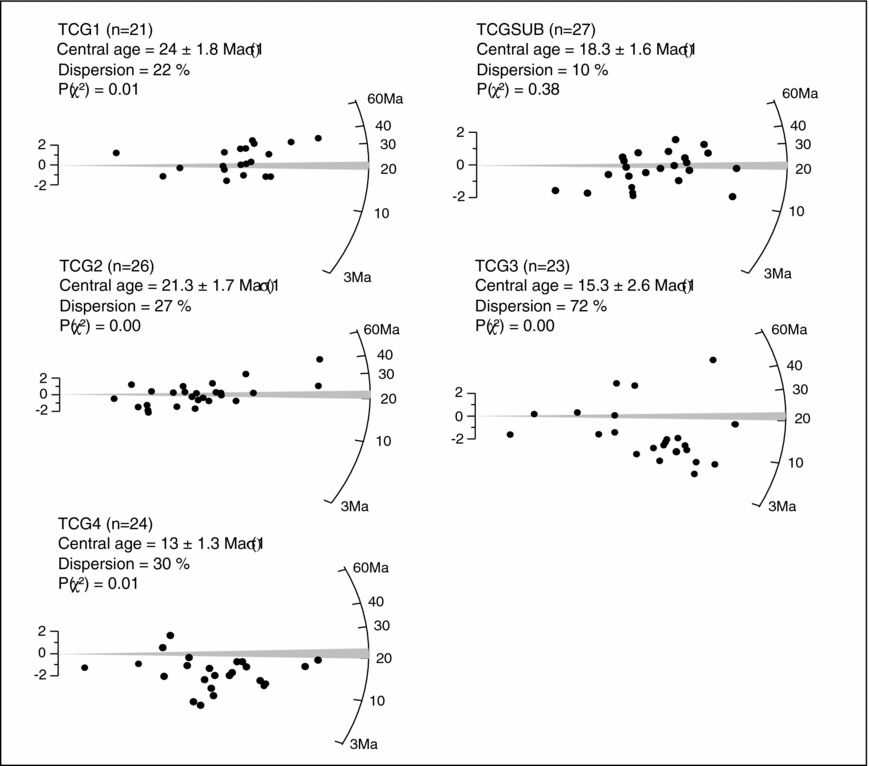
The TCGSUB-TCG2 samples, collected in the adjacent Pesciola catchment and representing the substratum directly overlain by the fan-delta sediments, yielded ages of 18.2 ± 1.8 Ma and 21.3 ± 1.9 Ma, respectively (Table 2). Dpar values are 2.1 µm and 2.3 µm, respectively. Surprisingly, these age values are much older in comparison with the age of the reset samples of the foredeep sediments in the inner side of the Northern Apennines (Thomson et al. Reference Thomson, Brandon, Reiners, Zattin, Isaacson and Balestrieri2010), and much older than the ages of the Torrente Carigiola in the northern part of the basin (Ventura, Pini & Zuffa, Reference Ventura, Pini and Zuffa2001). The mean values of the fission-track length distributions are reduced (12.1 ± 0.3 µm and 11.1 ± 0.9 µm; Table 2), revealing that these samples are only partially annealed. To verify this result, TCG1, 3 and 4 samples were collected to the north and to the south. These samples yielded ages varying between 24.2 ± 2.1 and 12.9 ± 1.3 Ma, together with reduced mean lengths between 12.1 ± 0.3 µm and 10.7 ± 0.5 µm and Dpar values between 2.1 µm and 2.3 µm (Table 2). Radial plots (Fig. 4) from these samples show that a large number of the grains have ages older than the late Chattian – Aquitanian stratigraphic age of the Torrente Carigiola Formation (Cibin et al. Reference Cibin, Di Giulio, Martelli, Catanzariti, Poccianti, Rosselli, Sani, Lomas and Joseph2004). ROM1–5 and TCGA samples have Dpar values (1.8–2.0 µm) lower than TCGSUB and TCG1–4 samples (2.1–2.3 µm); this difference may hint of a higher resistance to annealing (Donelick, O'Sullivan & Ketcham, Reference Donelick, O'Sullivan and Ketcham2005) of these last samples, even if the variation is not so substantial.
Radial plots of AFT data redrawn from RadialPlotter program (Vermeesch, Reference Vermeesch2009). Each single point represents a crystal; the single grain ages can be read on the intersection between a line linking the origin with a dot and the arc. Bars on the y axis indicate the standard error of each measurement. Shaded areas represent the stratigraphic age of the Torrente Carigiola Formation from Cibin et al. (Reference Cibin, Di Giulio, Martelli, Catanzariti, Poccianti, Rosselli, Sani, Lomas and Joseph2004).

In the study area, the Torrente Carigiola turbidite system therefore comprises two thermochronologically different portions: one reset (referred to here as reset TCG) and the other only partially annealed (non-reset TCG). If not due to different behaviours to annealing of the apatite grains, these findings have significant implications for the burial history and tectonic evolution of this portion of the Northern Apennines.
5.b. Detrital samples
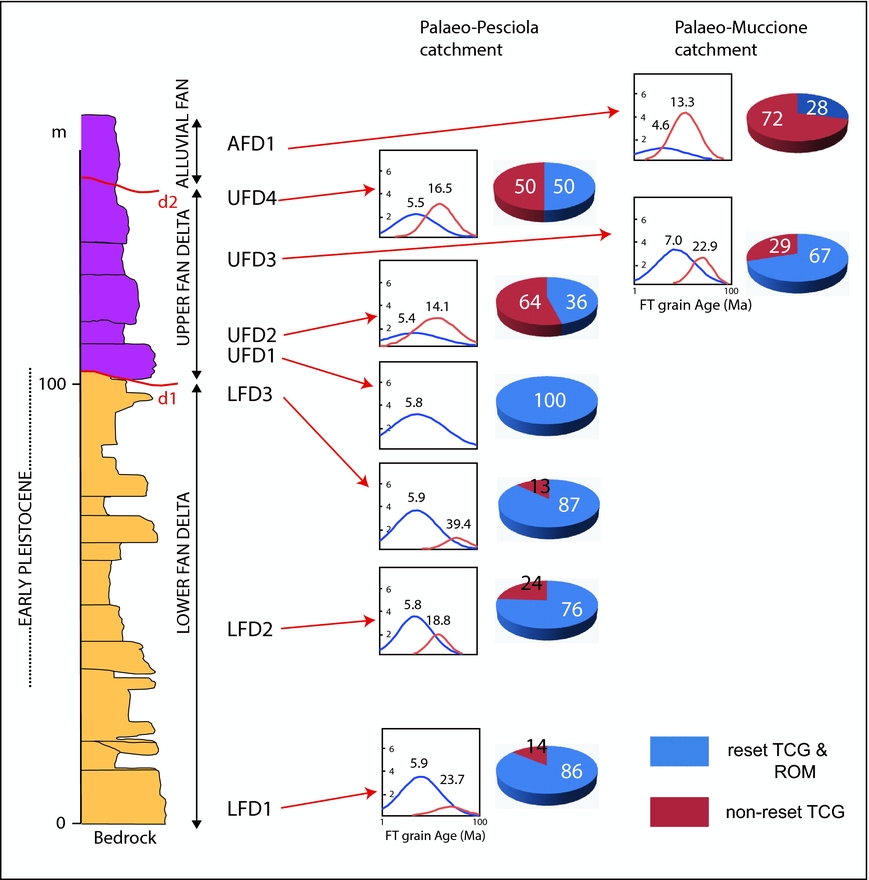
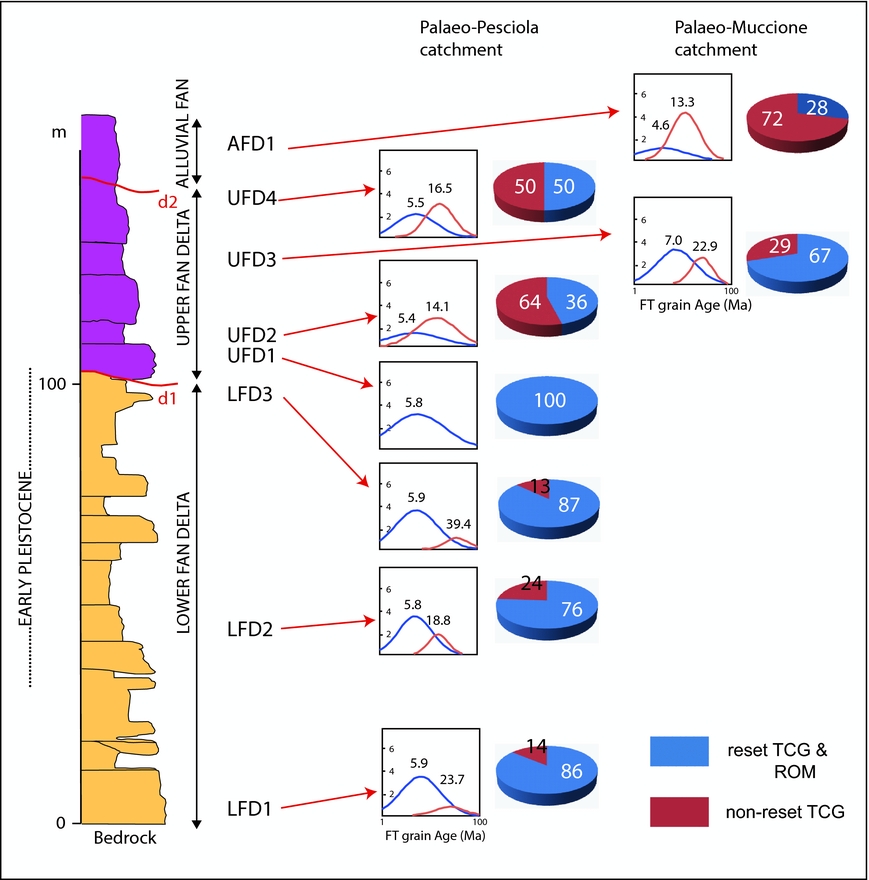
The AFT ages from the fluvio-lacustrine sediments vary between 11.5 ± 1.3 Ma and 5.8 ± 0.6 Ma (Table 2). Those grain-age distributions that failed the χ 2 test were decomposed into main grain-age components using the binomial peak-fit method (Galbraith & Green, Reference Galbraith and Green1990; Brandon, Reference Brandon1992, Reference Brandon1996) (Table 3). Two components were identified: a younger peak (P1) varying between 7.0 ± 1.0 Ma and 4.9 ± 1.3 Ma; and a P2 peak varying between 39.4 ± 7.2 and 13.3 ± 1.4 Ma (Table 3). By comparing the bedrock ages obtained in this study with those from the literature, and keeping in mind that the catchment areas of the two creeks feeding the sampled fans are the same all through the Quaternary and that no longitudinal sources are likely, it is plausible to attribute the P1 population indistinctly to the reset TCG and Romagna units and the P2 population to the newly recognized and non-reset TCG. Figure 5 shows the respective peak occurrence in percentage in the fan-delta sediments.
The stratigraphic section of the Mugello Basin NE sector fluvio-lacustrine succession is shown together with the stratigraphic position of the samples, diagram reporting density plots with age peaks expressed in Ma and pie diagrams representing the respective percentage of peak P1 and P2 in each sample.
6. Discussion
From the analytical results described above, two main points arise: (1) a previously undetected non-reset portion of the bedrock, shedding light on the pre-basin history; and (2) the source-to-sink relation and the Mugello Basin history.
6.a. The pre-basin thermo-tectonic structure of the NE margin
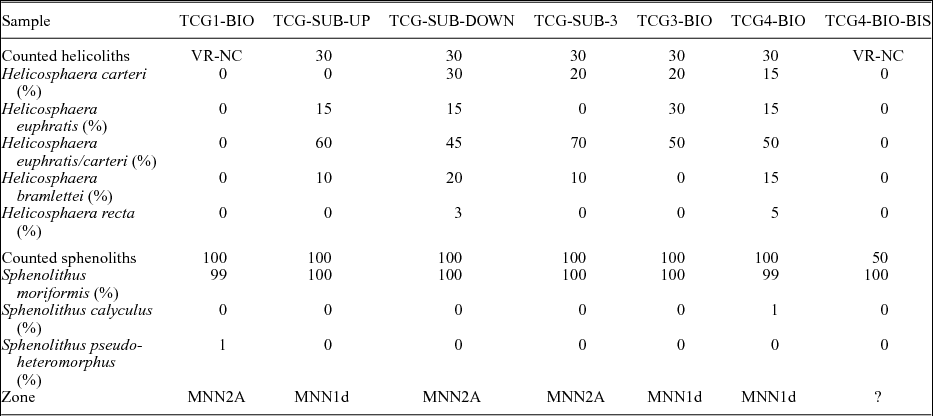
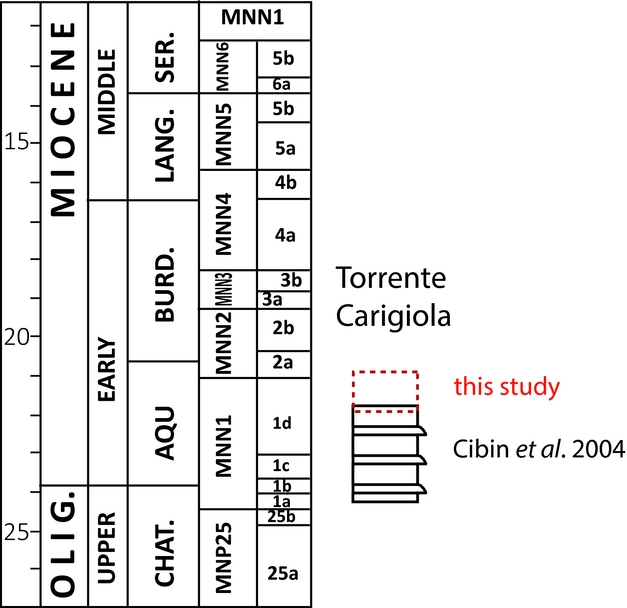
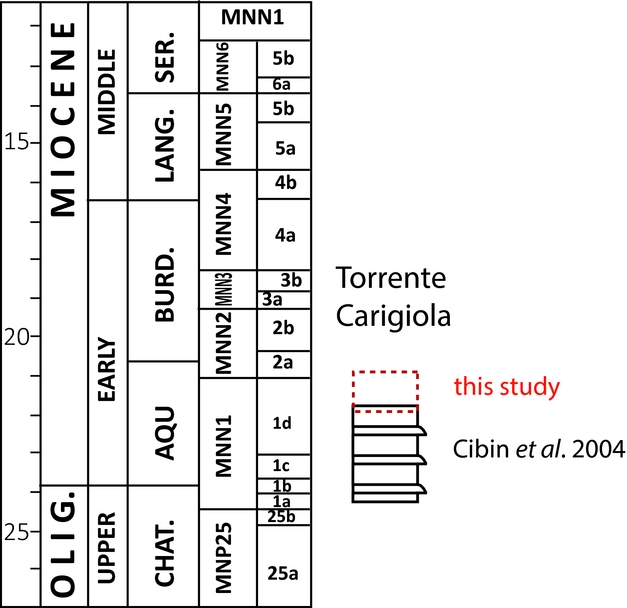
The surprising result from the bedrock AFT thermochronology is that a portion of the NE shoulder of the Mugello Basin is not reset. To verify that the sampled sandstones truly belong to the Torrente Carigiola Unit, a biostratigraphic analysis was performed on samples TCG1, TCGSUB/2 and TCG3–4 (Table 4). Following Cibin et al. (Reference Cibin, Di Giulio, Martelli, Catanzariti, Poccianti, Rosselli, Sani, Lomas and Joseph2004), the maximum duration of the Torrente Carigiola system spans late Chattian – Aquitanian time on the basis of the occurrence of the nannoplankton biozones MN1 and undifferentiated-MN1d (Cibin et al. Reference Cibin, Di Giulio, Martelli, Catanzariti, Poccianti, Rosselli, Sani, Lomas and Joseph2004) (Fig. 6). The nannofossil assemblage of our samples includes Helicosphaera carteri, which accounts for 15–30% and 30%, and Sphenolithus pseudoheteromorphus (Table 4), hinting at a time interval that spans the uppermost MNN1d Subzone to lowermost MNN2a Zone of Fornaciari & Rio (Reference Fornaciari and Rio1996). This suggests that the sampled strata referred to the Torrente Carigiola Formation represent an uppermost portion, and one which has not previously been biostratigraphically determined in the regional distribution of Torrente Carigiola Unit and possibly developed during latest Aquitanian – earliest Burdigalian time (Fig. 6). We used this (newly determined) age of deposition for thermal modelling of sample TCG1, for which sufficient track lengths could be measured (see Table 2).
Biostratigraphy of Torrente Carigiola non-reset samples (%).

Distribution of selected calcareous nannofossil taxa (helicoliths and sphenoliths) and biostratigraphy. Nannofossilbiozones according to Fornaciari & Rio (Reference Fornaciari and Rio1996).
Chronostratigraphy of Torrente Carigiola turbidite system according to nannoplankton biostratigraphy; from Cibin et al. (Reference Cibin, Di Giulio, Martelli, Catanzariti, Poccianti, Rosselli, Sani, Lomas and Joseph2004) and this study.
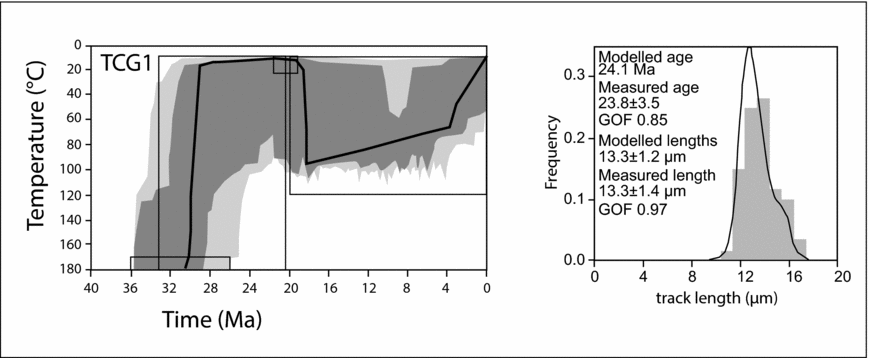
For the thermal modelling we used the HeFTy code by Ketcham (Reference Ketcham, Reiners and Ehlers2005) and Ketcham et al. (Reference Ketcham, Carter, Donelick, Barbarand and Hurford2007a, b). As provenance studies on the Northern Apennines foredeep sediments indicate that they were mostly fed from the rapidly uplifting central-westen Alps (Di Giulio, Reference Di Giulio1999; Dunkl, Di Giulio & Kuhlemann, Reference Dunkl, Di Giulio and Kuhlemann2001; Garzanti & Malusà, Reference Garzanti and Malusà2008; Anfinson et al. Reference Anfinson, Malusà, Ottria, Dafov and Stockli2016; Malusà et al. Reference Malusà, Anfinson, Dafov and Stockli2016), the first and pre-depositional constraint imposed on the thermal modelling is a rapid exhumation phase during Oligocene times. Thermal modelling (Fig. 7) revealed that, after deposition (small box at 22–20 Ma at surface temperatures), TCG1 was buried and entered the partial annealing zone, experiencing maximum temperatures of 80–100°C. Finally, it was exhumed during 5–3 Ma.
Thermal modelling performed with HeFty program (Ketcham, Reference Ketcham, Reiners and Ehlers2005) for TCG1 sample where a sufficient number (>50) of length measurements were measured. On the left, the dark grey region bounds the envelopes for statistically good fit, while the light grey region indicates the acceptable fit. The thick black line represents the best-fitting path. Boxes represent the constraints imposed on the thermal model. On the right the measured track-length distribution is shown as a histogram, while the calculated one for the most probable thermal history is shown as black lines. Fission-track lengths are normalized for track angle using c-axis projection (Ketcham et al. Reference Ketcham, Carter, Donelick, Barbarand and Hurford2007a, Reference Ketcham, Donelick, Balestrieri and Zattin2009) and the annealing model of Ketcham et al. (Reference Ketcham, Carter, Donelick, Barbarand and Hurford2007b).

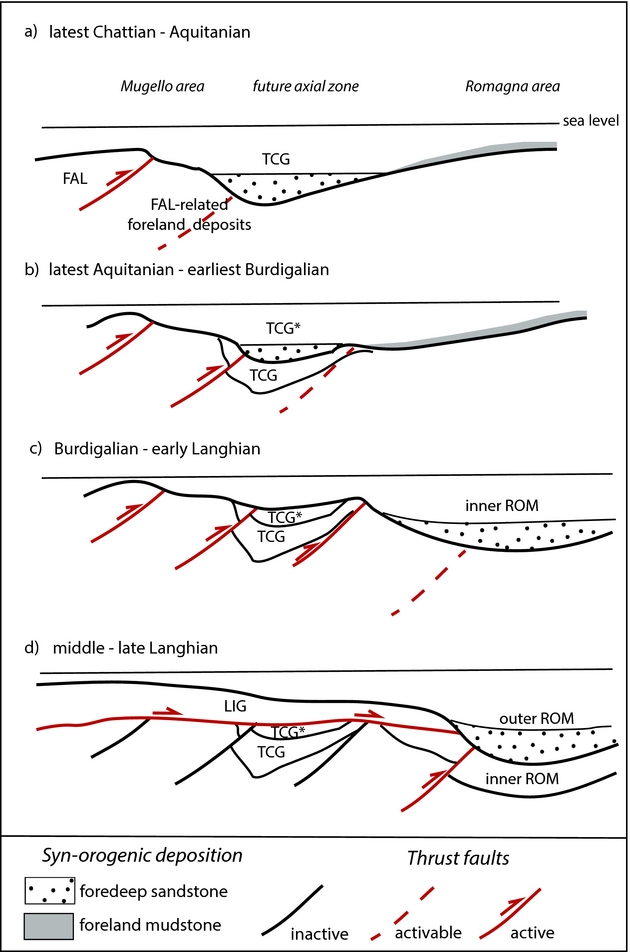
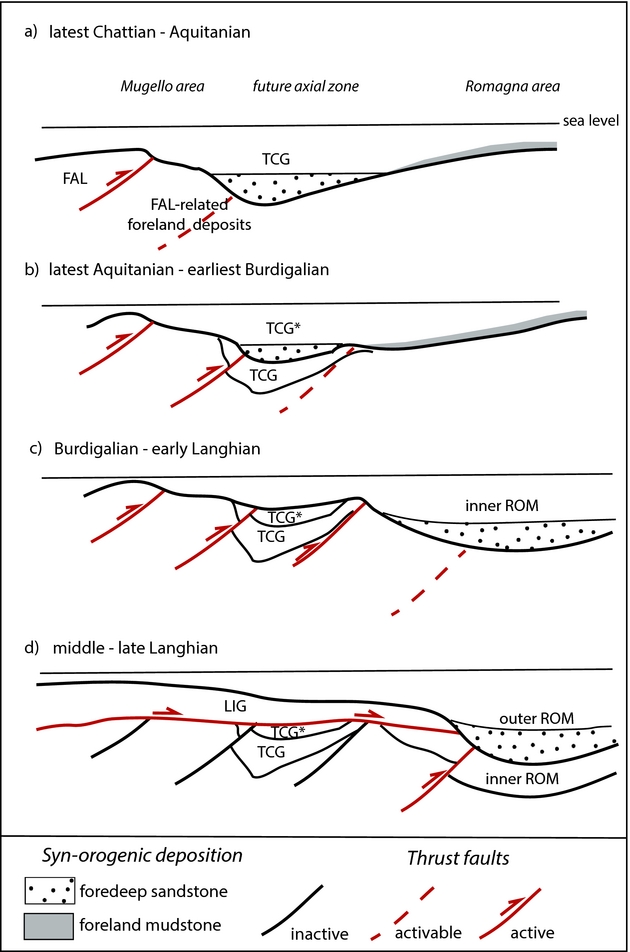
Sample TCG1 is not reset and this is confirmed by the ages of TCGSUB and 2–4 samples. This indicates a shallower burial of this portion of Torrente Carigiola (c. 3–4 km of overburden computed with a palaeo-geothermal gradient of 20°C km–1; Zattin, Picotti & Zuffa, Reference Zattin, Picotti and Zuffa2002) compared to that of the other reset Tuscan and Romagna units exposed in the area. We therefore hypothesize that in the study area presently belonging to the axial portion of the chain and different from what was determined at a more general scale (Zattin, Picotti & Zuffa, Reference Zattin, Picotti and Zuffa2002; Thomson et al. Reference Thomson, Brandon, Reiners, Zattin, Isaacson and Balestrieri2010), the thickness of the Ligurian lid was not sufficient to reset the underlying unit. We envisage two possible concomitant explanations for this peculiarity. (1) The Ligurian lid had a local minimum in the study area because it overrode a pre-existing topographic high, likely formed by a thrust top. This implies a thrust development in the area as early as during middle–late Langhian time. (2) A syn-Torrente Carigiola basin segmentation could also explain this peculiarity. Since the non-reset TCG overthrusting the Romagna units rests within the reset TCG (see sample TCGA), this is an indication that it was stratigraphically above the reset TCG. The biostratigraphic study of the non-reset TCG samples supports this reconstruction, ascribing the related strata to the uppermost portion of the TCG system. The non-reset TCG may represent the infill of a small depocentre, traced along-strike at least for about 4 km (samples TCG1–4) and developed during a syn-TCG foredeep deformation (Fig. 8a–d). This small depocentre remained at more surficial crustal level than the TCG, preventing a reset of the AFT ages. This ages the thrust activity in the area to the latest Aquitanian – earliest Burdigalian times. It is noteworthy that the whole Cervarola complex (sensu Di Giulio et al. Reference Di Giulio, Mancin, Martelli and Sani2013) is characterized by a segmentation of the foredeep basin. Non-reset TCG did not undergo later thermal modification during the thrusting over the Romagna units, which was instead tectonically loaded and reset similarly to the reset TCG.
Schematic evolution of the axial zone of the Northern Apennines during the development of the Torrente Carigiola turbidite system (TCG). TCG* – non-reset TCG; LIG – Ligurian lid; ROM – Romagna units. Active tectonic structures in red; inactive structures in black.
Interestingly, samples from the Romagna units beyond the present Tyrrhenian–Adriatic watershed and a few kilometres north of the study area (Fig. 1b; Zattin, Picotti & Zuffa, Reference Zattin, Picotti and Zuffa2002) are also not reset and similar in age to our TCG samples. The attenuated thermal imprint is explained (Zattin, Picotti & Zuffa, Reference Zattin, Picotti and Zuffa2002) in terms of a tectonic burial insufficient to reset the external Romagna units, in line with a southwards-tapering Ligurian wedge proposed by previous work (Malusà & Balestrieri, Reference Malusà and Balestrieri2012).
6.b. Syntectonic source-to-sink record during the fluvio-lacustrine phase as derived from detrital AFT thermochronology
The sampled fluvio-lacustrine deposits record the sediment flux from two adjacent catchments persisting on the NE shoulder of the Mugello Basin all through the Quaternary; the detrital AFT data therefore unravel the latest stages of uplift and denudation of the basin shoulder. This complex tectonostratigraphic edifice, formed during the Miocene propagation of the chain–foredeep system to the NE, underwent further deformation during (?)late Pliocene – early Pleistocene time. The palaeo-Pesciola record indicates the following sequence of unroofing of the bedrock pile.
(a) Decomposed AFT grain age distributions for LFD strata (LFD1–3, Fig. 5) consistently yield two peaks. A first peak (5.8 ± 0.7 Ma to 5.9 ± 0.8 Ma) attests to the dismantling of a reset arenaceous bedrock likely represented by a combination of TCG and ROM units (peak P1) plus a minor portion (13–24%) from the non-reset TCG source (peak P2). The ratio between the two sources hints at a dominant supply from the reset units (P1% >> P2%).
(b) Just above the major angular unconformity (d1) between LFD and UFD the non-reset TCG signature disappears (sample UFD1) and the sampled sediment is entirely sourced from reset bedrock, leading to a single age population (P1 at 5.8 Ma) (Fig. 5).
(c) The late development of the UFD (UFD2–4 samples) was characterized by detrital supply from a source dominated by the dismantling of the non-reset TCG (Fig. 5).
The palaeo-Muccione record is representative of the middle–upper portion of the UFD (sample UFD3) and of the alluvial fan on top of the fluvio-lacustrine succession (sample AF1). The two samples show an age composition with an increasingly larger portion sourced from non-reset TCG as in the Pesciola system.
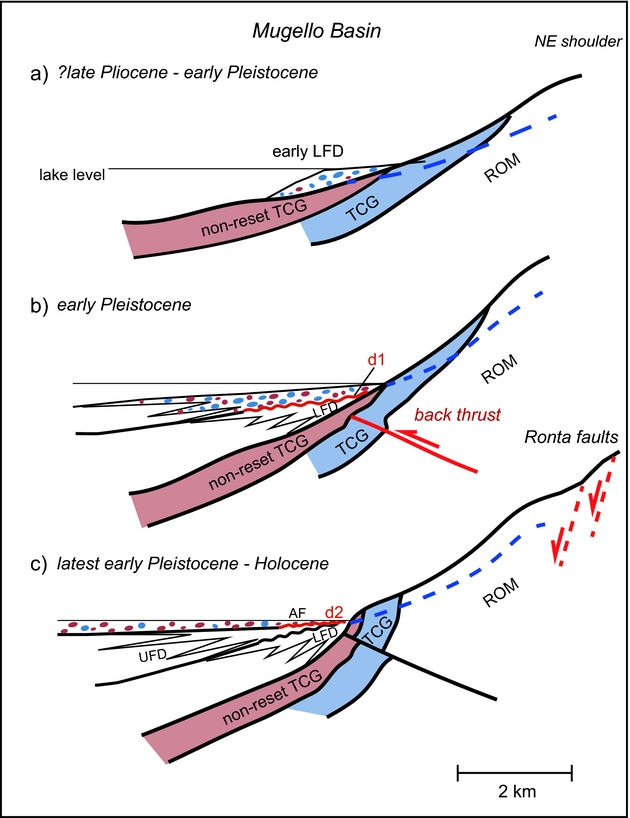
To explain this trend the following sequence of events can be reconstructed (Fig. 9a–c).
Major steps of the syndepositional uplift and rotation of the NE shoulder of the Mugello Basin in the study area, showing the progressive deformation recorded by the LFD, UFD and AF deposits as the result of a growing SW-verging backthrust (see text for details). Blue dots: sediments eroded from reset TCG and Romagna units; brown dots: sediments eroded from non-reset TCG; active tectonic structures in red; inactive structures in black. Bedrock eroded portion underlined by the dashed blue line.
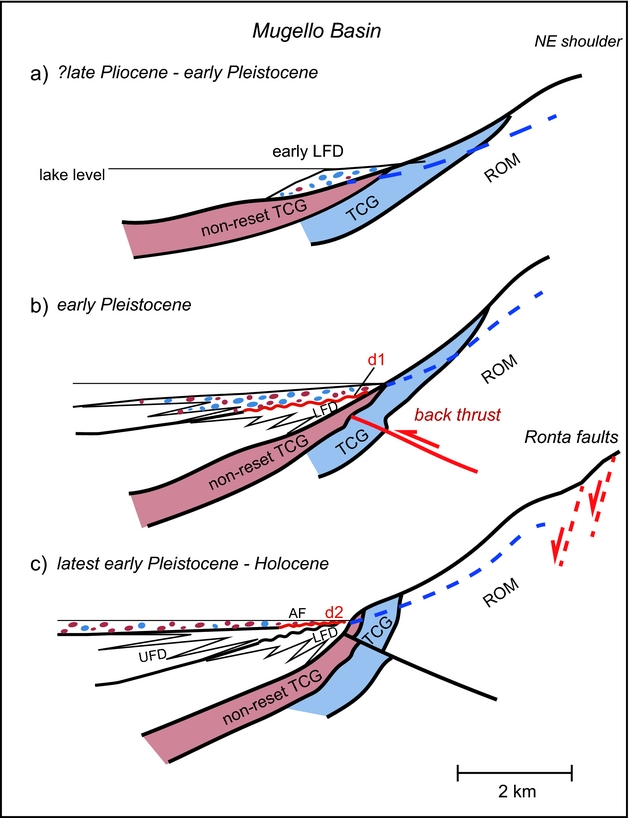
(a) At the onset of fluvio-lacustrine deposition during (?)late Pliocene – early Pliocene time, the structural stack of the bedrock units was characterized by the reset TCG and non-reset-TCG superimposed onto the ROM units through NE-verging thrusts. In such a configuration, the palaeo-catchments largely developed within the reset-TCG-Romagna units with only subordinate areas upon the non-reset-TCG. This may account for the AFT age pattern recorded in the LFD with a predominance of reset ages (Fig. 9a).
(b) A SW-vergent buried backthrust (Boccaletti et al. Reference Boccaletti, Bonini, Moratti, Sani, Cello, Deiana and Pierantoni1995; Benvenuti, Reference Benvenuti2003; Sani et al. Reference Sani, Bonini, Piccardi, Vannucci, Delle Donne, Benvenuti, Moratti, Corti, Montanari, Sedda and Tanini2009) deformed the NE-verging thrust stack and uplifted the reset TCG-Romagna units. This caused the progressive rotation of the LFD strata onlapping the shoulder, in a pattern characteristic of growth fold settings typical of compressive regimes (Riba, Reference Riba1976; Anadon et al. Reference Anadon, Cabrera, Columbo, Marzo, Riba, Allen and Homewood1986). A deformational acme is recorded by the d1 unconformity, which disrupts the continuous wedging of fan-delta strata. Erosion of uplifted reset TCG-Romagna units, re-equilibrating the fluvial profile, accounts for a dominant AFT signature of these units in the lowermost UFD deposits (UFD1).
(c) The non-reset TCG-dominant record of the late UFD and final alluvial-fan deposition in the two catchments attests to the re-emergence of this bedrock as a prevalent source rock in the late stage of the basin fill. This can be explained as the effect of the backthrust propagating towards the basin that created a new relief comprising non-reset-TCG and then eroded by fluvial readjustment.
The unroofing pattern recorded in the two palaeo-catchments is therefore consistent with a syndepositional deformation related to the activity of a SW-verging backthrust(s) that, during early Pleistocene time, may have determined the progressive uplift and rotation of the northern margin of the basin. Today, the exposure of the newly discovered non-reset-TCG represents less than the 15% of the catchment area of the Muccione and Pesciola creeks but, since early Pleistocene time, was capable of releasing a yield of apatite up to 75% of the total (Fig. 5; Table 3). If changes in apatite fertility are excluded (Malusà, Resentini & Garzanti, Reference Malusà, Resentini and Garzanti2016), this massive increase in the yield of the non-reset-TCG cannot be justified by an evolution of the NE basin margin under an extensional regime which triggered the activity of the Ronta fault system; this scenario, responsible for the formation of a stair-step morphology along the basin flank, would imply an increasing input from the reset Marnoso Arenacea.
7. Conclusions
Detrital AFT analysis of lacustrine fan-delta deposits from two palaeo-catchments resting on the NE shoulder of the Quaternary intermontane Mugello Basin has been revealed to be a suitable tool for unravelling the dynamics of the uplift and denudation of basin shoulder. Detrital AFT age signatures have been compared with those of the source rocks through the analysis of bedrock samples collected along the exposed structural stack in the two palaeo-catchments. Bedrock has an AFT age pattern composed of reset and non-reset bedrock units, whereas the thermochronological dataset available for this axial portion of the Northern Apennines chain shows only reset ages recording the final exhumation of the whole late Oligocene–Miocene foredeep complex at 7–5 Ma. In particular, samples collected in the litho- and chrono-stratigraphically equivalent TCG unit yielded both reset ages of c. 6 Ma and reset ages of 24–12 Ma. This pattern may be explained by the development of a limited depocentre during a syndepositional deformation (latest Aquitanian – earliest Burdigalian) of the TCG basin. This resulted in the relatively higher stratigraphic position of non-reset TCG with respect to reset TCG, in turn thrusted onto the Romagna unit, when the advancing Ligurian lid tectonically loaded this area during Langhian time. Thrust activity, creating topography with alternating highs and depressions, occurred in the area as early as latest Aquitanian – earliest Burdigalian time.
On the other hand, detrital data confirm and better time-constrain the picture of a shortening stage in the formation and early development of the Quaternary Mugello Basin.
At a regional scale, this represents a further step in proving that the tectonic evolution of the Northern Apennines outermost intermontane basins may be framed in a two-phase history with a basin initiation under a compressional regime and a later (middle Pleistocene to present) normal faulting event, as proposed in some of the previous stratigraphic and structural studies (Sani et al. Reference Sani, Bonini, Piccardi, Vannucci, Delle Donne, Benvenuti, Moratti, Corti, Montanari, Sedda and Tanini2009) and by ourselves for the older and more internal Valdelsa basin (Balestrieri, Benvenuti & Tangocci, Reference Balestrieri, Benvenuti and Tangocci2013).
At a more general scale, our study reveals the capability of the detrital studies to time-constrain the activity of tectonic structures and to differentiate between different styles of deformation affecting basin margins.
Acknowledgements
We warmly thank Francesca Tangocci for her help in sample preparation and analysis. Bianca Heberer and Marco Malusà are also thanked for their careful review and useful suggestions that greatly improved the quality of this paper. This study was funded by CNR within the framework of the ESF's Eurocores Programme ‘Thermo-Europe’.