INTRODUCTION
The classical principles underlying the design of agricultural field experiments are replication, randomized allocation of treatments to experimental units (plots) and blocking (Fisher Reference Fisher1935). In the case of one-dimensional spatial trends, designs with complete or incomplete blocks are common, depending on the soil characteristics and the number of treatments tested. The use of incomplete blocks is preferable to complete blocks, when this allows a better control of the experimental error, leading to more precise and accurate treatment effect estimates as well as to a gain in statistical power. It is well known that there is usually a correlation of measurements taken on spatially adjacent plots, the correlation decaying with spatial distance among plots (Richter & Kroschewski Reference Richter and Kroschewski2012). Proper randomization ensures, however, that regardless of any such spatial patterns classical analysis procedures for designs with complete or incomplete blocks may proceed, assuming independent residual effects (Yates Reference Yates1939; Grondona & Cressie Reference Grondona and Cressie1991; Zimmerman & Harville Reference Zimmerman and Harville1991). The model with uncorrelated residual effects will henceforth be referred to as the baseline model. To refer to the baseline model, the abbreviation B-RCB is used for complete blocks and B-IB for incomplete blocks. Many authors have reported on studies showing that inclusion of spatial correlations between plots as an add-on component to a baseline model provides efficiency gains (Grondona & Cressie Reference Grondona and Cressie1991; Zimmerman & Harville Reference Zimmerman and Harville1991; Brownie et al. Reference Brownie, Bowman and Burton1993; Gilmour et al. Reference Gilmour, Cullis and Verbyla1997; Wu et al. Reference Wu, Mather and Dutilleul1998; Wu & Dutilleul Reference Wu and Dutilleul1999; Stroup Reference Stroup2002; Pilarczyk Reference Pilarczyk2009; Müller et al. Reference Müller, Kleinknecht, Möhring and Piepho2010; Richter & Kroschewski Reference Richter and Kroschewski2012).
Both the baseline model and the extended model with spatial add-on components can be written in general form as the following mixed linear model:
 $${\bi y}{\rm =} {\bi X\beta} + {\bi Zu} + {\bi e}$$
where β is p×1 vector of fixed effects, u is q×1 vector of random effects, e is n×1 vector of residual effects and X and Z are the known design matrices for fixed and random effects, respectively. The following assumptions are made on random effects: u ~N(0, G ), e ~N(0, R ) and Cov( u,e )=0, so that Var( y )= ZGZ′ +R=V.
For the baseline model the matrix R takes the form R =σ 2 I , where I denotes the identity matrix. For the spatial models considered in the present paper, the covariances in R depend on spatial distances among plots. In the present paper, it is assumed, moreover, that spatial correlation does not depend on the direction (isotropy). Observations from two plots with Euclidean distance d>0 (measured between plot centres) have covariance Cov(d)=σ 2 f(d). The spatial covariance models considered here differ only in the form of the function f(d).
The use of spatial models entails two problems:
-
(i) When analysing a trial, the true underlying covariance model is unknown. Thus, a well-fitting model needs to be selected from a set of candidate models using a suitable selection criterion.
-
(ii) To obtain valid tests for treatment comparisons, a modification of classical test procedures is required. The following modifications are in common usage: the Satterthwaite method (henceforth abbreviated as SW; Satterthwaite Reference Satterthwaite1941; Giesbrecht & Burns Reference Giesbrecht and Burns1985; Fai & Cornelius Reference Fai and Cornelius1996), the Kenward–Roger method (KR; Kenward & Roger Reference Kenward and Roger1997), and the first-order Kenward–Roger method (KR1; described by Kenward & Roger Reference Kenward and Roger2009; referred to as the Prasad–Rao estimator in Harville & Jeske (Reference Harville and Jeske1992)). In addition, Kenward & Roger (Reference Kenward and Roger2009) described a second-order method, henceforth denoted as KR2.
In the present investigation, the properties of Wald-type F-tests will be analysed under the global null hypothesis of no treatment effects and of Wald-type t-tests for pairwise comparisons.
The global null hypothesis H0: L'β=0 with L' a matrix of contrasts can be tested by
 $${\bi F} = \displaystyle{{({\bi L'}{\bi \hat \beta} )'({\bi L'}{\bf (}{\bi X'}{\bi \hat V}^{ - {\bf 1}} {\bi X} {\bf )}^ - {\bi L}{\bf )}^{ - 1} {\bi L'}{\bi\hat \beta}} \over {{\rm rank}{\bi (L)}}}$$
where
 $ \bi{\hat V}$
is the restricted maximum-likelihood (REML) estimate of
V
. When
L' is a single contrast vector, one may also use
 $${\bi t} = \displaystyle{{\bi L}^{\prime}\, \hat{\bi \beta} \over \sqrt{{\bi L}^{\prime}(X^{\prime} \hat{V}^{-1} X)^{-} L}}$$
For a single pairwise contrast, L' is a row vector with zeros everywhere, except for the two treatments being compared, which have coefficients –1 and +1. For testing the global null hypothesis that all t treatments have equal mean, L′ will have t–1 linearly independent rows with pairwise contrasts. In general, the following problems occur with these tests (Kenward & Roger Reference Kenward and Roger1997, Reference Kenward and Roger2009; Schabenberger & Pierce Reference Schabenberger and Pierce2002):
-
•
 ${\bf (}{\bi X'\hat V}^{ - {\bf 1}} {\bi X}{\bf )}^ - $
is not generally an unbiased estimator of
${\bf (}{\bi X'V}^{ - {\bf 1}} {\bi X}{\bf )}^ - $
;
-
•
${\bf (}{\bi X'\hat V}^{ - {\bf 1}} {\bi X}{\bf )}^ - $
underestimates the variance of
$\hat{\bi \beta}$
, because the variance of the estimator of
V
is not taken into account; and -
• Test statistics in Eqns (2) and (3) follow an exact F-distribution and an exact t-distribution only in exceptional cases; in the majority of cases the denominator degrees of freedom need to be suitably approximated.


The SW method operates on
 ${\bf (}{\bi X'\hat V}^{ - {\bf 1}} {\bi X}{\bf )}^ - $
where
 ${\bi \hat V}$
is the REML estimate of
V
. It approximates the denominator degrees of freedom in Eqns (2) or (3) using the method of moments. The KR, KR1 and KR2 methods correct, in slightly different ways, the plug-in estimator of
 ${\bf (}{\bi X'V}^{ - {\bf 1}} {\bi X}{\bf )}^ - $
and then use the corrected estimator to approximate the denominator degrees of freedom.
Problems (i) and (ii) arise frequently in experiments with repeated measures in time or space (Piepho et al. Reference Piepho, Büchse and Richter2004). Problem (ii) also occurs with experiments, in which a more complex covariance structure results from the randomization. For example, in split-plot and strip-plot designs, where treatment contrasts involve several variance components, it may be necessary to approximate the error degrees of freedom, particularly when missing data occur (Fai & Cornelius Reference Fai and Cornelius1996; Spilke et al. Reference Spilke, Piepho and Hu2005). Studies by Kenward & Roger (Reference Kenward and Roger1997, Reference Kenward and Roger2009), Gomez et al. (Reference Gomez, Schaalje and Fellingham2005) and Schaalje et al. (Reference Schaalje, McBride and Fellingham2002) demonstrate that the validity of tests depends on the method chosen, the underlying covariance model and its parameter values, the parameterization of the model and the sample size. When using a spatial add-on component in the analysis of field trials, however, the data structures are not directly comparable, so that results of these studies do not apply. In field trials, the option to fit a spatial correlation structure does not follow from the randomization theory, but it is justified by the commonly observed similarity of adjacent plots across the whole trial field or parts thereof, e.g. within blocks, due to biotic and abiotic effects.
So far, little has been published on the control of the Type I error and the power of the t- and F-tests using the modifications in (ii) for spatial covariance structures in the context of field trials. For the spherical and exponential models with different parameter values and two trial designs with complete blocks, Hu et al. (Reference Hu, Spilke and Richter2006) showed by simulation that the SW method generally yields more valid test results than the KR method. In particular, when no nugget was present, bias in estimates of standard errors of a difference (s.e.d.) obtained by the KR method was substantial. Spilke et al. (Reference Spilke, Richter and Piepho2010) simulated split-plot designs assuming an exponential covariance model with nugget effect and/or large-scale trend effects. Here, the KR1 method outperformed the SW method. In contrast to Hu et al. (Reference Hu, Spilke and Richter2006), Spilke et al. (Reference Spilke, Richter and Piepho2010) combined each simulated random field with a newly randomized design, so that the results refer to an average over all randomizations. The comparison of the corrected Akaike information criterion (AICC; Hurvich & Tsai Reference Hurvich and Tsai1989) and the Bayesian information criterion (BIC, Schwarz Reference Schwarz1978) as a selection criterion did not lead to a clear preference of one criterion over the other. Using AICC, Richter & Kroschewski (Reference Richter and Kroschewski2012) showed in simulated experiments with four and ten treatments projected onto uniformity trial data, that trial geometry, position of the trial area and the randomization layout influence the outcome of model selection. Properties of t- and F-tests were analysed for several analysis models and models best-fitting according to AICC, and using the SW or KR1 methods. As the true underlying covariance model in the uniformity trials was not known, the causes of the observed biases in s.e.d. and the partial lack of Type I error control remained elusive.
The present paper reports results on an experiment with sugar beet that illustrates the pros and cons of using spatial add-on components in the analysis and shows that the various modifications may yield contrasting results, leaving the user with the problem of identifying the best method. For this purpose, simulations are required. Therefore, in the present paper, problems (i) and (ii) were investigated by simulation for experiments with 10 or 30 treatments for typical dimensions of plots and complete and incomplete blocks. The analyses only considered models without nugget effect, because according to simulations by Hu et al. (Reference Hu, Spilke and Richter2006) models without nugget may be problematic in terms of bias. Moreover, several authors reported that inclusion of a nugget is often not necessary for field trials (Besag & Kempton Reference Besag and Kempton1986; Zimmerman & Harville Reference Zimmerman and Harville1991; Schabenberger & Pierce Reference Schabenberger and Pierce2002; Richter & Kroschewski Reference Richter and Kroschewski2012). But other authors reported analyses where addition of a nugget led to a better model fit (Piepho & Williams Reference Piepho and Williams2010), suggesting that the need of a nugget effect is data-dependent and possibly dependent on the spatial covariance model. Expanding on previous results in other publications, the current analyses focused on the following issues:
-
• Assessment of bias of s.e.d. estimates and empirical Type I error rate at a nominal significance level of α=0·05 for t- and F-tests using the SW-, KR- and KR1 methods and considering all combinations of simulation and analysis model.
-
• Performance of t- and F-tests for the best-fitting models and discussion in relation to the chosen model selection criterion.
-
• Power analysis assuming spatial models in comparison with models for designs with complete and incomplete blocks. The latter comparison is of particular interest, because with these designs the model selection problem does not arise, unless spatial model components are used.
Results on the KR2 method are also reported briefly. More detailed results are presented in the Supplemental Material (available at: http://journals.cambridge.org/AGS).
EXAMPLE
A three-factorial sugar beet experiment was conducted to assess the effects of variety (varieties 1–3), N-fertilization (0, 80 and 120 kg N/ha) and a growth enhancer (with and without) on corrected sugar yield (t/ha). The experiment was laid out in four randomized complete blocks. The plot size was 3×8 m2. Only the three central crop rows were harvested. The field layout was a grid of four rows and 18 columns with rows corresponding to blocks. This experiment was analysed using the MIXED and GLIMMIX procedures of the SAS System (Version 9.3 /SAS/STAT 12.1). The following models were fitted (all with fixed block effects): baseline model B-RCB and 12 spatial models (isotropic and anisotropic models, with and without nugget effect, with spatial correlations either confined within blocks or extending across the whole experiment) using the default starting values for the variance parameters. For three models, numerical problems occurred, because the iterative fitting algorithm did not converge. The best-fitting model was the power model without nugget effect and correlation extending across the whole experiment (henceforth referred to as PM; Fig. 1) with estimated parameters
 $\hat \sigma ^2 = 0 {\cdot} 5342$
and
 $\hat \rho = {\rm 0} {\cdot} {\rm 7956}$
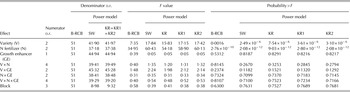
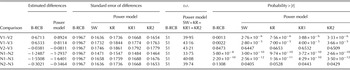
. The AICC-value was 133·8, whereas that for B-RCB was 139·9. A likelihood-ratio test (LRT) further indicated a significantly better fit of the power model (P<0·01). The power model was analysed with the four approximation methods SW, KR, KR1 and KR2. In the example, the approximated degrees of freedom of KR, KR1 and KR2 were identical and different from SW for F-tests. For the t-tests, there were no differences in the degrees of freedom between methods (Tables 1 and 2). For all main effects and the interactions, an F-test was performed. A t-test was only done for varieties and fertilizer levels, because the growth enhancer showed no effects and all interactions were non-significant. The improved fit of the power model compared with the baseline model meant that the P-values of F- and t-tests (Tables 1 and 2) for several effects were reduced. There are notable differences between the four methods, so the user is left with the problem of choice. This is particularly true for the comparison of the second and third N-fertilizer levels (N2 and N3), where the p-value was either below or above the nominal significance level of 0·05. Whether the use of spatial models for analysis can be recommended and if so, which method of approximation is preferable depends on the degree of control of the nominal significance level (often set at 0·05; the same practice is followed in the present paper). Assuming a satisfactory control of the Type I error rate, a smaller P-value would correspond to a higher power for a given comparison. Whether or not this is the case cannot be decided based on a single experiment, but requires extensive simulation.
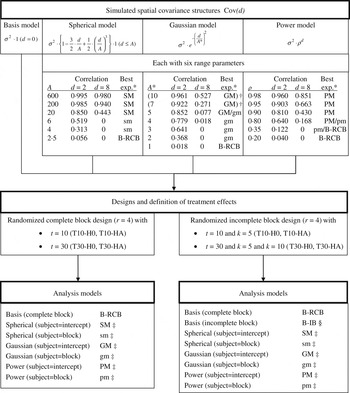
Overview of simulation models and analysis models. r=number of replicates, t=number of treatments, k=number of treatments per incomplete block. T10-H0, T10-HA, T30-H0, T30-HA definition of treatment effects (see text). * Expected best-fitted analysis model. †A +=10 for 10 treatments; A +=7 for 30 treatments. ‡Analysed with SW, KR, KR1 and KR2. §Analysed with SW and KR=KR1=KR2.

Results of the analysis of the sugar beet trial. F-tests for the analysis corresponding to B-RCB and the best-fitting model (PM) with four correction methods

Results of the analysis of the sugar beet trial. t-tests for three varieties (V1, V2, V3) and three N fertilizer levels (N1, N2, N3) corresponding to B-RCB and the best-fitting model (PM) with four correction methods

SIMULATIONS
All simulations and analyses were performed with SAS (Version 9.3/STAT 12.1). A complete overview on the simulation and analysis models including the used abbreviations is given in Fig. 1. Designs that are commonly used in field trials were assumed, i.e. trials with t=10 and 30 treatments with r=4 replicates. The plot size was 2×8 m2. Plots of a complete replicate were located side-by-side in the same row of plots. Replicates were arranged in separate rows, so that the trial size was 20×32 m2 or 60×32 m2.
For the whole trial area, 10 000 random fields were simulated according to the baseline model and three spatial models – spherical, Gaussian and power – assuming a residual variance of σ 2=200 throughout. For each of the spatial models, six different values were considered for the range parameters (Fig. 1), spanning a wide range of correlation structures. For the Gaussian model and designs with 10 or 30 treatments, different maximum values of the range parameter (A +=10 and A +=7, respectively) were selected, because for larger values and given dimensions of the field and blocks the variance–covariance matrix R to be used for simulating the data either became non-positive definite or the parameter estimation was associated with substantial convergence problems.
The power model is equivalent to the exponential model Cov(d)=σ 2exp(–d/A +) with A +=–1/log(ρ), when 0<ρ<1. Better convergence properties were observed with the power model and so this was preferred in simulations.
The following trial designs were projected onto 10 000 simulated fields each:
-
• Designs with randomized complete blocks for t=10 and 30, each of which was randomized 10 000 times.
-
• Resolvable incomplete block designs, generated using CycDesigN 4·1 (Whitaker et al. Reference Whitaker, Williams and John2009) and randomized 10 000 times. For t=10, an incomplete block design with k=five plots per block and an average efficiency factor of E=0·866 was generated; for t=30 a design with k=5 (E=0·805) and a design with k=10 (E=0·915) was constructed.
Every randomized plan was combined with a random field, yielding 10 000 simulated trials.
In all simulations, effects for the four complete replicates were set to 8, 24, 40 and 56. For the treatment effects, four variations to the simulation scheme were considered, corresponding to the following objectives:
-
• (T10-H0) for t=10: all 45 treatment differences were zero to analyse bias of s.e.d. estimates and control of the nominal Type I error rate of t- and F-tests;
-
• (T10-HA) for t=10: three treatment effects were zero and the others were 1·2, …, 8·4 (1·2), so that treatment differences were staggered according to Δ=0, 1·2, …, 8·4 (1·2) for analysis of power;
-
• (T30-H0) for t=30: all 435 treatment differences were zero with the same analysis aim as for (T10-H0);
-
• (T30-HA) for t=30: with the chosen treatment effects (7 times 0, 2 times 1·2, 2·4, 3·6 and 4·8, 3 times 6·0, 5 times 7·2 and 7 times 8·4), so that 59 treatment differences were equal to zero and 376 differences were staggered according to Δ=1·2, …, 8·4 (1·2) for assessments analogous to (T10-HA).
Each simulated trial with complete blocks was analysed using a linear model with fixed effects for treatment and replicate and random residual effects following the baseline model as well as the Gaussian, power and spherical models. For spatial models, two alternatives were considered: correlation expanded across the whole field (option subject=intercept in SAS, yielding a single subject) or only across plots in the same block (option subject=block, yielding r=four subjects). Each of these analyses was done by the SW, KR, KR1 and KR2 methods. Simulated trials with incomplete blocks were analysed with the same models. In addition, these data were analysed using a model with fixed replicate and treatment effects and a random effect for incomplete blocks (Fig. 1, analysis model B-IB). This approach implied that observations of the same block had a constant covariance not depending on spatial distance, while observations from different blocks were independent. In this case, the covariance structure was intrinsically linear (Kenward & Roger Reference Kenward and Roger2009), so that the KR, KR1 and KR2 methods yielded the same results. Analyses with the SW, KR and KR1 methods were performed using the MIXED procedure of the SAS System, employing the REML-method without provision of starting values or bounds for the variance parameters. These three methods were also implemented in the GLIMMIX procedure. The KR2 method was only implemented in the GLIMMIX procedure. GLIMMIX and MIXED employ different fitting algorithms (GLIMMIX uses a quasi-Newton algorithm and MIXED a ridge-stabilized Newton–Raphson algorithm) and convergence criteria. The different algorithms often yield identical results (for example in the sugar beet experiment), but in some cases convergence properties and results may differ. For a given approximation method, neither a variation of convergence criteria nor the selection of different fitting algorithms led to identical results for both procedures in all simulation runs. The main focus of the present paper will be on the results obtained with MIXED, because this procedure yielded slightly better results in terms of bias of s.e.d. estimates and the control of the nominal Type I error rate for t-tests (checked for KR1). The direct comparison of the KR2 and KR1 methods, controlling for the optimization methods, was only possible in GLIMMIX, which implements both methods. The results of that comparison are reported here only briefly. More details can be found in the Supplemental Material (available at: http://journals.cambridge.org/AGS).
For each simulated trial, the best-fitting model was selected by AICC because Burnham & Anderson (Reference Burnham and Anderson1998) recommended this criterion for trials with a ratio between sample size and number of variance parameters smaller than 40. For a larger ratio, the AICC approaches the usual Akaike information criterion (AIC; Akaike Reference Akaike, Petrov and Caski1973). If the best-fitting model was a spatial model, it was subsequently compared to B-RCB by a LRT. When the best spatial model was not significantly better than B-RCB according to a LRT, the B-RCB model was selected as the best model. Similarly, the B-RCB model was selected when no spatial model converged. When several spatial models had the same smallest AICC and were significantly better than the baseline model by a LRT, then the simulation model was virtually always among the tied best models. In these cases, the simulation model was declared as the best one. This approach was modified only in case of a simulated power model and a tied first rank for the power and spherical models. Here, the spherical model was selected as the best model, because the power model frequently caused numerical problems in the subsequent significance tests (for details see the Results section). Thus, for every simulated experiment there was a selected best analysis model that is independent of the approximation method and hence of the resulting parameter estimates and significance tests. The number of times out of 10 000 runs an analysis model was selected as the best one for a given simulation model under T10-H0 and T30-H0 was determined.
Depending on the combination of simulation and analysis model as well as on the approximation method, there was a varying number of simulation runs with convergence problems, which were excluded from final summaries. In addition, simulation runs meeting at least one of the following conditions were excluded: (i) The F-value for the global null hypothesis tended to infinity, corresponding to a numerically exact P-value of zero; (ii) for at least one treatment comparison, the t-value was reported as plus or minus infinity, meaning the s.e.d. was reported as an exact zero; (iii) in the analysis according to PM or pm, the estimate of ρ was close to
 $\pm 1 ( 1 - \left| {\hat \rho} \right| \lt 10^{ - 4} $
); and (iv) the P-value of the F-test was nearly 1 (1–P<5×10⁻⁸). In most of the excluded cases, more than one of these conditions was met. The exclusion of these cases meant that the assessment of bias of s.e.d. estimates as well as of the empirical Type I error rates were based on 10 000 simulation runs or less. The total number of runs among the 10 000 that were used for final assessment will be referred to as effective number of runs.
The bias of s.e.d. estimates was assessed according to
 $${\rm bias}\,{\rm of}\,{\rm s}.{\rm e}.{\rm d}.\,(\% ) = (\overline {\rm S.E.D}. _{{\rm est}} - \overline {\rm S.E.D}. _{{\rm obs}} )/\overline {\rm S.E.D}. _{{\rm obs}} \times {\rm 1}00$$
where
 $\overline {{\rm S}{\rm. E}{\rm. D}{\rm.}} _{{\rm obs}} $
is the square root of the mean variance of all estimated treatment differences and
 $\overline {{\rm S}{\rm. E}{\rm. D}}. _{{\rm est}} $
the square root of the mean-estimated variances of the treatment differences, in both cases averaged over all effective number of runs and all treatment comparisons.
In addition, for every simulation model the bias of the s.e.d. and the empirical Type I error rate for the best-fitting model were assessed. Again, the effective number of runs was 10 000 or less.
For the t-test, the power analyses were conducted under T10-HA and T30-HA, but are meaningful only if the simulations under the corresponding null hypothesis yielded control of the nominal Type I error rate according to a binomial test. Thus, when the empirical rejection rate was contained in the interval
 $\left\langle {0 {\cdot} 05 \pm 1 {\cdot} 96 \times \sqrt {\displaystyle{{0 {\cdot} 05 \times (1 - 0 {\cdot} 05)} \over {{\rm effective \ number \ of \ runs}}}}} \right\rangle $
, the control was considered to be satisfactory.
RESULTS
For trials laid out in complete or incomplete blocks, analysis according to B-RCB or by spatial models yielded similar results. Therefore, only results for complete blocks are reported here in detail, while for incomplete blocks only results for the B-IB model are reported. The following results were obtained with the MIXED procedure.
Agreement between simulation model and best-fitting model
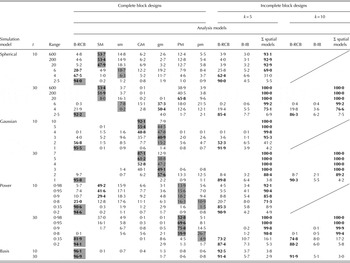
A model selection strategy is successful if the true (simulated) model is correctly identified. Relative merits of models with correlation extending across the whole field and models with correlations restricted within blocks were expected to depend on the underlying range parameter and thus on the strength of correlation. In particular, a transition to the baseline model was expected for weak correlations for d=2 (Fig. 1). Table 3 shows the relative frequency of selected models based on simulations for T10-H0 and T30-H0 for trials with complete blocks. For simulations under T10-HA and T30-HA, the results were essentially identical (the maximum deviation compared to Table 3 was 1·5%). Results for trials with incomplete blocks are included in aggregated form.
Best-fitting models according to AICC and LRT (%) in 10 000 runs of each simulation model. Bold faced=largest observed percentage, grey=largest expected percentage according to Fig. 1. Empty cells represent a percentage of 0%

For the Gaussian model the agreement between simulated and best-fitting model for t=10 and t=30 was good. When the true model was the power model, then with t=10 models SM and sm were preferentially selected, whereas for t=30 the PM and pm models were selected more often. For the spherical model with t=10 and A⩾20, the frequency of correct selections was modest. When the range parameter was smaller, the model B-RCB was most frequently selected. With t=30, correct selection occurred only when A⩾200, while for a smaller range models PM and gm and for A⩽2·5 B-RCB were preferred in model selection. All results agree in that with decreasing covariance there was an increasing tendency to favour the baseline model B-RCB. The baseline model itself was correctly selected in 96% (t=10) and 97% (t=30) of the cases. Overall, the Gaussian model was more often selected correctly than the power and spherical models.
For incomplete blocks and a model choice between B-RCB, B-IB and spatial models, the B-IB model was rarely selected. For t=30 the proportion was somewhat higher for k=5 than for k=10, because a constant covariance is a more realistic assumption for smaller blocks.
When there was only a choice between B-RCB and B-IB and simulation was with incomplete blocks, then model fit with B-IB was generally better when correlations are strong. This finding was particularly true for t=30 and was more pronounced with k=5 than with k=10 (results not shown).
Bias of estimated standard error of a difference
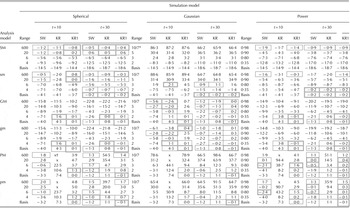
Table 4 shows that the bias of s.e.d. estimates depended on the combination of simulation and analysis model, the value of the range parameter, the number of treatments and the method for adjusting t- and F-tests (SW, KR and KR1). Results for the range parameter values not shown in Table 4 followed the same trend.
Bias of estimates of mean standard error of a treatment difference (s.e.d.) (%) in designs with complete blocks for all combinations of simulation and analysis model for selected values of range parameters. Control of the nominal Type I error rate with approximated denominator d.f. for t-test  and for t- and F-tests
 . Approximation based on Satterthwaite (Reference Satterthwaite1941) – SW, on Kenward & Roger (Reference Kenward and Roger1997) – KR and on Kenward & Roger (Reference Kenward and Roger2009) – KR1

* Range=10 for t=10; range=7 for t=30.
† x: bias>100%.
When simulation and analysis model agreed, a relatively small bias was expected. But the current results show that this was not generally the case:
-
• For the spherical model and analysis according to SM and sm, for all A⩾20 the bias was minimal. As A decreased, bias became increasingly negative for SM. For t=30 and SM results were less favourable than for t=10. When analysing according to sm with t=10, the negative tendencies were milder than for SM, and for t=30 starting from A⩽4 a bias was practically non-existent. For SW, KR and KR1 biases were comparable in magnitude.
-
• For the Gaussian model, biases for t=30 were considerably smaller than for t=10 most of the time. With t=10, SW entailed slight negative biases, while for KR1 the bias was slightly positive. The results for GM and gm were very similar.
-
• The power model in conjunction with KR showed extreme biases, more severely so for t=10 than for t=30. For t=30, the differences between SW and KR1 were minor.
Some noteworthy results when simulation and analysis model did not coincide are now discussed briefly:
-
• In general, only a small bias was observed for t=10 with KR1 and for t=30 with all three methods in case of weak correlation. This was not the case for analysis according to SM (t=10 and 30) and sm (t=10).
-
• When the true model was spherical or the power model and analysis was done by GM, results were very similar. The negative bias with strong correlations became smaller with decreasing correlation for all three methods, and with KR turned positive or vanished altogether, as it did with KR1. With large correlations, bias for t=30 was more pronounced than with t=10. Analysis by gm yielded nearly identical results as GM.
-
• When analysing the spherical model with models PM or pm, biases showed similar values as with the simulated power model.
-
• For the Gaussian model, severe positive biases occurred for range parameter values A +⩾ 4 and analysis by SM, sm, PM or pm with all methods.
-
• For incomplete block designs, analyses by spatial models yielded similar results as for complete block designs. When analysing by B-IB combined with SW, the bias ranged from –2·2 to –0·26% and with KR (= KR1) it ranged from –0·4 to 0·9% (results not shown).
-
• For the analysis according to B-RCB, the bias was between –0·5 and +0·4% for all simulation models (results not shown).
Control of the nominal Type I error rate for t- and F-tests
The biases reported in Table 4 are marked when the nominal Type I error rate was controlled according to the binomial test. The maximum of the effective number of runs on which the binomial test was based was 10 000 and for T10-H0 the minimum number was 1911 (SW and KR1) and 1139 (KR), respectively, and for T30-H0 the minimum was 6859 (SW and KR1) and 1691 (KR), respectively. The largest numbers of runs that did not converge or were excluded according to the criteria (i)–(iv) occurred when the analysis was done according to PM or pm, regardless of the simulation model.
When the bias of the s.e.d. estimate was small, the empirical Type I error rate tended to be controlled at the nominal level. Negative bias in s.e.d. tended to be associated with liberal Type I error rates, and similarly, positive bias in s.e.d. was associated with conservative Type I error rates. The association between bias in s.e.d. and Type I error rates is apparent from Table 4. When simulation and analysis models coincided, there was almost always (the spherical model was an exception) one approximation that guaranteed control of the Type I error rate of t-test. For the F-test, error control was obviously more problematic than with the t-test (Table 4). There was no case where the F-test controlled the nominal level, but the t-test did not.
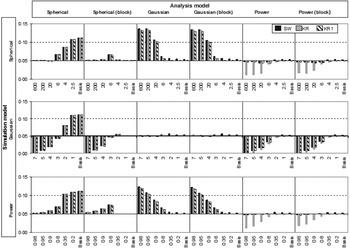
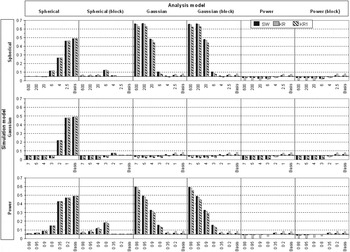
In Figs 2 and 3, empirical Type I error rates are depicted for t=30 for the t-and F-tests based on trials with complete blocks. The F-test consistently showed stronger departures from the nominal level than the t-test. Results for KR1 are now considered in detail. For t=30 the t-test was most conservative with a rejection rate of 0·001 (bias of s.e.d. 66·7%), and most liberal with a rejection rate of 0·131 (bias of s.e.d. –21·6%). For the F-test, the rejection rate ranged between 0 and 0·6292.
Empirical Type I error rates of t-test with three adjusting methods (SW, KR and KR1) for t=30 treatments.

Empirical Type I error rates of F-test with three adjusting methods (SW, KR and KR1) for t=30 treatments.

For t=10 the empirical Type I error rates of the t-test ranged from 0·001 (bias equal to 87·6%) to 0·095 (bias equal to –14·4%) and for the F-test from 0 to 0·198.
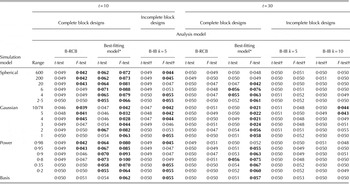
Independently of the simulation model, analysis by the B-RCB model using a t-test controlled the Type I error for both t=10 and 30. The same was true for the F-test and t=30, while for t=10, this was only the case for weaker correlations (Table 5). For higher correlation the tests were conservative. Analysis of incomplete block designs according to B-IB generally resulted in good control of the nominal Type I error rate for the t-test with KR (=KR1) (Table 5). For the F-test with t=10, this tended to be the case for intermediate correlation, while good control was generally achieved for t=30.
Empirical Type I error rates for the best-fitting models using the KR1 method compared with analysis according to B-RCB and B-IB for all simulation models. Bold faced: nominal Type I error rate of 0·05 not controlled according to binomial test

* Selected from the models B-RCB, SM, sm, GM, gm, PM and pm.
† Using the KR method (=KR1 method).
‡ Range=10 for t=10; range=7 for t=30.
The following section discusses to what degree the best-fitting model controlled the Type I error rate and will also investigate whether the same adjustment method (SW, KR or KR1) can be used for all analysis models. If one considers the three analysis models SM (sm), GM (gm) and PM (pm) and the three methods SW, KR and KR1, then there are 33=27 possible choices for analysis. Checking all 27 possibilities, it was found that with nearly all simulated cases the Type I error rate was controlled well by the best-fitting model, if for all analysis models the KR1 method was used. In these analyses, the number of effective runs under KR1 was equal or close to 10 000 in all cases (minimal effective number of runs was 9982 for t=30 and the power model with ρ=0·98). With t=10 and simulation of the spherical or power model, the best-fitting models showed slightly excessive Type I error rates for both the t- and F-tests (Table 5). The maximum error rates were obtained for intermediate correlations. With the Gaussian model, better results were achieved for the t-test, which, again, tended to become liberal for intermediate correlations. The F-test showed both liberal and conservative behaviour, and in no case was the Type I error rate controlled at the nominal level. For t=30, Type I error control of the t-test was very good, and only slightly liberal behaviour was observed for spherical and power models when correlation was intermediate, but this was not as pronounced as for t=10. For the F-test, results for t=30 with the spherical and power models were better than for t=10, but again not fully satisfactory; results for the Gaussian model were often worse.
Power analysis for t-test
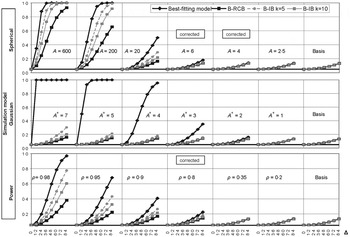
Power analysis is reported in detail for t=30 and KR1, because in this case there was usually satisfactory Type I error rate control when using the best-fitting model (Fig. 4). When there was not a sufficient control, power was computed using significance thresholds derived from the simulations under the null hypothesis (these cases are marked as ‘corrected’ in Fig. 4).
Power of the t-test as a function of treatment difference Δ for t=30 treatments. Analysis of simulated models according to B-RCB, B-IB and best-fitting model using the KR1 method.

For B-RCB the power was generally the smallest and it was the highest for the best-fitting model. Analysis by B-IB was intermediate between these two extremes, and power was higher for k=5 than for k=10. The larger the spatial correlation, the more marked was the power gain from spatial analysis and also of an analysis by B-IB. The most pronounced gains were found when data were simulated by the Gaussian model, followed by the power and spherical models. For t=10, in most cases only the corrected power could be interpreted, because control of the Type I error rate was not acceptable. The same ranking of analysis models was found, but the differences were smaller: the spatial models had slightly lower power and B-RCB a slightly higher power than for t=30.
DISCUSSION
Role of rejection rules for simulation runs
The rejection rules used in the current analysis became effective with varying frequency for the different combinations of simulation and analysis model as well as the approximation methods SW, KR and KR1. In some cases, they had a pronounced effect on the reduction of bias of s.e.d. estimates and the Type I error control. It is useful to check for an obtained model fit whether any of the criteria (i)–(iv) is met, because these identify situations that are statistically questionable. This can be illustrated for criterion (iv), which played an important role for analyses by PM and pm, when the estimate of ρ fell close to the boundary of the parameter space. When
 $\hat \rho $
is close to 1 in the power model, this implies a strong correlation, while
 $\hat \rho = 1$
implies a confounding of the spatial component with the block effect, corresponding to a lack of spatial correlation within blocks (Piepho et al.
Reference Piepho, Richter and Williams2008). The decision in favour of one of these two opposing possibilities depends on the numerical precision, but has contrasting interpretations. The effect of this criterion was particularly important, when stronger correlations were present and analysis was by PM or pm with KR: For all simulation models the originally observed bias was larger than 104% with the maximal range, but dropped to values between 130 and 450% for t =10 and 36 to 92% for t=30. Also with KR1 substantial bias reductions were observed. These observations were the motivation to give preference to sm or SM in case of a tied first rank between PM and SM or between pm and sm according to AICC and LRT (see the Section on simulations). These ties occurred mostly when
 $\hat \rho = 1$
. The current simulations did not deviate from the default settings of the optimization routines in order not to rule out a priori any potentially critical cases that would otherwise have gone unnoticed. When analysing by PM or pm, then independently of the simulation model the criterion (iv) was often in agreement with criteria (i)–(iii). Based on the current results it can be recommended to impose the boundary constraint
 $\left| {\hat \rho} \right|{\rm \lt} 0 {\cdot} 9999$
during optimization of the restricted log-likelihood.
In the current assessment of KR1, the effect of replacing a best-fitting model that was excluded according to our criteria with the best-fitting model that passed all criteria was checked. Since there were only 18 rejections, their replacement had virtually no effect on the distribution of the best-fitting models.
Bias of estimates of standard errors of a difference and of parameters of the covariance structure
The degree of positive or negative bias for s.e.d. depends on the combination of simulation and analysis model and on the value of the range parameter. The most extreme biases occur when the simulation model has specific features that cannot be captured by the analysis model. Two such features will be considered in more detail.
(1) While differences in bias are relatively small between PM and pm as well as between GM and gm with all simulation models, the differences were more marked between SM and sm in case of modest correlation. In addition, when analysing by PM, pm, GM, gm and sm, the bias tended to decrease with decreasing correlation. This was not the case when analysing by SM. These observed differences can be explained as follows: Estimation by REML requires that the first two partial derivates of the matrix V with respect to the variance parameters exist. Kenward & Roger (Reference Kenward and Roger1997, Reference Kenward and Roger2009) pointed this out explicitly for KR, KR1 and KR2. Differentiability holds for the Gaussian and power models for distances d>0, but not for the spherical model at d=A. Thus, biases and/or convergence problems are to be expected for the spherical model whenever the range A is smaller than the maximal distance within a block or the whole experiment. As is well known for the exponential model (Zhang & Zimmerman Reference Zhang and Zimmerman2005), the parameters of the spherical model cannot be estimated without bias and they cannot be meaningfully interpreted. Irvine et al. (Reference Irvine, Gitelman and Hoeting2007) showed for the exponential model that the ratio of REML-estimators of the two parameters is nearly unbiased with respect to the true ratio. The current results showed the same for the spherical model in the case of strong spatial correlation and analysis according to SM or sm. This means that for the exponential and spherical models the estimated covariance function may be expanded or compressed along the distance axis relative to the true covariance function. When analysing by SM, a pronounced expansion was observed, meaning that the critical point d=A tended to be larger than the largest distance within the trial area. But this did not allow representation of the weak correlations present for A⩽6. When analysing by sm, decreasing values of A led to stronger compression, such that at A⩽4 in more than 61% (t=10) and more than 97% (t=30) of simulation runs, the range parameter was estimated as zero and the estimate of σ 2 was equal to that for B-RCB. Since there is no bias for B-RCB, bias was also reduced for sm compared with SM and bias vanishes for t=30. This behaviour of SM and sm occurred irrespective of the simulation model and the approximation method. In order to also allow a transition to the baseline model when using SM, it is useful to add a nugget effect. To explore this point, a nugget for t=10 was exemplarily added, simulating from the spherical and Gaussian models with weak correlation and analysing according to SM. Addition of the nugget substantially reduced the bias for s.e.d., and with KR1 the t-test controlled the nominal Type I error rate. When simulating from the baseline model, for the F-test the empirical rejection rate went down from 0·198 to 0·057. This positive effect of inclusion of a nugget effect could be demonstrated for analysis by SM only, and the improvement seems to depend on the critical point d=A and the dimensions of the experimental field. In principle, one can generally include a nugget effect σ 2 N in case of weak (or zero) correlations. The analysis model would then be Cov(d)=σ 2 N + σ 2 • f(d) and would coincide with the baseline model in case of σ 2=0. When correlation is high, presence of a nugget effect often causes convergence problems.
The consistent estimation of the ratio of variance and range parameters observed for the exponential model by Irvine et al. (Reference Irvine, Gitelman and Hoeting2007) could not be found for the power model, because estimates
 $\hat{\rho} \leq 0$
and
 $\hat \rho = 1$
frequently occurred, meaning that the estimated covariance model did not always coincide with that for the exponential model.
(2) In contrast to the other two models, the Gaussian model has a point of inflexion, located at the spatial distance d IP=A +/√2. When analysing by either GM or gm, the mean of observed estimates of A + and σ 2 and their ratio were close to the true values when the correlation was high, whereas A + was slightly overestimated for weak correlations.
When data were generated from the power or spherical models, both of which do not have a point of inflexion, analysis by GM or gm shifted the inflexion point in such a way, that d
IP was within the smallest distance between two plots, or nearly so. Even for strong correlation the maximal estimated ranges were smaller than the shortest distance to the neighbouring block (8 m), such that results for GM and gm were nearly identical. Estimates of σ
2 were slightly above the value obtained for the analysis according to B-RCB, applying the equation
 $\hat \sigma _{\rm B - RCB}^2 = \sigma ^2 - \overline {\rm Cov} (d)_{\rm CB} $
, where
 $\overline {\rm Cov} (d)_{\rm CB} $
is the average covariance among plots in the same complete block according to the simulation model. The excess covariance compared to this average covariance was captured by GM and gm, leading to the negative bias observed.
Conversely, when data were simulated by the Gaussian model, then with stronger correlation, the models SM, sm, PM or pm were not able to represent the sigmoidal shape of the covariance function. With larger correlation this led to a high positive bias. With A +<2·8 the value of d IP is smaller than 2. In this case, biases were of the same order of magnitude as with analysis of the spherical model by SM or sm and of the power model by PM or pm when correlations were comparable.
In comparison to the general tendencies, the differences between the three approximations were minor. Hu et al. (Reference Hu, Spilke and Richter2006) compared the SW- and KR-methods for specific contrasts exploiting the correlation across the whole experimental field. In accordance with the present results for the power model, Hu et al. (Reference Hu, Spilke and Richter2006) found that the exponential model without nugget, combined with the KR method, entailed biases of s.e.d.>100%. Similar results were obtained for the spherical model without nugget, which does not agree with the current results. Based on these findings, Hu et al. (Reference Hu, Spilke and Richter2006) recommended the SW method for models with and without nugget. Closer scrutiny revealed that this discrepancy is due to the fact that Hu et al. (Reference Hu, Spilke and Richter2006) used the expected information matrix (Fisher scoring), while in the current work the observed information matrix (Newton–Raphson algorithm) was used for maximizing the residual log-likelihood. Hu et al. (Reference Hu, Spilke and Richter2006) preferred Fisher scoring because this led to better convergence behaviour than the Newton–Raphson algorithm when their simulation and analysis models contained a nugget effect.
For the analysis by B-RCB and B-IB, a bias is virtually non-existent, due to the averaging over 10 000 randomizations, with the KR (=KR1=KR2 in this case) showing slight advantages compared to SW.
Relation of model selection and control of Type I error rate
Except for the spherical model where a nugget was recommended, the Type I error rate of the t-test was controlled by at least one of the three methods when simulation and analysis model were the same. The fact that this was also the case when the spatial correlation was low and simulation and analysis model did not agree can be explained by a frequent convergence of these models to the baseline model. Scrutiny of the best-fitting model showed in all cases, that the empirical Type I error was largest for intermediate values of the spatial correlation, sometimes even significantly larger than the nominal rate of 0·05. In view of this finding, the LRT was also considered for model selection when models were nested, which favours the baseline model somewhat more often than AICC. The expectation was that this would improve Type I error control, but Table 5 shows that this was not always the case. This raises the question if AICC should be replaced with AIC or BIC. The penalty term of BIC is defined as q × log(n), where q is the number of variance parameters and n is the ‘sample size’. In mixed models it is not obvious, however, what the sample size is, because observations are not stochastically independent (Pauler Reference Pauler1998), and implementations in software often use rather ad hoc definitions. For example, when data are modelled to be independent between blocks, then the MIXED procedure of SAS sets n=r for the spatial models, where r is the number of replicates, while for B-RCB it sets n=(t−1)(r−1), where t is the number of treatments, as well as for spatial models where correlation extends across blocks. The current simulations show that with these definitions, in almost all cases one of the models sm, pm or gm was selected when using BIC for model selection. Even when simulating from the baseline model, this was not generally identified as the best-fitting model, which adversely affected the empirical Type I errors of the best-fitting model. The AIC tended to favour spatial models more often than AICC.
As already reported by Richter & Kroschewski (Reference Richter and Kroschewski2012) for uniformity trials with t=10, the F-test did not control the nominal level well.
Power analyses
With analysis according to B-RCB, the average covariance within blocks is larger for t=10 than for t=30 for all simulated spatial models, meaning that
 $\hat \sigma _{\rm B - RCB}^2 $
was smaller, on average, for t=10. Although the error degrees of freedom for t=10 are smaller, the power was larger than for t=30. Only when the spatial correlation is weak (spherical model for A⩽4, Gaussian model for A
+⩽2, power model for ρ⩽0·35), do the larger degrees of freedom for t=30 lead to a slightly elevated power (+0·05) compared with t=10.
Estimates of σ
2 based on B-IB were approximately equal to
 $\sigma ^2 - \overline {\rm Cov} (d)_{\rm IB} $
as expected, where σ
2=200 and
 $\overline {\rm Cov} (d)_{\rm IB} $
is the mean covariance of plots in the same incomplete block under the assumed simulation model. From this it emerges that for t=30 power is expected to be larger with k=5 than with k=10, and that for B-IB power is generally larger than for B-RCB. Comparing the ratio
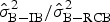 $\hat \sigma _{\rm B - IB}^2 /\hat \sigma _{\rm B - RCB}^2 $
with the efficiency of the incomplete block design under study, one can determine the point starting from which value of the range parameter, for given σ
2 and fixed plots and block sizes and arrangements, a power gain is to be expected from incomplete blocking as compared to complete blocking. With the three incomplete block designs considered in the present study, about the same results were obtained, because efficiency factors do not differ much. The correlations between neighbouring plots (d=2) should be at least 0·52, 0·53 and 0·42, which is relatively high. This corresponds to range parameter values A⩾6, A
+⩾2·5 and ρ⩾0·65, respectively. These values agree roughly with those depicted in Fig. 4. When correlations become slightly smaller, the spatial analyses are still at an advantage compared with B-RCB and B-IB, but the edge is marginal.
Standard errors of treatment means
Just as for treatment differences, treatment means are also estimated without bias (Harville & Jeske Reference Harville and Jeske1992). But there are often severe biases in the estimated s.e.m. that are much larger than for s.e.d. Based on the current simulation results, it may be assumed that while estimates of s.e.d. benefit from the fact that estimates of the ratio of covariance parameters are approximately unbiased, for s.e.m. the absolute values of the parameter estimates are crucial, and these tend to be more strongly biased. Only with simulation according to the Gaussian model and analysis by GM or gm was the bias small for s.e.m., because covariance-parameter estimators are nearly unbiased. This means that computation of confidence limits for treatment means, as often found in the literature, is not to be recommended, while confidence limits and tests for differences are reliable.
Preliminary assessment of GLIMMIX compared with MIXED and second-order Kenward–Roger method compared with first-order Kenward–Roger method
Detailed results can be found in the Supplemental Material (available at: http:// http://journals.cambridge.org/AGS): only a brief overview is given here. The comparison of MIXED and GLIMMIX for KR1 showed the influence of the numerical optimization method on convergence behaviour and results. The largest difference was observed with simulation by the Gaussian model for t=10 (A +=10) and t=30 (A +=7) and analysis by GM and gm. With MIXED and analysis by GM, a maximum of three runs did not converge, while with GLIMMIX 54% (t=10) and 66% (t=30) of all runs did not converge with the default settings; similar behaviour was found for analysis by gm. Despite these gross differences in the effective number of runs, the bias for s.e.d. was comparable with both procedures. With the other combinations of simulation and analysis model the effective number of runs and the calculated bias was more similar between both procedures; in a few cases, however, differences in bias estimates ranged up to 11·8% (t=30, simulation by baseline model and analysis by sm). The reason was that with analysis according to sm there was no automatic transition to the baseline model for analysis as with MIXED. In almost all instances where the bias estimates differed by more than 1%, the bias was larger with GLIMMIX. Regarding the control of the nominal Type I error rate with F- and t-tests, similar results were obtained with GLIMMIX as those presented in Table 4 for t=10. With t=30 the control was slightly poorer with GLIMMIX than with MIXED. The comparison of KR1 and KR2 within GLIMMIX shows slight advantages of KR2 in t-tests for t=10, but much less favourable results in the F-test (instead of 13 combinations of simulation and analysis model in case of KR1, only for one combination was there a satisfactory control of the Type I error rate). For t=30, results were about the same with both procedures for the t-test, whereas for the F-test the KR2 method was again inferior.
The occasional differences in convergence behaviour between GLIMMIX and MIXED mean that particularly in the case of stronger correlations, different models were sometimes selected as best models by GLIMMIX and by MIXED. Regarding the Type I error control by KR1, both procedures yielded quite similar results for the best-fitting model. Only in the exceptional cases described above (simulation by the Gaussian model, t=10 with A +=10 and t=30 with A +=7) did use of GLIMMIX lead a conservative empirical Type I error rate.
The comparison of KR1 and KR2 in GLIMMIX did not suggest a clear advantage for KR2. This result is somewhat unexpected, because Kenward & Roger (Reference Kenward and Roger2009) pointed out that the KR2 method is to be preferred over the KR and KR1 method for nonlinear covariance models, which includes spatial covariance models. Further simulations comparing the KR1 and KR2 methods are certainly needed to gain a broader picture. Based on the current results, it is recommended to use the KR1 method in MIXED.
CONCLUSIONS
Conclusions for the example
In the introductory sugar beet example the power model PM was the best-fitting model among those converging; the criteria (i)–(iv) did not hold for the fitted PM model. In contrast to the simulations, the ‘true’ model is not known here. It is therefore important to make sure that the analysis strategy is such that the best-fitting model controls the nominal Type I error rate. This could be demonstrated for the t-test in case of t=30 when using the KR1 method, while for t=10 the tests tended to be on the liberal side. In the example there were t=18 treatments. Hu et al. (Reference Hu, Spilke and Richter2006) showed for the SW and KR methods that even t=20 leads to a notable improvement compared to t=10. It may therefore be assumed that in the example, the control of Type I error rate is also satisfactory for the t-test so that results based on the KR1 method are reliable. Often, pairwise t-tests are preceded by a global F-test. But the F-test revealed relatively poor control of Type I error when based on the best-fitting model, leaning either to the liberal or the conservative side. It is therefore advisable to perform such F-tests using the baseline model (B-RCB) and switch to the best-fitting spatial model only for the pairwise t-tests.
General remarks
The current results show that, independently of the model for spatial correlation and the strength of correlation, a randomized complete block design and analysis according to B-RCB provide control of the nominal Type I error for the t-test (for 10 and 30 treatments) and for the F-test (for 30 treatments). In case of strong correlation and 10 treatments, the F-test tends to be conservative. Similar results were found for incomplete block designs and analysis by B-IB, the KR method (=KR1=KR2 in this case) yielding slightly better results than the SW method. When spatial simulation and analysis model do not coincide, then departures from the nominal Type I error rates may be more marked depending on the method of adjustment, which are larger for the F-test than for the t-test. For this reason, the choice of model selection criterion as well as the choice of candidate models is of paramount importance. In contrast, it makes little difference whether spatial correlation is modelled across the whole experimental field or only for plots within the same block (exceptions: SM and sm). When analysing by SM or sm, it is recommended to check whether a nugget effect is needed. If the best-fitting model is selected by AICC and LRT and the KR1 method is used, the nominal Type I error rate is well controlled most of the time for the t-test in case of 30 treatments, while for 10 treatments both the t- and F-tests were on the liberal side. The power analyses show that the gain from spatial modelling can be substantial compared to a baseline model with complete block effects in the case of strong spatial correlation, and, to somewhat lesser degree, also for a baseline model with incomplete block effects. When correlations between neighbouring plots were below 0·3, neither incomplete block effects nor spatial models afforded any gain compared to analysis based on a complete block model. In the interpretation of results for incomplete blocks, it should be kept in mind that no incomplete block effects were simulated. The results show that incomplete block designs are capable of improving power compared to complete blocks when there is spatial correlation among plots.
In addition to the analyses considered in the present paper for designs with incomplete blocks, one may, of course, also combine random effects for incomplete blocks with a spatial error model. Selected additional simulations were performed (detailed results not shown) to compare the combined model with analyses based on B-IB, a purely spatial model and B-RCB. With stronger correlation, the combined model was selected as best in up to 10% of the cases based on AICC, although no incomplete block effects were simulated.
Given that the true model is among the candidate models, the current results suggest that in large trials with a larger number of treatments, a t-test using the KR1 method provides valid results for spatial models. The uncertainty associated with model selection can be alleviated somewhat by employing a more comprehensive class of spatial models, thus increasing the chances that the true underlying model is close to at least one of the candidate models. For example, the Matérn model, which has an additional shape parameter, provides additional flexibility, and it encompasses the exponential and Gaussian models as special cases (Matérn Reference Matérn1986; Haskard et al. Reference Haskard, Cullis and Verbyla2007). The convergence behaviour of this model may be problematic, however, when no suitable starting parameter values are supplied.
The current simulations indicate that in trials with a smaller number of treatments there is a trend for tests to be on the liberal side when a spatial model is assumed in analysis. Based on the randomization theory, and independently of the number of treatments, designs with incomplete blocks and analysis by the baseline model are a viable alternative that minimizes the computational demand and yields valid tests in conjunction with the KR (=KR1=KR2 in this case) method, but at the cost of some loss in power, particularly in case of a large number of treatments and strong spatial correlation.
Supplementary Material
The supplementary material for this article can be found at http://journals.cambridge.org/AGS
We thank the colleagues of the Division of Agronomy and Crop Science (Humboldt-Universität zu Berlin, Faculty of Life Sciences, Albrecht Daniel Thaer-Institute of Agricultural and Horticultural Sciences, Germany) for providing the sugar beet data.