

1. Introduction
Cotton production faces a rising incidence of disease and insect attacks in developing countries including Pakistan. Small farms, which dominate Pakistan's agriculture, are particularly vulnerable to pest infestation, because of their inability to bear any form of financial risks. Pesticides are a very important input in cotton production and account for 33 per cent of input costs (Farooqi, Reference Farooqi2010). Farmers often misuse or overuse pesticides in developing countries including Pakistan. Liu and Huang (Reference Liu and Huang2013) and Gong et al. (Reference Gong, Baylis, Kozak and Bull2016) argue that risk-averting farmers make higher use of pesticides, although pesticide use decreases with farm size (Gong et al., Reference Gong, Baylis, Kozak and Bull2016). Adoption of Bacillus thuringiensis (Bt) cotton, which provides resistance against the common cotton pest called bollworm, is seen as a solution to the current pest-related challenges to cotton.
The Bt cotton seed includes a genetically engineered modified soil bacterium gene, Bacillus thuringiensis. This gene has a natural toxin against several insects and pests, especially bollworms. Thus, its proponents argue that using this type of cotton seed could lead to reduced pesticide use and have a positive impact on the environment. Many countries have seen substantial reduction in pesticide use along with increased cotton production because of this new technology. The USA, Australia, China, Mexico, Argentina, South Africa and India are some examples of countries that have allowed the cultivation of Bt cotton at a commercial level and gained in terms of lowered pesticide use and costs and higher yields (Qaim and de Janvry, Reference Qaim and de Janvry2005; Qaim and Matuschke, Reference Qaim and Matuschke2005; Bennett et al., Reference Bennett, Kambhampati, Morse and Ismael2006; Qaim et al., Reference Qaim, Subramanian, Gopal and Zilberman2006; Subramanian and Qaim, Reference Subramanian and Qaim2010; Kathage and Qaim, Reference Kathage and Qaim2012; Mulwa et al., Reference Mulwa, Wafula, Karembu and Waithaka2013). However, there are studies indicating that Bt cotton adopters make excessive use of pesticides (Liu and Huang, Reference Liu and Huang2013; Gong et al., Reference Gong, Baylis, Kozak and Bull2016). This is particularly true for small landholders whose livelihood mostly depends on earnings from cotton production. Thus risk preference matters in the adoption of Bt cotton seed (Liu, Reference Liu2013).
Because of the emerging importance of Bt cotton in the economies of the developing countries in general and Pakistan's cotton farming system in particular, our study tries to answer three questions. (a) Does Bt cotton seed use lead to decline in pesticide use in cotton production? (b) Are yield and revenue generated from Bt cotton users higher than yield and revenue from non-Bt cotton users? (c) Is the cost of inputs such as fertilizer, labor and irrigation water used to plant Bt cotton higher than that used for non-Bt cotton? The objective of this study is to determine the average effect of adoption on yield, input use and profit.
While there have been studies in Pakistan that have looked at the efficacy of Bt cotton, these studies have been limited by their use of single-year data on a cross-section of farmers (Hayee, Reference Hayee2005; Sheikh et al., Reference Sheikh, Mahmood, Hussain, Bashir and Saeed2008; Ali and Abdulai, Reference Ali and Abdulai2010; Nazli, Reference Nazli2010; Kouser and Qaim, Reference Kouser and Qaim2013, Reference Kouser and Qaim2014; Abedullah et al., Reference Abedullah and Qaim2015; Bakhsh et al., Reference Bakhsh, Akram, Jahanzeb and Khan2016). Even the recent studies from other countries (Liu, Reference Liu2013; Liu and Huang, Reference Liu and Huang2013; Gong et al., Reference Gong, Baylis, Kozak and Bull2016) use cross-sectional data. Focusing on cross sectional single-year data is problematic because the data do not account for variations in weather conditions and insect pest infestation in different years which may affect yields. In single-year studies, it is hard to separate the effects of Bt technology from these other effects. Thus, in examining how Bt cotton performs and the level of economic benefits farmers may gain when they use the Bt cotton seed, a panel model approach is more appropriate. This is the approach our study follows.
The results of the previous studies may not give consistent estimates because of endogeneity emerging from two sources – farmers’ self-selection and endogenous farm inputs. The availability of Bt cotton seed in the market indicates that the decision to adopt Bt cotton is voluntarily made. Given that farmers choose to adopt this technology, there is a possible correlation between unobservable characteristics that affect the outcome of the decision and those that influence the adoption decision itself. Thus, farmers who choose to adopt Bt cotton may have some ‘unobserved’ entrepreneurial skills that may lead them to adopt Bt cotton but that may also result in increased yields. Thus, attributing all the increase in yields to Bt cotton seed would be inappropriate. Further, the use of farm inputs is commonly endogenous and based on choices that farmers make. Ignoring endogeneity can cause biased estimates of the determinants of yield.
There are several statistical options for dealing with problems of endogeneity. Many studies, however, do not control for endogeneity (Sadashivappa and Qaim, Reference Sadashivappa and Qaim2009; Liu, Reference Liu2013; Liu and Huang, Reference Liu and Huang2013). Those that do address this problem generally use the instrumental variable (IV) approach (Huang et al., Reference Huang, Rozelle, Pray and Wang2002; Qaim and de Janvry, Reference Qaim and de Janvry2003), panel methods (Bennett et al., Reference Bennett, Ismael, Morse and Shankar2004; Crost et al., Reference Crost, Shankar, Bennett and Morse2007) or propensity score matching (Ali and Abdulai, Reference Ali and Abdulai2010; Nazli, Reference Nazli2010). Crost et al. (Reference Crost, Shankar, Bennett and Morse2007) argue that some studies that use IV and indicate that there is no severe endogeneity problem may actually be using weak instruments. An alternative to the commonly used IV approach is the panel method, which can provide unbiased estimates. Crost et al. (Reference Crost, Shankar, Bennett and Morse2007), for example, use panel methods to show that more than half of the yield advantage of Bt cotton in the studies with cross-sectional data is the result of self-selection bias. In our study, the selectivity problem related to the adoption of Bt cotton and the endogeneity of pesticide and other inputs is accounted for by using panel methods. These methods are particularly useful in that they control for endogeneity relating to observable and unobservable characteristics. Further, panel methods are more robust as they require fewer assumptions than the IV method (Stock et al., Reference Stock, Wright and Yogo2002).
The cotton crop is sensitive to variation in climatic variables such as temperature and rainfall. Optimum temperature for cotton germination in Pakistan is in the range of 30–35°C. Rainfall at the maturity stage adversely affects cotton production. Climatic data on temperature and rainfall during 2008 and 2009 shows little variation in temperature; however, higher precipitation was recorded during 2008 compared to 2009. Our study presents an analysis of Bt cotton productivity based on data collected from a sample of farm plots over two cropping seasons. Using two years of crop season data also improves on the available literature on Bt cotton in developing countries including Pakistan by using a panel estimation method that controls for endogeneity in estimation. Our findings related to yield, farm inputs and profitability are largely different from many previous studies, suggesting that controlling for endogeneity avoids overestimation or underestimation of the true benefits of Bt cotton.
The remainder of the paper is organized as follows. Section 2 describes the adoption of Bt cotton in various countries and its impacts on pesticide use. Section 3 provides details of the study area and data collection strategy. Empirical methods used to compute impacts of Bt cotton are discussed in section 4. Section 5 elaborates on the empirical results of the study and concludes.
2. Adoption of Bt cotton and its impacts on pesticide use: a review
The increased use of pesticides in Pakistan raises environmental concerns and also makes Pakistani cotton less competitive in the world market. Farmers can reduce pesticide use on the cotton crop in multiple ways. These include biological control methods, mechanical controls, integrated pest management and selection of cotton varieties with resistance against pests. Most options require continued research and development and a good deal of effort toward introducing, motivating and training targeted farmers in order to convince them of the benefits of the new method. However, with genetically modified (GM) cotton seeds, little investment is required in disseminating this technology as long as the Bt seed is available in the market.
GM seeds, first adopted in developed countries, are an expensive technology. Nonetheless, the Bt cotton seed, in particular, has spread widely in developing countries in recent years. The main reason for this is the many private benefits of Bt cotton. Studies by Pray et al. (Reference Pray, Huang, Hu and Rozelle2002); Qaim and Zilberman, Reference Qaim and Zilberman2003; Huang et al. (Reference Huang, Raifa, Rozelle and Pray2005); Bennett et al. (Reference Bennett, Kambhampati, Morse and Ismael2006); Qaim et al. (Reference Qaim, Subramanian, Gopal and Zilberman2006); Kathage and Qaim (Reference Kathage and Qaim2012), Kouser and Qaim (Reference Kouser and Qaim2013; Reference Kouser and Qaim2014) and Abedullah et al. (Reference Abedullah and Qaim2015) suggest that Bt cotton use reduces pesticide sprays and increases seed cost and yields. Wu et al. (Reference Wu, Lu, Feng, Jiang and Zhao2008) provide evidence that planting Bt cotton not only significantly decreases spraying against the cotton pest bollworm, but also reduces the cotton pest bollworm on other crops.
There are other studies that show that Bt cotton does not have any significant impact on yield and income and bollworms continue to grow (Huang et al., Reference Huang, Rozelle, Pray and Wang2002; Hayee, Reference Hayee2005). Less knowledge about the use of Bt technology, prevalence of a black market for unimproved Bt cotton varieties, climatic variations and other disasters are identified as some of the factors responsible for the failure of Bt cotton in certain countries. There is also concern that Bt cotton can have a negative impact on the earnings of small farmers, because poor farmers may be exploited by foreign monopolies selling the Bt cottonseed (Qaim and de Janvry, Reference Qaim and de Janvry2003). Liu and Huang (Reference Liu and Huang2013) highlight the excessive use of pesticide in Bt cotton production. Risk preferences among Bt cotton farmers play an important role in the decision relating to pesticide use (Liu, Reference Liu2013). A study conducted by Hayee (Reference Hayee2005), for example, comparing the Bt cotton variety with the local cotton variety in Pakistan, shows that small farmers adopt Bt cotton hoping to lower the costs but they may actually incur higher costs because of high seed costs and the need for more fertilizers and irrigation. Negating these findings are studies by Sheikh et al. (Reference Sheikh, Mahmood, Hussain, Bashir and Saeed2008); Nazli (Reference Nazli2010) and Ali and Abdulai (Reference Ali and Abdulai2010), who indicate that the overall outcome of adopting Bt cotton favored all farm categories to varying degrees. Thus, the literature on the impacts of Bt cotton on small farmers is mixed. Further, the loss of biodiversity, genetic pollution (Park et al., Reference Park, McFarlane, Phipps and Ceddia2011) and high seed price (Nazli, Reference Nazli2010) remain some of the possible long-term public costs of using Bt cotton.
An important benefit of Bt cotton to farms, as identified by its proponents, is reduction in health costs from pesticide exposure. The human health impacts of pesticide use are generally difficult to measure (Antle et al., Reference Antle, Cole and Crissman1998). A few studies, such as Pray et al. (Reference Pray, Huang, Hu and Rozelle2002), report that a larger percentage of non-Bt growing farmers (around 22 per cent) identified various health problems related to pesticide use compared to farmers planting only Bt cotton (5–8 per cent). Kouser and Qaim (Reference Kouser and Qaim2011) argue that Bt cotton has led to a notable decline in acute pesticide poisoning cases among cotton growers in India. Similarly, Huang et al. (Reference Huang, Rozelle, Pray and Wang2002; Reference Huang, Raifa, Rozelle and Pray2005) and Kouser and Qaim (Reference Kouser and Qaim2013) estimate that there are health benefits from GM seed use.
Overall, the literature on the impacts of Bt cotton are inconclusive and mixed. This suggests a need for more studies to complement the existing literature. In our study, we focus primarily on the yield and pesticide use implications for farmers using two years of cross-sectional data while controlling endogeneity.
3. Materials and methods
3.1. Study area and data
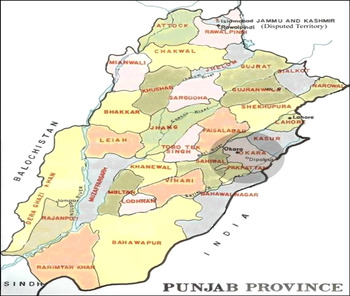
Our study is undertaken in the cotton growing area of Southern Punjab, Pakistan. Punjab is divided into irrigated and non-irrigated areas and we focus on irrigated Southern Punjab, where 90 per cent of cotton farms are concentrated. For our study, we further divided the cotton growing districts into three regions with similar conditions in terms of sowing time, soil type, rainfall, etc. The first cotton growing region includes six districts (Multan, Khanewal, Pakpattan, Sahiwal, Vehari and Muzaffar Garh) and the second comprises five districts (Bahawalpur, R Y Khan, Bahawalnagar, Rajanpur and Lodhran). The third region consists of Dera Ghazi Khan, Layyah, Bhakkar and Mianwali (figure 1). At the time of this study, farmers commonly used both Bt and non-Bt cotton seeds in these districts.
Map of Punjab province and study location
A three-stage stratified sampling technique was used for collecting data. In the first stage, we randomly selected three districts, one from each cotton growing area. The selected districts include Multan, R Y Khan and Mianwali. The second stage involved preparation of a list of cotton growing farmers who purchased cotton seed (either Bt and non-Bt or both) from registered private seed companies/input dealers during the 2008 cotton growing season. The list was organized alphabetically by the name of the village in each district. This list represented our target population in each selected district. In the third sampling stage, respondents were identified from the list of cotton growers using a systematic simple random sampling technique. Thus, we identified 96 respondents from each selected district. If a selected respondent refused to respond, did not farm or was not available in the area after three visits to the farm, the next respondent on the list was considered.
Based on the above strategy, the total sample size of farmers from the three selected districts was 288. The same respondents were interviewed during second crop season, 2009. However, three respondents could not be interviewed due to death, migration, etc. Thus, the final sample for this study is 573 observations.
We conducted an interview-based survey to gather information about input-output and other characteristics in cotton cultivation for two cropping seasons (2008 and 2009). We found some Bt adopters cultivating a conventional (non-Bt cotton) crop at the same time, so we asked them the same questions for both their Bt and non-Bt crops. This allows us to make a comparison of the technology with and without situation more easily across and within farms as well.
We interviewed farmers in our sample twice to obtain data on farming practices, Bt cotton adoption, socio-economic characteristics and related information. Plot-level information was collected on Bt and non-Bt plots per farmer. It included farm inputs and output along with the respective prices. As farmers strategically apply new technology in better plots, having information on characteristics of plots would have yielded interesting findings. However, the study lacks this type of information.
Table 1 provides information on the farmers in our sample and compares farmers who used only the Bt seed with farmers used both Bt and non-Bt cotton seeds. Farming experience and cotton growing experience are higher for farmers growing both types of cotton. The mean values of farming experience and cotton growing experience for the whole sample are 19.51 and 15.18 years, respectively. Farmers fully adopting Bt cotton are significantly more educated compared to their counterparts, with an overall sample mean of 4.16 years of schooling. We also found that very few farmers of either type have access to a credit facility.
Socio-economic characteristics of sampled farmers

Notes: Figures in parentheses are standard deviations. ***p<0.01; **p<0.05; *p<0.1.
The present study estimates the profitability of growing cotton production. For this purpose, variable cost and gross revenue are computed. Costs of land preparation, seed, fertilizers, irrigation, pesticides and cotton picking were summed to compute variable cost. Labor included family and hired labor used in cotton production. Labor cost consisted of the wages paid to farm workers for performing activities from sowing to harvesting. Wages for hired labor are competitive in villages where cotton is planted, as hiring of labor services in villages is common. We used actual wages for hired labor whereas the village wage rate was used for family labor. The same principle was used in estimating costs of other inputs either purchased or owned by the farm family. Fixed costs such as land rent and fixed water charges are not part of the variable cost. Gross revenue was estimated by multiplying yield by the prevailing average village price. Profit (gross margin) is the difference between gross revenue and variable cost. Summary statistics on cotton (see table 2) show that of the total area in cotton, 78 per cent is in Bt cotton. The mean cotton yield is 2,434 kg per hectare (ha). However, farmers growing only Bt cotton obtain a significantly higher cotton yield compared to those growing both types of cotton seed. The mean gross margin is PKR51,685 (US$608)Footnote 1 per ha. Considering Bt cotton plots only, the gross margin is statistically higher than farmers growing Bt and non-Bt cotton. This may be due to the higher yield on Bt plots. Fertilizers used include three major nutrients available in different types of fertilizer bags, which were converted into kg of NPK. The mean NPK applied by the farmers is 241 kg per ha. Labor cost includes both family labor and hired labor and, on average, costs PKR6302 (US$74) per ha. On average, 4 L of pesticides are used per ha whereas 4.9 L per ha is found for farmers with both types of cotton seed. Bt cotton plots have significantly less pesticide use, i.e., 3.5 L compared to their counterparts. Since Bt cotton seed has resistance against bollworms, farmers are able to apply less pesticide to control bollworms. However, cotton growers have to use pesticides to control sucking pests because Bt cotton seed has no resistance against these pests.
Summary statistics of variables in the panel models

Notes: Figures in parentheses are standard deviations. ***p<0.01; **p<0.05.
3.2. Empirical analyses
There are three types of plots in our sample: non-Bt plots, only Bt plots, and Bt plots of those farmers growing Bt and non-Bt cotton, as there were some farmers growing both types of cotton seeds. Thus the economic value of each type of plot is estimated. We compare various inputs and outputs related to both types of Bt cotton plots with non-Bt plots. T-tests are used to compare total variable cost, yield and gross margin of all non-Bt plots to all the Bt plots (including those with some non-Bt seed) and Bt plots of those growing Bt and non-Bt cotton. This type of comparison helps to identify the average effect of adoption of Bt cotton technology on farmers’ yield and returns.
Since our study has data on two cropping seasons, the panel data based random effects (RE) and fixed effects (FE) methods are used for estimating the impact of Bt cotton seed on yield and several input variables. Employing the RE or FE model does not fully solve the endogeneity bias. Ideally, we would estimate profit function since this would not involve any choice variables as explanatory variables (Vincent, Reference Vincent2008). However, information about input and output prices is more likely to be endogenous because farmers may delay the sale of produce in the light of higher expected price in the future. Similarly, some farmers may be able to bargain during the process of purchasing inputs in large amounts or using long-term personal contacts with input dealers. Access to information also plays an important role in creating problems of endogeneity. It demands the use of econometric methods that control for endogeneity. The panel modeling approach avoids this problem by excluding the unit values of input and output prices and considering exogenous variables only. Further, plot level (farms) specific FE could be an additional source of endogeneity that our panel modeling approach opts to address. The current version only articulates farmers’ FE sources.Footnote 2
Our empirical panel, which is estimated econometrically, is given by
 $$\eqalign{\chi_{it} &= \beta_{0}+\delta {{BT}}_{it}+\alpha_{1}{{FS}}_{it}+\alpha_{2}{{FEXP}}_{it}+\alpha_{3}{{DCREDIT}}_{it} \cr &\quad +\beta_{it}\sum D_{i}\times {yr}_{t}+\varepsilon_{it}}$$
where χ it is the dependent variable and includes the gross margin,Footnote 3 yield, seed, pesticide, fertilizer, irrigation and labor inputs of the i th farmer in time period t. Separate regression analyses are run for each dependent variable.
BT it is the share of Bt cotton in the total cotton area grown by the farmer. A significant, positive value of the coefficient of BT it indicates that χ it increases with the Bt cotton area. In this specification, the variable is unlikely to be endogenous. Further, district-year dummies help reduce endogeneity since some of the time-varying unobserved factors are probably common across farmers in a given district. As previously noted, FS it refers to farm size and controls for the effect of scale. FEXP it is farming experience (years) of farmer and DCREDIT it shows access to a credit facility. It takes a value of one if the farmer has availed him/herself of credit in the t-th year, else zero.
D i ×yr t are interaction terms for district and year dummies. Since we have three districts in our data set and two years, the district Multanx2008 is used as the base. The performance of new technology such as Bt cotton depends on weather during a cropping season. While weather remains the same for all farmers in a given location, it varies over time (even in a particular location) and across locations. Prices of farm inputs and output exhibit the same pattern. Thus the purpose of including an interaction term in the model is to control for weather, prices and any other factors that vary over time but do not change within a given location, i.e., district.
We use the Breusch–Pagan Lagrangian Multiplier (LM) to test whether OLS models are appropriate for the data set. The Hausman test is used to confirm whether the FE model is the preferred model over the RE model. Results of the Breusch–Pagan LM test show that panel models are appropriate whereas the Hausman test confirms that the FE model is the appropriate model for all inputs except pesticide and irrigation. We present results from the RE and FE models in table 4, but discuss results related to FE models for all inputs except pesticide and irrigation. The Breusch–Pagan LM test for the RE model suggest that OLS models are not appropriate for the data set for gross margin and yield. The Hausman test favors the FE panel model for yield and the RE model is found appropriate for gross margin.
4. Results and discussion
4.1. Performance of Bt cotton
We undertake two types of mean comparisons of different inputs and output used among farmers growing Bt cotton and non-Bt cotton. The first compares non-Bt plots with all Bt plots for each cotton season (2008 and 2009). The second compares non-Bt plots with Bt plots of those growing Bt cotton and non-Bt cotton on their farms.
The results are given in table 3. The first column for each cropping season contains information about mean values for non-Bt cotton plots, while the second column shows means values for all Bt plots.Footnote 4 Mean values for Bt plots of those farmers growing Bt cotton and non-Bt cotton are given in column three. To understand the difference between Bt and non-Bt seeds, we mainly examine differences between columns 1 and 2, i.e., non-Bt and Bt plots.
Input use, output and returns on per-ha basis in cotton production

Notes: Figures in parentheses are standard deviation. ***p<0.01; **p<0.05; *p<0.1.
Following our a priori expectations, the cost of seeds on Bt plots is higher (76 per cent during cropping season 2008 and 69 per cent during cropping season 2009) compared to non-Bt plots. However, the quantity of seed used is less on Bt plots compared to non-Bt plots during both cropping seasons, as farmers apply costly inputs with more care and efficiency.
As expected, Bt cotton appears to reduce pesticide use. Farmers used fewer pesticides on Bt plots relative to non-Bt plots in both cropping seasons. However, this reduction in pesticide came from the reduced use of pesticides against bollworms. Simultaneously, farmers used more pesticide against sucking pests on Bt plots. Overall, expenses on pesticides on Bt plots declined by 35 per cent in 2008 and 37 per cent in the 2009 cropping season. We used number of irrigations in the present study. Having information on pump size and duration of each irrigation would have added much value to the present study; however, the study lacks this information. The study contains data on time to irrigate and/or cost per irrigation and this may give biased results due to difference in pump size, etc. Thus, number of irrigations is more appropriate because farmers apply water to a crop when there is a need. Figure 2 compares the average amount of inputs or irrigation and pesticide used across 2008 and 2009. As the figure shows, Bt plots receive more irrigation and less pesticide.
Comparison of average inputs (2008 and 2009) in non-Bt and Bt plots

Table 3 shows that Bt cotton growers may see an increase in costs. On average, across the two seasons, costs on non-Bt plots were 5 per cent lower than costs on Bt cotton plots. But table 3 indicates that Bt plots give higher gross income and gross margins, large enough to compensate for the high variable cost incurred. This information becomes even clearer in figure 3, which shows the average gross revenue, input costs and returns (across 2008 and 2009) related to Bt vs. non-Bt cotton plots. On average, across the two seasons, the returns (gross margin) to Bt cotton use were PKR41832 (US$492) per ha vs. a return of PKR53249 (US$626) for non-Bt cotton. Yields for Bt cotton plots were higher and the average gross margin per ha on Bt cotton plots was also higher relative to non-Bt plots.
Comparison of average input costs and returns (2008 and 2009) in non-Bt and Bt cotton plots

We note that yield on Bt plots and non-Bt plots declined in the second cropping season, mainly due to unfavorable climatic conditions (Government of Pakistan, 2010). Table 3 shows that Bt plots perform comparatively well even with adverse conditions.
4.2. Results of panel models for farm input use
To run our panel models, we first aggregated farm-level data related to inputs and then obtained the ratio of these variables per ha, i.e., we divided each input by farm size (following Crost et al., Reference Crost, Shankar, Bennett and Morse2007). In this way, balanced panel data were obtained. Table 4 shows the coefficients of the estimations, with seed, pesticide, fertilizer, irrigation and labor being dependent variables.
Estimates of the panel models for input use

Notes: a For the labor variable, taking the square term of Bt cotton share in total cotton area gives significant results as Bt cotton share and its square are statistically significant, whereas when considering only the Bt cotton share variable this variable becomes statistically insignificant. Robust standard errors in parentheses. ***p<0.01; **p<0.05; *p<0.1.
Table 4 shows that the estimated coefficient of the Bt cotton share variable is statistically significant for the pesticide, irrigation and labor input equations. Thus, a 1 per cent increase in the share of Bt cotton in the total cotton area can lead to a reduction in pesticide use by 1.45 L per ha. Interestingly, the reduction in pesticide use estimated in our study is far lower (21.7 per cent) compared to neighboring countries such as India and China (Huang et al., Reference Huang, Rozelle, Pray and Wang2002; Qaim and Zilberman, Reference Qaim and Zilberman2003; Subramanian and Qaim, Reference Subramanian and Qaim2009). However, the estimated impact of Bt cotton seed on pesticide use is higher in our study relative to other studies conducted in Pakistan (Ali and Abdulai, Reference Ali and Abdulai2010; Nazli, Reference Nazli2010; Kouser and Qaim, Reference Kouser and Qaim2014; Abedullah et al., Reference Abedullah and Qaim2015). This may be because we are controlling for endogeneity bias using panel methods, which are more robust.
The estimated coefficient of interaction of district and year dummy for Mianwali district shows that pesticide use is lower in Mianwali district for the year 2009 compared to Multan district during the year 2008. However, farmers in R Y Khan district make higher use of pesticide during the year 2008 compared to those in Multan district during the same year. All other estimated coefficients of interactions of district dummies and year are insignificant.
Regarding the effect of Bt cotton on fertilizer use and seed, the coefficient of Bt cotton share in cotton areas is negative for both variables, indicating that fertilizer use and seed decline with an increase in Bt cotton area, although both coefficients are statistically insignificant. However, the geographical and time effects on fertilizer use are prominent. Higher fertilizer use is estimated in Multan district during the year 2009 compared to the year 2008 and lower fertilizer use is estimated in Mianwali and R Y Khan districts during the year 2008 relative to the base of Multan in the year 2008. All variables are statistically insignificant in the case of seed use.
Irrigation water is an important resource in crop production. The coefficient of Bt cotton share is statistically significant in the irrigation regression, suggesting that Bt seed use increases irrigation. As expected, farmers who grow Bt cotton need to irrigate more than other farmers, which has implications for overall water use in the region. Coefficients of the interaction terms of district and year dummies show that farmers from Multan district use larger amounts of irrigation compared to those in Mianwali and R Y Khan districts. Having access to credit is also positively related with the irrigation number. As our dependent variable is in the form of count, we also use an ordered probit model and obtain the same findings.
The estimated coefficient for Bt cotton share is positive and significant for the labor regression. This implies that, with an increase in the share of Bt cotton area by 1 per cent, labor cost goes up by PKR5,470 (US$64) per ha. To allow for nonlinear linkages between Bt cotton and labor, we included the square of Bt cotton area share in the labor regression. The negative and significant coefficient of the square term suggests that labor cost in cotton production increases at a decreasing rate with more allocation of area to Bt cotton type. Overall, we conclude that Bt cotton increases labor costs. However, on the positive side, it creates more employment opportunities for the rural poor, particularly for rural female workers at the harvesting stage of the cotton crop, as a result of higher yields.
4.3. Results of panel models for gross margin and yield
Most farmers’ objective is to maximize profit, either through minimizing cost of production or increasing output. Bt cotton, because of its resistance against certain bollworms, is considered as a cost-reducing technology in cotton production. In the present study, gross margin per ha is treated as short-run profit for cotton growers. Table 5 shows results of gross margin and yield effects of Bt cotton technology.
Estimates of the panel models for yield and gross margin

Notes: Robust standard errors in parentheses. ***p<0.01; **p<0.05; *p<0.1.
The estimate of Bt cotton on yield is according to a priori expectation (see table 5). As indicated by the positive and significant coefficient of the Bt cotton share variable, yield increases as farmers allocate more cotton area to Bt cotton. Per-ha yield increases by around 9 per cent due to the use of Bt cotton technology, although the increase is considerably lower compared to studies by Crost et al. (Reference Crost, Shankar, Bennett and Morse2007); Subramanian and Qaim (Reference Subramanian and Qaim2009) and Kouser and Qaim (Reference Kouser and Qaim2013; Reference Kouser and Qaim2014). One reason for the lower estimate may be because farmers have less awareness about Bt cotton seed in Pakistan. Discussion with farmers during the survey reveals that they do not know about the appropriate use of farm inputs relating to Bt cotton.
District and year dummies for Mianwali and R Y Khan for the year 2008 are positive and statistically significant. Results imply that during the year 2008 farmers from Mianwali and R Y Khan received higher cotton yield by 326 and 470 kg per ha, respectively, compared to those of Multan during 2008. Farming experience and availing of credit are not related to cotton yield, as these coefficients are statistically insignificant.
Table 5 shows that short-term profit or gross margin increases with more area allocated to Bt cotton as indicated by a positive and significant coefficient. This coefficient indicates that the cotton growers can increase their gross margin by PKR12,740 (US$150) per ha, or 15 per cent, by increasing the area allocated to Bt cotton by 1 per cent. District and year dummies for Mianwali, R Y Khan and Multan during the year 2009 are positive and statistically significant, implying that gross margins are comparatively higher in 2009 than in 2008. This suggests that cotton growers learn through experience over a time span about new technology.
Bt cotton is associated with higher yield and gross margin by 9 and 15 per cent,Footnote 5 respectively, whereas pesticide use declines by 21.7 per cent. Comparing the findings of the present study with other studies conducted in India and Pakistan, we find that the yield effect of Bt cotton seed is lower than the estimate of Crost et al. (Reference Crost, Shankar, Bennett and Morse2007) in India. Our yield estimate is also lower than those of Nazli (Reference Nazli2010) and Ali and Abdulai (Reference Ali and Abdulai2010) in Pakistan. Our findings relating to pesticide use are also different from other studies from Pakistan, as the reduction in pesticide use in the present study is higher than those of Nazli (Reference Nazli2010) and Ali and Abdulai (Reference Ali and Abdulai2010). Although Nazli (Reference Nazli2010) and Ali and Abdulai (Reference Ali and Abdulai2010) used the propensity score matching method to control for endogeneity, results of reduction in pesticide use in these two studies are substantially different. The reason may be that the propensity score matching method does not control for endogeneity due to unobservable and observable characteristics. However, the panel models employed in our study give consistent and unbiased estimates of Bt cotton seed. Bt cotton has three important advantages over non-Bt cotton in the form of declining pesticide use, an increase in the yield and higher gross margins. However, we note that long-term adverse impacts of Bt cotton use, including increased use of irrigation water, biodiversity loss, genetic pollution, possible effects on land fertility, etc. are not addressed in the present study.
5. Conclusions and suggestions
Cotton is an important cash crop and makes a significant contribution to the economy of Pakistan. Raw cotton and cotton-related products account for around 60 per cent of foreign exchange earnings. However, with the passage of time, Pakistani cotton growers have experienced significant increases in the costs of production and stagnating yields. Pesticides are the major contributor to the costs of production. Huge amounts of pesticide are imported and also domestically produced in the country. Thus, Bt cotton offers a solution in that this technology has a natural resistance against the main cotton pest, bollworms. After many years of discussion, the Pakistan Government approved commercial use of Bt cotton from the cotton cropping season of 2010.
Our study seeks to examine the economic performance of Bt cotton in the Punjab province of Pakistan and to assess whether use of this new technology offers benefits both in terms of increased profits and reduced pesticide use. Our analysis builds on data from two cropping seasons, 2008 and 2009, from three districts in Punjab.
Our findings suggest that the average farmer growing Bt cotton is likely to have a higher income relative to a farmer using non-Bt seeds. On average, the return (gross margin) to Bt cotton use was PKR53249 (US$626) per ha vs. a return of PKR41833 (US$492) for non-Bt cotton. This represents an average increase of per-ha yield of 9 per cent and per-ha profits of 15 per cent for farmers growing Bt cotton. The higher returns from Bt cotton are mainly attributable to the reduction in pesticide costs. On average, Bt farmers use 21.7 per cent less pesticide per ha relative to non-Bt farmers.
Statistical analyses also show that the use of Bt cotton seed increases cotton yield and short-run profit. Bt farmers decrease their pesticide use, contributing to both higher private returns and public benefits in terms of reduced environmental pollution. In terms of other inputs, Bt cotton increases labor costs and irrigation water use. The increase in irrigation water use is a reason for concern, given the huge demand for water in Pakistan's agriculture.
Farmers clearly recognize the benefits of Bt cotton. Since the collection of data for this study, the use of Bt cotton in Punjab has further increased and now dominates cotton production. However, market supply currently cannot meet this huge demand and growers face problems of non-availability of quality Bt cotton seeds. Thus, there is an urgent need to ensure the availability of a high-quality supply of seeds – this is particularly important for small farmers who are vulnerable to any form of financial risk.
There are legitimate concerns about what the implications of GM technologies may mean for maintaining the gene pool of different crop varieties and worries about gene pollution. Addressing these issues is beyond the scope of our paper. Our paper is able to clarify why such public worries can get overshadowed, given the significant private returns to farmers from using Bt cotton.



