

This paper follows the history of an object that has been important for research and instrument development in the field of surface science. The object in question is the silicon (111) 7×7 (the 7×7 for short), a particular surface configuration (or, as it is often called, a ‘reconstruction’) of silicon atoms. Surface science has become a significant research programme in the electronics industry as well as in subfields of physics, chemistry, materials science and electrical engineering, and is one of an array of scientific and engineering specialities associated with the broader nanoscience/nanotechnology movement.Footnote 1
Surface scientists use scanning probe microscopes and other instruments to visualize and manipulate atomic and molecular configurations at the surfaces of selected materials. Research on, or with, the 7×7 over several decades has been closely bound up with the development of novel instruments and the visualization of atomic structures. Most famously, the 7×7 had a significant role in the success of the scanning tunnelling microscope (STM), for which Gerd Binnig and Heinrich Rohrer won the 1986 Nobel Prize in physics.Footnote 2 The STM is sometimes (erroneously) credited with being the first microscope to produce images of single atoms.Footnote 3 What is true is that the STM was the first microscope to produce images of the particular single atoms of the 7×7 – through which the new instrument tapped into a ready-made and enthusiastic audience of surface scientists.
Although much of the research on the Si(111) 7×7 was motivated by the promise of developing useful and profitable technologies for the electronics industry, such research was at least one step removed from any immediate context of application such as building integrated circuits. The greater attraction of the 7×7 to surface scientists was not commercial applicability, but rather the ability of this material object to be exploited for different experimental purposes on different occasions. The 7×7 was valued because, in Rumsfeldian terms, it was sometimes a ‘known known’ (a material standard for testing particular instruments, harmonizing images produced with different techniques, and training human observers) and sometimes a ‘known unknown’ (an unsolved problem, akin to a long-standing unsolved proof for mathematicians).Footnote 4
In these dual roles, the 7×7 became a basis for establishing surface science as a distinct field and research community. The 7×7 has been a problematic research object as well as an instrumental resource; a site of discovering work as well as a well-defined object with which to assess other, more novel, things. In this paper, we treat the 7×7 as an example of a class of experimental artefacts we call ‘test objects’ – objects that can be used both to test the experiment and/or experimenter and to generate new knowledge.
Our ‘test objects’ complement, but also complicate, Hans-Jörg Rheinberger's analysis of ‘experimental systems’ (material arrangements that generate extended lines of experiment). Rheinberger distinguishes experimental systems into two intimately associated elements: technical objects and epistemic things.Footnote 5 He maintains this distinction in the face of the tendency in science and technology studies (STS) to entirely collapse science and technology into a unitary concept of ‘technoscience’. In his view, such indiscriminate concepts ‘disguise the essential tension of the research process’.Footnote 6 Experimental systems, as he defines them, are open to surprises – indeed, they facilitate surprises in the very way they create highly circumscribed spaces for experimentation and observation. Epistemic things are the unknown, or vaguely known, objects of investigation that are the counterparts of experimental conditions (the technical objects). They do not simply yield in docile fashion to the technologies of investigation.
The present paper respects the clarity of Rheinberger's distinction with its emphasis on objects that enable disclosure. However, we see the 7×7 as shifting back and forth over time and in different research contexts between being a problematic object of investigation (an epistemic thing) and a standard matrix with which investigation is performed, calibrated or tested (a technical object). Like a microscope, test tube or other piece of apparatus, the 7×7 was a made thing. Over time, post-war surface scientists learned how – or thought they learned how – to indirectly arrange the silicon atoms of the 7×7 with near-Platonic precision, using careful combinations of temperature, pressure and other parameters.Footnote 7 Indeed, the ability to make the 7×7 was one test that qualified a novice to become a semiconductor surface science experimentalist. Yet like Rheinberger's epistemic things, the 7×7 was a material system that surface scientists continually returned to in the hope of being surprised.
Thus, like Rheinberger, we locate our work alongside other ‘biographies of objects’ and ‘histories of things’ in science studies. Historians and ethnographers of science and technology have become accustomed to writing histories of things to supplement or in some cases challenge histories of persons, research groups, disciplines and ideas. Histories of things are especially prominent in studies of the construction of, for example, novel molecules, experimental protocols, material standards, technological prototypes, molecular models and architectural designs.Footnote 8 Of particular interest for this paper is the family of objects whose members have an ontological status that confounds the familiar distinction between conditions of observation and objects of reference. The members of this family are diverse, including such things as model organisms, cell lines, type specimens, material standards, natural laboratories and prototypes.Footnote 9 Though difficult to subsume under a single concept, these research objects are material things, sometimes living or quasi-living entities, which function as ideal types, proxies, representative specimens (and representations of specimens), vectors or entire environments within which to conduct investigations. They cover a range of intermediate positions between the found and the made, the concrete and the abstract, and the empirical and the ideal. They are not readily compartmentalized as natural objects, engineered things, representational devices or ready-to-hand instruments, though such terms, and the distinctions between them, can be salient for describing particular uses and moments of use.
A biography of the 7×7 is especially useful as a tool for mapping a series of influential research communities. The 7×7 began life in the late 1950s as one of the seeds around which the surface science community precipitated from the larger subdisciplines of electron physics and solid-state physics. With the 7×7 as their shibboleth, yardstick and epistemic thing, surface scientists could recognize each other as members of a body of practitioners requiring their own methods, tools, career paths and institutions. Until the 1980s, the 7×7 continued in this vein as a test object associated with only one research community – something that interested surface scientists but almost no one else. In that decade, though, the 7×7 became a test object of interest to a new community of probe microscopists – a group that included some surface scientists but also many who were ambivalent about, and sometimes even antagonistic towards, surface science. The latter group tried to find their own test objects, even as they tried to pull probe microscopy away from surface science. We will conclude by examining the mixed results of their coproduction of community and test object.
Test objects and operative images
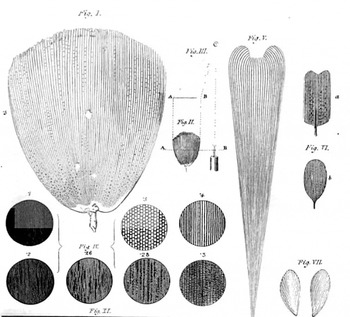
We take the term ‘test object’ from the history of microscopy. In the 1820s, microscopist Charles R. Goring gave that name to a collection of calibrating objects with regular properties, such as insect wings, arrays of regular cells, and diatoms, which he used to test the resolution and power of his instruments (Figure 1).Footnote 10 When viewed with a microscope, the appearance of these test objects could show a microscopist if, or how well, the instrumentation was working. Dr Goring selected these things for their regular, geometric form, much in the way a surveyor uses geometric tools to measure distances, reckon ‘true’ lines and superimpose grids onto a landscape, but in this case he used the test objects to survey the instrumental system through which their microscopic properties were made visible. (The analogy would be with a surveyor who uses an exquisitely regular object to test the alignment and accuracy of the survey instruments.) Goring's test objects thus were material things that had reflexive implications for the research that made their details visible.
Dr Goring's ‘test objects’. From C.R. Goring and Andrew Pritchard, Micrographia: Containing Practical Essays on Reflecting, Solar, Oxy-hydrogen Gas Microscopes; Micrometers; Eye-Pieces, etc., etc., London: Whattaker and Co., 1837, p. 233.

Later in the century, fine lines, gratings and rulers etched into glass were deployed. These were manufactured inscriptions rather than properties of found objects, and assuming their reliable manufacture they had the advantage of being set up for the express purpose of testing the instrumentarium.Footnote 11 One such innovation, by F.A. Nobert, was described as follows:
M. Nobert, of Griefswald, having occupied himself for some years in the manufacture and testing of a large compound microscope, discovered that the productions of nature, which had been almost exclusively used as test object, were more or less different in the nature and arrangement of their markings; hence he was led to the employment of such objects for comparison as can be reduced to number and measurement, as modern philosophy requires in all its branches. The plan adopted by M. Nobert, is to etch on glass ten separate bands at equal distances; each band is composed of parallel lines of some known fraction of the old Paris line; in the first band they are 1/4000, and in the last 1/10000 of the same quantity, whilst the intermediate groups with regard to the distance of their parallel lines form parts of a geometric series …Footnote 12
These test objects not only were designed to surpass the regularity of Goring's found objects, they also incorporated scales that were integrated with an international metrological system. Consequently they would seem to be especially clear instances of, in Rheinberger's terms, technical objects included in the conditions of experiment or observation.Footnote 13 Both Goring's found objects and Nobert's etched artefacts exhibited geometric arrangements that functioned as ‘test patterns’, which were uninteresting in themselves and designed to check and calibrate the imaging technology. We can add that these test objects also made up preconditions of observation, in so far as they were used to test or calibrate observational instruments and train practitioners before ‘real’ observation began.
What makes test objects noteworthy, though, is that they can undergo remarkable shifts and become ‘interesting’ in themselves. Moreover, just what a test object is, and just what it is a test of, can change dramatically over time. For example, in addition to being reference standards for testing nineteenth-century optical microscopes, Nobert's etchings also were used as diffraction gratings for observing and measuring optical phenomena. Like the later 7×7, the etchings were both technical objects and epistemic things, as Rheinberger defines them: material entities whose in-depth configurations are open to surprise, elaboration and further exploration.
A further property of Nobert's test objects is implicit in their construction: the etched lines display a state-of-the-art ability to inscribe materials with increasing precision at ever-finer levels of scale. This trend of increasing virtuosity in making fine structures both for and as an outcome of experimentation has continued right into the present. It is for this reason that we find test objects to be a powerful concept for understanding nanotechnology – an enterprise in which the difference between technical objects and epistemic things has perhaps collapsed.Footnote 14 The means of precision have changed somewhat. Where Nobert had mechanically etched his test objects, a century later microfabrication specialists would learn to carve structures with nearly atomic precision using photolithography (i.e. shining light through a stencil or ‘mask’ onto a photosensitive ‘resist’, then etching the resist with acid to transfer a demagnified image of the mask into the resist and the crystalline substrate on which it rests). Even smaller structures can today be carved into materials with ion and electron beams or with the tiny probes found in scanning tunnelling microscopes and atomic force microscopes (though none of these techniques is so far as commercially successful as photolithography).
Starting in the late twentieth century, a substantial amount of microelectronics research and engineering used techniques of mechanical reproduction to inscribe fine-grained ‘images’ into (or onto) material surfaces. These ‘images’ were not representations, reference standards or measuring devices; instead, they were functioning technologies. As Norbert Wiener suggested in reference to printed circuits,
An electric circuit may fulfill a relatively complicated function, and its image, as reproduced by a printing press using metallic inks, may itself function as the circuit it represents … Thus, besides pictorial images, we may have operative images. These operative images, which perform the functions of their original, may or may not bear a pictorial likeness to it.Footnote 15
In this case, the conceptual difference between object and image (or original and copy) can completely collapse. Wiener's language is somewhat confusing, however. A copy of the printed circuit does not represent an original circuit; it is a functioning circuit. A particular instance of a printed circuit is a ‘re-presentation’ in the sense that it reproduces or replicates a functional artefact. A printed circuit also is not an ‘image’ of an electrical circuit, just as a copy of a manuscript usually is not viewed as an ‘image’ of the original text, though under some circumstances it may become significant as a poor reproduction, unauthorized copy or rare survivor from an original print run.Footnote 16 Wiener's use of the word ‘image’ lends mystique to what might otherwise be viewed as a manufactured object.
In the decades after Wiener wrote about printed circuits, etching and lithography became the dominant means for inscribing electrical circuits onto material surfaces at ever-finer levels of scale. Selectively burning silicon wafers with lasers and electron beams rather than printing with conducting ink is the medium through which chips are made, but the idea of operative images applies to them at least as well as it does to printed circuits.Footnote 17
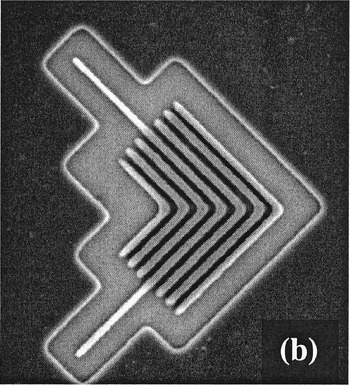
Among device physicists and electrical engineers, the ability to photochemically carve out tiny features is both a prerequisite for research and a skill to be displayed on its own merits. Indeed, specialists in ‘microfabrication’ will often make (and publish images of) inscribed devicesFootnote 18 that are test objects rather than operative images in the sense that they cannot function as devices, but are credible tests of a new fabrication technique (see Figure 2). Though abstracted from functional devices, they are material displays of craft performed at ever-finer levels of scale and resolution on a chip-like matrix. The visible, material properties of these particular non-functional objects are arranged to display the virtuosity of the techniques that manufactured them. In a sense, they are like the sculpted objects made by medieval artisans to display their craftsmanship, only here the aim is to display potential utility for industry. Although they are not functional components of circuitry, they are designed to make transparent certain advantages that can be implemented in actual or potential transistors.
Non-functional microfabricated patterns, designed to demonstrate an extreme ultraviolet lithography technique's ability to etch features (potentially for commercial use) as small as 70 nm or even smaller. From Patrick P. Naulleau et al., ‘Fourier-synthesis custom-coherence illuminator for extreme ultraviolet microfield lithography’, Applied Optics (2003) 42, pp. 820–826, p. 823.

In the argot of nanotechnology, etching is a form of ‘top-down’ assembly: it is an imposition of structural design upon the surface in question. This contrasts to ‘bottom-up’ or ‘self-assembly’, in which atomic and molecular components organize themselves into structures.Footnote 19 Structures that emerge through bottom-up fabrication are neither ‘found’ (as in Dr Goring's striations) nor ‘made’ (in the sense of being deliberately etched), but are enabled or cultivated through laboratory techniques akin to those used in chemistry and molecular biology. Some of these objects exhibit the reliable and regular form that enables them to be used as tests of skill or instrumentation, even as their exact configuration may remain enough of a mystery to afford surprise. This is the sense of ‘test object’ on which we will focus, with the 7×7 as our case study.
Reconstructions and the Si(111) 7×7
The ‘name’ Si(111) 7×7 refers to a surface configuration of atoms in a silicon crystal. It is an unusual sort of object with properties that can be said to be empirical, mathematical and practical (induced through manufacture). Standard descriptions and tutorials seem unbothered by the fact that the 7×7 is essentially a conjunction of natural and artificial properties; instead, they freely deploy diagrammatic and notational conventions, as well as references to standard modes of material preparation, to make sense of the object.Footnote 20 So, for example, the notation (111) is a conventional reference to the perspective provided by a plane ‘sliced through’ a three-dimensional figure that represents a ‘unit cell’ – the minimal repeating unit in a regular structure.
For a given crystal, three characteristic vectors (of given length and direction) point from an arbitrary corner atom of the unit cell to three other corner atoms, such that the vectors are orthogonal. A set of ‘Miller indices’ then describe different ways of slicing through the unit cell. In surface science, this notation describes the plane of the bulk crystal material that is exposed when it is ‘cleaved’ open. The numbers in the Miller index refer to how far (in number of characteristic vectors) away from the origin of the unit cell the cleaving plane will encounter another corner atom. In ‘high-index’ surfaces the cleaving plane may be at a very shallow angle to one wall of the unit cell, such that it encounters a corner atom very quickly in one direction but will go many vector lengths before it does so in the orthogonal direction – such a material will have a cleave plane of, say, (5 5 12) or (11 5 2). High-index surfaces are of interest today for producing periodic nanostructures, but in the period covered by this paper surface scientists were much more interested in very flat, ‘low-index’ samples. In these, the Miller indices possible within a single unit cell sufficed – the (100), the (010), the (111) and so on. The 7×7 was a phenomenon only seen in the (111) surface, in which the diamond cubic unit cell of bulk silicon is cut by a plane that bisects the three faces of the cube that touch the unit cell's origin.
When a crystal is cleaved to reveal a new surface, the atoms in the top few layers are affected by the sudden absence of further layers above them. In metals, this leads to a very slight (if any) rearrangement of the surface atoms – the notation of the crystalline plane is usually more or less sufficient to indicate what the surface looks like. In semiconductors, however, cleaving leaves a number of dangling bonds which are energetically unfavourable. The atoms of the surface layers may therefore rearrange themselves – ‘reconstruct’ – into a more stable configuration. Some reconstructions happen with little input from the experimentalist; for others, surface scientists have a battery of techniques and tacit knowledge with which to induce particular reconstructions.
Notationally, surface scientists imagine the cleaved crystal as initially having an atomic configuration that is unchanged from the bulk (except for the lack of further layers above it). That imaginary configuration has a ‘surface unit cell’ – the minimal repeating unit in two dimensions. When the surface reconstructs, a new (usually larger) unit cell emerges which is a transformation of the original. Thus the notation for the reconstructed unit cell indicates how many times the original unit cell must be repeated along each of its characteristic vectors in order to equal the size of the reconstructed surface unit cell. Thus a ‘2×1’ reconstruction is twice the length of the original surface unit cell along one of its characteristic vectors, and the same length as the original along the other vector. The 7×7 is seven times the length of the original surface unit cell along each vector, making its area forty-nine times larger than its primitive surface unit cell. Thus it is one of the largest, and most complex, reconstructions – an important factor in its emergence as a test object.
The relationship between the reconstructed unit cell and the primitive unit cell is, for many surface scientists, most easily understood using ‘cork-ball’ or ‘ball-and-stick’ models (either three-dimensional models made from kits or improvised materials, or two-dimensional representations of such models).Footnote 21 Indeed, the first thing one sees on entering a surface scientist's office is often a three-dimensional model of some notable reconstruction. In published articles, reconstructions are depicted as abstract versions of such cork-ball models, usually shown from the side or from above rather than in perspective. One advantage of such depictions is that the ‘surface’ can in fact be seen as a region several atomic layers deep, a region picturesquely known as the ‘selvedge’. (Imagine a rack of billiard balls, with a second layer stacked on top of it; balls on the top layer settle into ‘holes’ between balls in the lower one.)
It should, perhaps, go without saying that the cork-ball models are much simpler and more regular, and contain fewer ‘defects’ (contaminants, ‘dislocations’ and so on), than any actual surface viewed with a microscope or spectrometer. Yet surface scientists work very hard to create conditions that enable the sample they are characterizing to resemble the pristine cork-ball model (rather than simply the other way round). This usually is referred to as creating a ‘well-defined’ surface. The key technology for making surfaces well defined is the ultrahigh vacuum (UHV) chamber, capable of creating a void as empty as interplanetary space. This descendant of Boyle's air-pumpFootnote 22 can preserve reconstructions such as the 7×7 for months, even years – reconstructions that would either not appear in the open air or would last only minutes. Indeed, as we will explain, in the 1950s surface scientists first defined themselves as a distinct community by their expertise in the ultrahigh vacuum technology that allowed reconstructions to be observed as a surface phenomenon.
In order to define their community in this way, though, surface scientists needed a suite of instruments that would make reconstructions visible. The most important of these was the low-energy electron diffractometer (LEED), an instrument that shoots very low-energy electrons at a surface at an oblique angle, then scoops up the electrons at the other end after they have ‘scattered’ through the obstacle course of atoms in the selvedge. LEED, UHV, and surface reconstructions bootstrapped one another in the 1950s and 1960s. Better UHV technology produced cleaner, longer-lasting reconstructions that showed up as sharper LEED images in which different reconstructions could more easily be discriminated. This, in turn, allowed surface scientists to understand how to tune various sample preparation techniques (annealing, sputtering, cleaving and so on) inside the UHV chamber so as to produce specific reconstructions for further study.
The study of reconstructions therefore became the central problem for semiconductor surface scientists (less so for those interested in metals). Specific reconstructions could easily be made visible with LEED; this then allowed experimenters to use LEED to improve and vary sample preparation techniques so as to generate a suite of reconstructions. Moreover, in the 1970s new families of surface science instruments – especially various spectroscopies – came into being. These could be calibrated by studying known reconstructions – ‘known’ largely through their LEED images. As these new spectroscopies gained acceptance, therefore, surface scientists continually referenced their results back to LEED data on reconstructions.
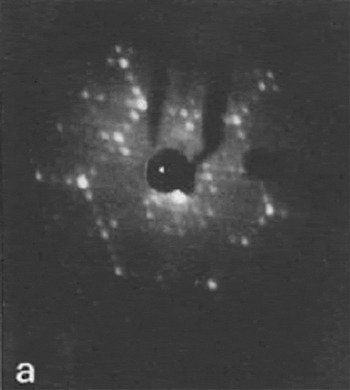
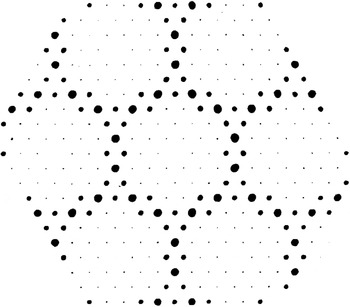
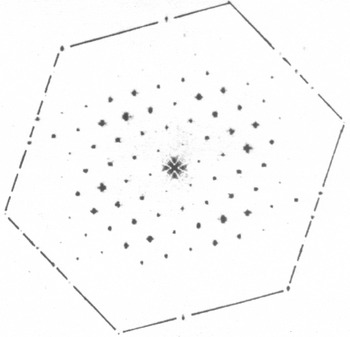
One upshot of this was that an increasingly prestigious research problem, from the late 1960s to the early 1980s, was the deciphering of the locations of the atoms within various reconstructions. The problem for surface scientists, though, was that LEED gives only indirect and indeterminate information about where atoms are located (see Figure 3). LEED images are in so-called ‘inverse space’ or ‘reciprocal space’.Footnote 23 That is, the locations of features in a LEED image do not correspond to the locations of features on a surface, but rather to the frequency with which certain features recur on that surface. Converting that frequency information into a real-space representation is difficult because the electrons interact with many different atoms, in several atomic layers, as they fly along the selvedge.
LEED image of the 7×7, in inverse space. Reprinted from M. Nishijima et al., ‘Reactions of NO with the Si(111) (7×7) surface: EELS, LEED, and AES studies’, Surface Science (1984) 137, pp. 473–490, p. 478, copyright (1984) with permission of Elsevier.

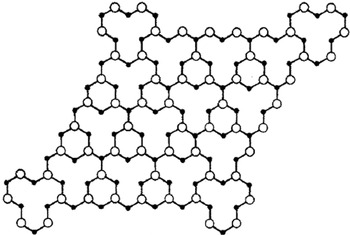
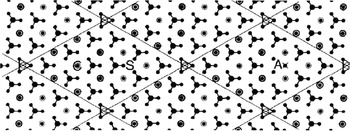
The standard approach to a reconstruction, therefore, was to elicit a ‘model’ from LEED and other data. These models were what might be called quasi-empirical renderings (see Figures 4 and 5). As we describe later, from the 1960s and through the 1980s, numerous models – which could be called ‘reconstructions of a reconstruction’ – were offered to explain the atomic arrangement of the 7×7 made visible through a series of instruments.
The topmost atoms of the Lander vacancy model of the 7×7, based on an interpretation of LEED images like the one in Figure 3. Reprinted with permission from J.J. Lander and J. Morrison, ‘Structures of clean surfaces of silicon and germanium’, Journal of Applied Physics (1963) 34, pp. 1403–1410, p. 1410, copyright (1963), American Institute of Physics.

Simulated LEED pattern, in inverse space, backed out of the real-space model in Figure 4, meant for comparison with experimental LEED pattern of the type seen in Figure 3. Reprinted with permission from D.J. Miller and D. Haneman, ‘LEED analysis and energy minimization calculations for Si(111) (7×7) surface structures’, Journal of Vacuum Science and Technology (1979) 16, pp. 1270–1285, p. 1276, copyright (1979), American Institute of Physics.

A brief history of the 7×7
Like many other test objects, the Si(111) 7×7 has undergone epistemic shifts throughout its decades-long history. It dates back to the 1950s, when it was one of the first surface reconstructions to be recognized from LEED data at a time when surface science was just beginning to coalesce and surface reconstructions were novel phenomena. Although other reconstructions also were available, the 7×7 held particular attraction because its surface configuration was (relatively speaking) unusually large, highly regular, easily prepared and readily recognized from LEED. Because of these features, its appearance provided researchers with a reference point for noticing when their instruments needed adjustment or their materials had become contaminated.
However, the 7×7 was no simple pattern. It has been described as ‘one of the most, if not the most, complicated surface structure in existence’.Footnote 24 Consequently, for much of its history, the Si(111) 7×7 also was a research object that presented a sustained challenge for teasing out its atomic configuration with spectroscopy, diffractometry and probe microscopy. Information from these instruments would then be used to update any of a dozen competing models of its atomic structure, or to inform a completely new model. Consequently, the relation between instrument and test object was more of a bootstrapping operation in which each was used to elaborate and establish the other.Footnote 25
From electron physics to surface science
As the term suggests, surface science is the study of material surfaces, but it is the study of very specific kinds of surface under highly delimited conditions. To use Andrew Abbott's terminology,Footnote 26 throughout its history, state-of-the-art surface science included only a few ‘jurisdictions’ – regions of professional activity – associated especially with applications of interest to prominent corporate and national labs. Most of the researchers who founded surface science as a separate discipline in the early 1960s came from electron physics, and they brought with them orientations and institutional affiliations characteristic of that field.Footnote 27 In particular, they came from a branch of electron physics that simultaneously studied both the behaviour of electrons and the characteristics of the materials that emitted or conducted electrons. That is, they constructed experiments in which a material system (say, a sharpened tungsten emitter) could be used both as a technical object (for emitting electrons) and as an epistemic thing (in which the characteristics of the emitted electrons would indicate something about the structure of the emitter).Footnote 28 In this kind of electron physics, the difference between technical object and epistemic thing did not necessarily collapse, but the same objects would repeatedly turn up in either category.
One feature of this kind of electron physics that would translate to surface science was the extent to which its practitioners were housed in corporate laboratories. As an indication of this, we note that a large number of Nobel laureates recognized for major twentieth-century breakthroughs on electron diffraction, electron tunnelling and electro-chemistry were working in corporate labs when they made their most important discoveries. These include Irving Langmuir and Ivar Giaever at General Electric; Clinton Davisson, Walter Brattain, John Bardeen, William Shockley, Philip Anderson, Arthur Schawlow and Horst Störmer at Bell Labs; Leo Esaki, Gerd Binnig, Heinrich Rohrer, Georg Bednorz and Karl Müller at IBM; Ernst Ruska at Siemens; and Jack Kilby at Texas Instruments. Perhaps there has never been such a strong concentration of Nobel laureates in a particular field working within corporate confines as there was for electron physics.
The relationship between commercial conditions and fundamental research in electron physics was no accident. Tungsten emitters sealed in evacuated glass envelopes were the mainstay of electron physics well into the 1960s, and such apparatus was a close cousin to the light bulbs, vacuum tubes and display screens that were so commercially important for companies like GE, AT&T and RCA.Footnote 29 Though researchers worked with experimental apparatus that was clearly associated with potential commercial applications, they cleaned up their tubes and emitters in ways that disconnected them from their technological roots – most notably through an almost fetishistic control of the vacuum in the glass envelope. Vacuum became an environment and object for ‘pure’ research, in a literal sense, and electron physicists allied with, or themselves became, world experts in high-vacuum technology – developing the gauges, pumps and metal chambers that superseded hand-blown glass envelopes and led to ultrahigh vacuum.Footnote 30
By the late 1950s and early 1960s, some practitioners of this branch of electron physics became interested in manipulating electrons as a means for researching the surfaces of materials. In part, this interest in surfaces had always been present – Langmuir, for example, won his Nobel for work in surface chemistry. The invention of the transistor in 1947, however, simultaneously elicited the first clear articulation of a theory of surface states (by Shockley and Bardeen) and a powerful commercial and experimental incentive for a better understanding of surfaces.Footnote 31 If the development of UHV and LEED provided the means for surface science to emerge from electron physics, the transistor provided an important motive.
Means and motive are nothing without opportunity, though. In the case of surface science, opportunity came in the form of a series of institutional openings from the early 1960s to the mid-1970s. One opening was the virtual takeover of the American Vacuum Society (AVS) and its journal, the Journal of Vacuum Science and Technology, by leading surface scientists.Footnote 32 This gave the nascent community an institutional backbone by providing outlets for publication and presentation, credentialling through membership in the AVS, education through a series of AVS short courses in surface science topics, recognition through AVS prizes, and so on. Among surface scientists working on metals, other institutional openings came in the form of new modes of employment (especially at the National Bureau of Standards in the US) and new sources of funding.Footnote 33 Funding for surface science of metals in this period was often closely aligned with large-scale national projects. For instance, NASA funded many surface scientists because of its interest in the effect of vacuum conditions on metals. In the 1970s much research was funded on the catalytic properties of metal surfaces (such as the ubiquitous experimental system/test object of carbon monoxide adsorbed on nickel) as part of heightened national interest in environmental and alternative energy research.Footnote 34
Surface science research on semiconductors, on the other hand, aligned more closely with commercial projects – or, more accurately, with the professional interests of surface scientists housed in corporate research labs. Even though semiconductor surface science focused on materials like silicon and gallium arsenide that were integral to the microelectronics products of companies such as AT&T and IBM, research by surface scientists employed by those companies only intermittently fed directly into those products. Instead, the research indirectly paid off by producing test objects that were used for training the people and the instruments that were used to make and understand them.Footnote 35 Researchers at places like Bell Labs could hone their skills with specialized research materials and equipment before moving on to work on projects that involved similar types of material and equipment that were closer to the production line.
Before the end of the Cold War, companies like AT&T and IBM received hefty tax incentives for fundamental research that did not connect directly to their product lines.Footnote 36 Until the late 1980s, therefore, corporate surface scientists were relatively unbothered that the most professionally prestigious problem areas in their field were not the most commercially applicable ones. Ambitious surface scientists moved ever further away from industrial products like the transistor or the laser, and towards materials and apparatus that were abstracted from immediate, or even foreseeable, commercial applications.Footnote 37 Researchers focused on semiconductor materials themselves, rather than on the semiconductor-oxide combinations used in actual logic elements. They placed semiconductor samples in ultrahigh vacuum in order to maintain cleanliness, even though almost all of the products their companies would make would have to survive in air. Researchers tinkered with samples in arcane ways to make them ‘well-defined’; that is, more closely resembling the materials that current theories and models could tractably handle.
Among semiconductor surface scientists, this Cold War logic of corporate research encouraged surface reconstructions to emerge as the most prestigious problem of the 1970s and early 1980s. Reconstructions were easily recognizable, but not explicable, with LEED. This meant that an excellent test of a young experimentalist, particularly a postdoc at IBM Yorktown or Bell Labs, was to build a new surface science instrument, calibrate and coordinate it with LEED, and contribute some new datum about a reconstruction to winnow down the number of viable models of its atomic structure. Because the data from all these instruments were so indeterminate (and occasionally contradictory), an excellent test for a young theorist was to build a new model of a reconstruction based on all the available instrumental output.
Within this problem area, certain reconstructions rapidly became privileged. The silicon (111) 7×7 was one of these reconstructions, and it soon topped the list for quite telling reasons – some aesthetic, some commercial, some cultural and some practical. To be sure, silicon was a commercially important material for the companies employing surface scientists, but the (111) 7×7 reconstruction was not a technologically important surface. Almost all integrated circuits are made with the (100) surface (for reasons having to do with precision of etching). Consequently, we need to consider other attractions of the 7×7 besides commercial importance.
One oft-cited reason for the 7×7's popularity is that its LEED pattern is extraordinarily complex, even beautiful; more so than almost any other diffraction pattern.Footnote 38 Many accounts testify that this reconstruction is much larger and more complicated (and its solution therefore more satisfying and rewarding) than any other. Another reason that is often given is that the 7×7 is relatively easy for surface scientists to prepare: the (111) is the natural cleavage plane of silicon, so a wafer just needs to be broken to reveal it, and the 7×7 emerges with some simple baking. However, it is important to note that later events showed that the 7×7 could be very difficult for non-surface scientists to prepare. Preparing the reconstruction was a useful exercise for training surface scientists and discriminating them from pretenders. In that sense, the 7×7 was a test object for demarcating membership and initiating novices in a nascent field. The 7×7 also was useful for ‘training’ new kinds of equipment, because the LEED pattern was so distinctive, and its preparation so easy for the initiated, that they could make it (and know they had made it) quickly before putting it into a new kind of diffractometer, microscope or spectrometer, thus making interpretation less disputable. For similar reasons, it served as a whetstone for new theoretical concepts, because the reconstruction was so complicated that theorists surmised that it must combine most of the phenomena that they would need to explain simpler reconstructions.Footnote 39 Thus advances could be made piecemeal and over long periods of time, with no one ever getting closer to solving the whole thing.
New tools, new models
The first work on the 7×7 was centred at Brown University, under Robert Ellsworth Schlier and Harry E. Farnsworth, producing some of the first indications that semiconductors could undergo such radical reconstructions.Footnote 40 The locus very quickly shifted to Bell Labs, though, where the first serious suggestion of a structure for the 7×7 was advanced by J.J. Lander in 1962–3, and where Elizabeth Wood used the 7×7 to establish a ‘uniform vocabulary of surface crystallography’ in 1964.Footnote 41 Wood's vocabulary quickly became the standard, and the ‘Lander vacancy model’ (as it came to be known – see Figure 4) more or less dominated the problem area through the 1960s. But since the 7×7 was much too complicated to solve from the LEED data alone, throughout the decade no one was really interested in advancing alternative models. Instead, the field focused on more empirical questions: is the 7×7 caused by iron impurities?Footnote 42 Is there a quick transition from the 7×7 to other reconstructions of the (111) plane? During this period, the 7×7 served to sharpen the vast array of new surface science instruments that were appearing, the ‘alphabet soup’ of instrumental techniques that today's surface scientists are so proud of: mass spectrometry, infrared spectroscopy, electron paramagnetic resonance, field emission spectroscopy, ultraviolet and X-ray photoelectron spectroscopy, ion neutralization spectroscopy and electron energy loss spectroscopy.Footnote 43 Some instrument manufacturers – especially of LEED – even started to ship passivated samples of the 7×7 with their products, so that customers could turn on the instrument and instantly have the test object ready to make sure everything was working.Footnote 44
By 1973, then, there was enough empirical material to allow theorists to return to the problem and advance a new crop of solutions: variations on the vacancy model, triangular checkerboard models, defect models, planar chain models, close-packed overlayer models, optimized trimer models, buckled-surface models, rippled graphitic overlayer models and the unforgettable ‘milkstool’ model (see Figure 6).Footnote 45
The milkstool model of the 7×7. Reprinted from L.C. Snyder, ‘Modified milk-stool on wurtzite layer model for Si(111) 7×7 surface reconstruction’, Surface Science (1984) 140, pp. 101–107, p. 102, copyright (1984), with permission from Elsevier.

In this period, we see an interesting shift: while 7×7 theory remained centred on the corporate world, the number of corporate labs producing competitive models of the reconstruction shrank to just Bell Labs, IBM Yorktown (or IBM's other labs) and occasionally Xerox. Whereas earlier, in the late 1960s, companies like Zenith, United Aircraft and Ford shared the lead in surface science, by the 1970s they had fallen well behind IBM, Bell Labs and Xerox in the area of surface reconstruction research. Participants usually explain this development by pointing to the concentration of computer power at those three labs, and noting that the process of devising new reconstruction models was just at the edge of computing power for the period.Footnote 46 At Bell Labs, IBM and Xerox, theorists had routine access to on-site powerful computers to test and revise their models, and they flooded the surface science marketplace. Like chess-playing for AI researchers, the 7×7 became a test object of scientific computing – allowing researchers at the major corporate labs both to sharpen their skills and to show off their dominance in the field.
Like chess, the 7×7 exhibited sufficient depth and complexity to challenge (test) theorists to devise models to decipher its atomic structure. However, it was a problematic test object when used for testing the available models. At the time, LEED images and other data provided less than stable or determinate empirical grounds for testing those models. Instead, the models presented possible configurations with which to decipher LEED images and spectrographic data. Surface scientists look back to the 1970s as the field's period of maximum self-confidence. They cite the rise in computing power and the advent of a family of experimental techniques, the members of which were no longer new and unproven but also not yet mature and ‘involuted’.Footnote 47
This self-confidence gave new urgency to the 7×7 problem. If, as practitioners of the late 1970s and early 1980s believed, surface science was rapidly emerging from darkness into light, then the great questions that had bedevilled previous generations should soon be answered. The 7×7 was the unsolved problem, the thing that, if it could not be solved, would mean that surface scientists' confidence was misplaced and that their paradigm would have to give way. Semiconductor surface scientists began to pin their hopes on it. One of our interviewees described it as the ‘Rosetta Stone’ – a puzzle that, if solved, would provide the answer to all other puzzles in the field of semiconductor reconstructions.Footnote 48
Surface theorists began to obsess about it. One of our interviewees, a prominent experimentalist at IBM, recounts being so overwhelmed by the certainty that he was just at the edge of solving the reconstruction that, during one holiday, his loved ones had to hector him to momentarily stop playing with models of the 7×7 and come down to share Christmas dinner with them.Footnote 49 Around 1980 one increasingly finds published papers that begin with frustrated expressions of the 7×7's centrality and mystery: ‘The Si(111)-7×7 has created a substantial amount of interest since its discovery more than two decades ago [and] many structural models have been proposed. (refs 2–23)’, ‘The structure of the Si(111)-7×7 has long been a subject of speculation’, ‘The nature of the (7×7)-fold periodic reconstruction of the annealed Si(111) surface is a long-standing question of fundamental importance for semiconductor surface physics’, ‘The Si(111)-(7×7) surface is probably the most studied of the reconstructed surfaces of semiconductors’.Footnote 50 Such statements can be read as acknowledgement that, by 1980, the 7×7 had become a test not only for individual practitioners, instruments or theories, but also for the discipline as a whole.
Binnig and Rohrer, the 7×7 and the STM
The period between 1980 and 1986 was the 7×7's most famous era. It was central to the development and establishment of the scanning tunnelling microscope (STM) and became the iconic object for exhibiting ‘atomic resolution’ achieved with that instrument.Footnote 51 It also is credited with being responsible (or co-responsible, along with electron diffraction instruments) for ‘the first reasonably accurate structure model’ of the 7×7 – the dimer-adatom-stacking fault (DAS) model.Footnote 52
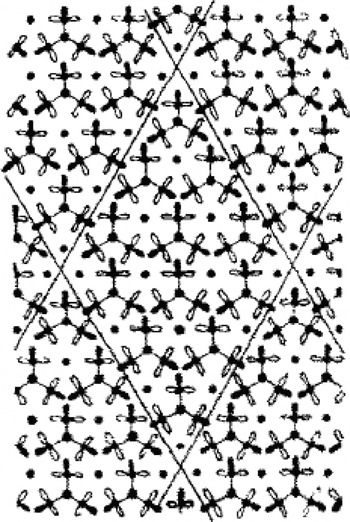
Although the STM is sometimes said to be the first instrument to image (or even to ‘see’Footnote 53) individual atoms, there are reasons to question both the meaning and the historical accuracy of that claim. The field ion microscope and the transmission electron microscope could both, under narrow sets of conditions, achieve atomic resolution decades before the STM.Footnote 54 The STM also has been credited with breaking the logjam of possible structural models of the 7×7, but that claim also needs to be qualified. In addition to the STM, two other experimental techniques – helium ion scattering, and transmission electron diffraction – stimulated a new round of developing and testing models of the 7×7 that ended with the acceptance of the DAS model. The STM was only one of – and certainly not the last in – a long line of instruments that were ‘tested’ on the shoals of the 7×7. Each of these instruments – the STM included – purported to narrow the range of acceptable models, and often (as with the STM) the experimental results generated with the novel instruments would be accompanied by new proposed structures for the 7×7. Yet in every case (the STM included), the proposed structures proved problematic. It was only when Kunio Takayanagi combined his own transmission electron diffraction data with clues from STM, LEED, ion scattering and other instruments that he could produce (and garner communal acceptance of) the DAS model (see Figure 7).Footnote 55
The dimer-adatom-stacking fault model of the 7×7 that was eventually accepted. Reprinted from K. Takayanagi, Y. Tanishiro, M. Takahashi and S. Takahashi, ‘Structural analysis of Si(111)−7×7 reconstructed surface by transmission electron diffraction’, Surface Science (1985) 164, pp. 367–392, p. 382, copyright (1985), with permission from Elsevier.

What makes both these claims (that the STM first imaged single atoms and that it solved the 7×7) plausible enough that they are frequently repeated is their juxtaposition. The STM was the first instrument to visualize the particular single atoms of the 7×7. Because the 7×7 was such a long-standing test object, thought to be a Rosetta Stone for other surface phenomena, STM images of the 7×7 were taken to be more generalizable than atomic-resolution images of other surfaces. Surface scientists interpreted other atomic-resolution instruments as too ‘constrained’ to be of interest, since they could not image the atoms of iconic test objects like the 7×7.Footnote 56 Even the STM initially suffered on this count. Where its inventors insist that they had achieved a noteworthy instance of atomic resolution (though of atomic rows, not single atoms) of a gold reconstruction prior to the 7×7, surface scientists ignored the STM (and still today dismiss that result) until the microscope proved its worth on their central test object.Footnote 57
When Binnig and Rohrer first started developing the tunnelling microscope in the IBM laboratory near Zurich, they were attempting to develop a measuring device for a project to build a supercomputer using superconducting Josephson junctions in place of semiconductor logic elements.Footnote 58 IBM officially abandoned the Josephson project in 1983, though most of the Zurich lab's contribution was being wound down in 1981, before the STM was functional. Consequently, Binnig and Rohrer had an instrument in search of a problem. To find suitable problems, they asked colleagues to suggest samples that would demonstrate the new technology's scientific importance. However, they also needed samples with known and regular properties that would show off the STM's distinctive powers and provide a metric of its capabilities.Footnote 59 One sample, for instance, was made by a crystal grower at IBM Zurich, and had ‘huge terraces or steps’ which could be viewed even with an optical microscope.Footnote 60 In the manner of Dr Goring's test objects, these regular and readily visible ‘atomic steps’ (the height of which was known from other instruments) would be a reference point for showing how well the instrument was working. Such regular structures provided a basis for identifying, naming, correcting for and even exploiting characteristic types of ‘accident’ that, as Binnig and Rohrer slowly realized, the STM could be prone to have – such as a ‘crashed tip’, ‘gunk on tip’ or ‘sudden reversal of contrast’.Footnote 61
Though Binnig and Rohrer devised ways to visualize the three-dimensional configuration of surfaces with the STM, ‘seeing’ with the device is more like running a stick across a surface, much as in Michael Polanyi's famous example of a blind person's probe.Footnote 62 However, the probe does not touch the surface; instead the tip picks up variations in the current of electrons ‘tunnelling’ to or from a (usually tungsten or platinum/iridium) tip suspended above a metal or semiconductor surface. These variations in tunnel current may or may not reflect an underlying topography: an area that looks ‘higher’ in an STM image may do so because, in fact, the surface is raised at that point, but it could just as easily be because of a change in the electronic structure of the sample at that point. Features of an STM image that look like ‘atoms’ may in fact roughly correspond to positions of atomic nuclei on the surface, but they can just as easily be mirages produced by the sample's electronic structure.
As noted earlier, the 7×7 already was the established ‘fruit fly’ in surface science,Footnote 63 and although Binnig and Rohrer initially were not members of the surface science community, the same properties of the object (its relative size, ease of preparation, regular structure and established use) also appealed to them as they worked out the design and operation of the new microscope. In addition, its status as a subject of competing structural models offered a challenging vehicle for testing and demonstrating the STM's potential. However, as novices to surface science (and, to some extent, sceptics of that community), Binnig and Rohrer initially had trouble mastering the basic task of making the 7×7. Only when an established IBM surface scientist visited their lab, and passed on the field's tacit knowledge or guild secrets, were they able to make samples with enough order that the STM could glimpse the 7×7.Footnote 64 However, Binnig and Rohrer's sample preparation practices remained looser than those of most surface scientists – for instance, they would prepare a sample in one chamber, then walk it down the hall (in air) to the STM chamber. They cite the fact that they could still obtain images as evidence that some of the surface scientists' guild secrets could be disregarded.Footnote 65
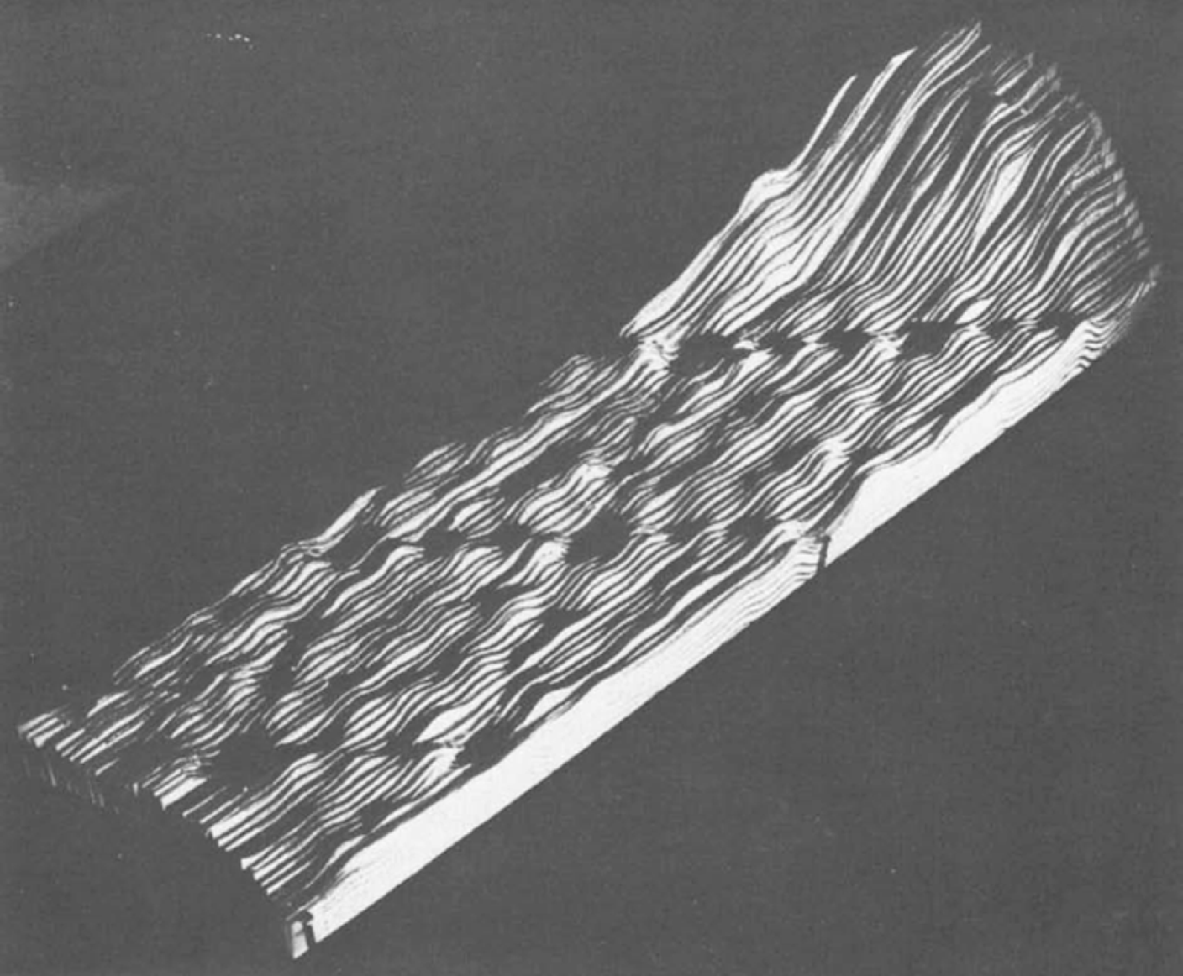
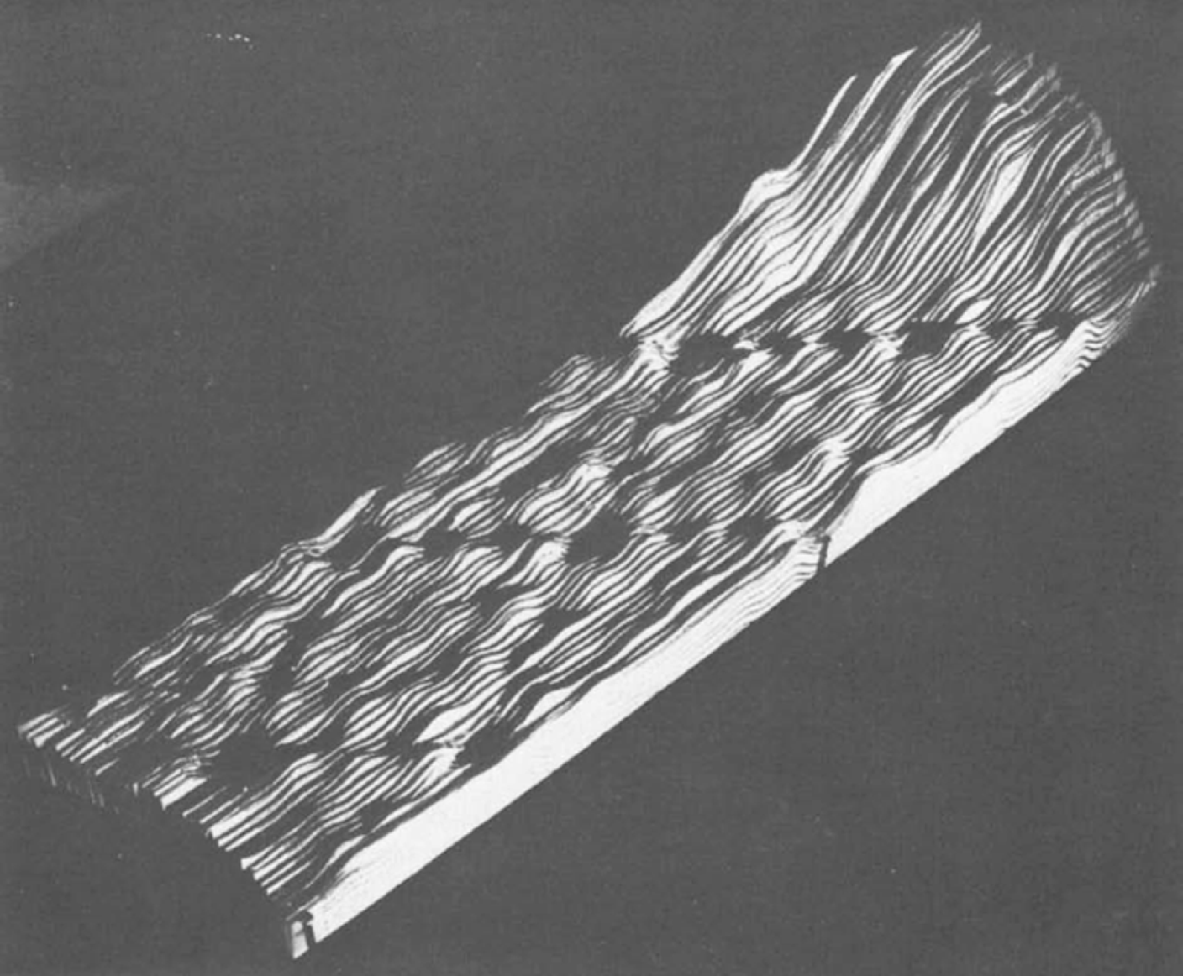
Binnig and Rohrer also reconstructed the 7×7 reconstruction in their own way. Not only did they do so with a novel instrument, they also built their image of the 7×7 in an idiosyncratic low-tech way, using analogue images on paper rather than digital images and simulations. Binnig and Rohrer proceeded by handing chart recorder traces recorded on a storage oscilloscope to one of their associates, who pasted each strip to a cardboard base, cutting along the lines to build a 3-D relief model.Footnote 66
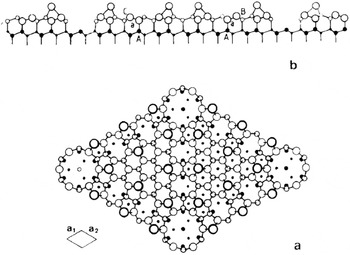
This ‘landscape’ image sculpted out of paper and cardboard (Figure 8) did not accord well with the ‘ball-and-stick’ models favoured by surface scientists. In addition, their published view of this landscape was from an angle, rather than the ‘map’ views from above that were conventional for surface science.Footnote 67 Thus, when they first exhibited their STM image publicly to surface scientists, Binnig and Rohrer also took pains to present a top view (see Figure 9). As they recounted, this exhibit attracted considerable excitement:
[After we] wrote the paper on the 7×7 … [w]e returned convinced that this would attract the attention of our colleagues, even those not involved with surface science. We helped by presenting both an unprocessed relief model assembled from the original recorder traces with scissors, Plexiglass and nails, and a processed top view; the former for credibility, the latter for analysis and discussion. It certainly did help, with the result that we practically stopped doing research for a while. We were inundated with requests for talks.Footnote 68
The initial reception among surface scientists was mixed. A few scientists even accused the Zurich team of trying to pass off computer simulations of the 7×7 as images obtained from a microscope (although the homely low-tech landscape model served to defuse such accusations).Footnote 69 Controversy was short-lived, though. Most semiconductor surface scientists could see that Binnig and Rohrer's images contributed new knowledge about the 7×7; they could also see, however, that the Zurich team's proposed model for the 7×7 was unlikely. Therefore a few eagerly began to build their own STMs in order to refine that model.
The iconic STM image of the 7×7, made by Christoph Gerber from cardboard-backed analogue line tracings. Reprinted from G. Binnig and H. Rohrer, ‘Surface imaging by scanning tunneling microscopy’, Ultramicroscopy (1983) 11, pp. 157–160, p. 158, copyright (1983), with permission from Elsevier.
Binnig and Rohrer's proposed model for the 7×7 based on Figure 8. Note that this representation would have been much closer to what surface scientists were used to than Figure 8 (compare, for instance, with Figure 6 especially, but also Figures 4 and 7). Reprinted from G. Binnig et al., ‘Revisiting the 7×7 reconstruction of the Si(111)’, Surface Science (1983) 157, pp. L373–L378, p. L376, copyright (1983), with permission from Elsevier.

It is interesting to note the role of the 7×7 in stimulating the replication of the STM. The very first people who expressed an interest in building their own STMs – prior to seeing the 7×7 images – were, in general, people who had only recently come to surface science, or who saw the STM as a way to gain entry to that field. Those few established surface scientists who had heard of the STM prior to the atomic-resolution images of the 7×7 were, in general, unimpressed. When these surface scientists did finally see the 7×7 images, many changed their minds instantly and either decided to get into the STM field themselves or offered institutional support (which had previously been lacking) for colleagues who were building STMs.Footnote 70 Even so, some early corporate STMers experienced resistance from practitioners of traditional surface science instruments such as LEED; in response they found ways to make STM images more comparable to LEED images by, for instance, transforming their real-space STM images into images in inverse space (see Figure 10).Footnote 71
Fourier-transformed STM image. One way for STMers to insinuate their instrument into surface science was to Fourier-transform their images into inverse-space representations similar, though not equivalent, to LEED images of the same surfaces (since LEED is an inverse-space tool, though one that averages over a larger area, and a somewhat lower depth, than the STM). From E. Demuth, U. Koehler and R. J. Hamers, ‘The STM learning curve and where it may take us’, Journal of Microscopy (1988) 152, pp. 299–316, p. 311. With permission of Wiley-Blackwell.

What brought surface scientists around to acceptance of the STM was not (as noted earlier) that the new instrument ‘solved’ the 7×7. Rather, it was that they could now see in real space this (test) object of mystery and speculation that they had only been able to see (as through a glass darkly) via the indirect approaches of diffractometry and spectrometry. In practical terms, the STM was just one more tool in surface scientists' kit – another means for winnowing down the competing models of surface reconstructions. In emotional terms, though, the STM images of the 7×7 were (as one early corporate STMer put it) like ‘pornography’ – what had been observed obliquely and speculated about wildly could now be ‘seen’ directly (comparable, perhaps, to biologists' celebrations of the decodings of the genomes of various model organisms).Footnote 72 This emotional impact should not be underestimated, since it led to the swift awarding of the Nobel Prize to Binnig and Rohrer in 1986, and enticed large numbers of surface scientists to adopt the STM. It is probably an exaggeration to say that without the 7×7 there would not have been an STM community, but it is almost certainly true that that community would have grown much more slowly and would likely not have been as successful.
Moving beyond the 7×7 – graphite, biology and DNA
Thus by the mid-1980s the 7×7 had become an important boundary object at the intersection of surface science and scanning tunnelling microscopy.Footnote 73 The 7×7 quickly became the standard (and standardizing) test object for tunnelling microscopists – they used it to test their instruments, as a kind of password to see who in the community actually had a working instrument and as a key for harmonizing STM results with those of other surface science instruments. The STM was also applied to the 7×7 in a manner consistent with the reconstruction's role as a kind of model organism (‘fruit fly’) or code-breaker's key (‘Rosetta Stone’). That is, because surface scientists saw the 7×7 as containing clues to the solution of many other reconstructions, they believed that applying the STM to the 7×7 would show them how to use it to unlock other reconstructions. For instance, some early surface science STM groups used the 7×7 to demonstrate their ability to turn the STM into a spectroscopic tool, by gathering data at a large number of points in the 7×7 unit cell over a range of bias voltages.Footnote 74 Others took the 7×7 as a launch pad to explore closely related (and hitherto poorly understood) variants of the silicon (111) such as the 9×9 and 11×11 reconstructions.Footnote 75
However, within surface science, the ‘solution’ to the 7×7 together with rapid improvements in STM technology led to a dramatic diminution in the importance of solving reconstructions. Up until 1985, a Ph.D. student could consider solving a reconstruction as enough of a discovery to be worthy of an entire dissertation, but after that time solving a reconstruction began to be an ordinary piece of brush-clearing to be achieved before moving on to more pressing matters.Footnote 76 This lessening of the importance of reconstructions was by no means a smooth process. In their eagerness to get the first STM images of various reconstructions into print, some researchers in the mid-1980s offered overly simplistic interpretations of the relationship between those images and the reconstructions they represented. These simplistic interpretations were countered, and eventually corrected, by proponents of other surface science techniques.Footnote 77 A chastened STM community eventually developed more cautious ways of applying STM images to the solution of surface reconstructions. As a result, by the 1990s reconstructions had faded in importance as a topic of surface science investigation.
As the STM became standardized and commercially available, more and more non-corporate and non-surface scientific researchers joined the STM community. These researchers began to look for test objects other than the 7×7 that would be suitable for their own investigations. Indeed, the history of probe microscopy from the early 1980s until about 1995 could be written as the story of an often-frustrating search for new test objects that would tie together a rapidly growing and differentiating community that grew out of surface science, enrolled other fields, and became a substantial part of the nanoscience/nanotechnology movement. Such efforts, and the frustrations they encountered, provide insight into the fragile conjunction of pragmatic and epistemic qualities that make up a ‘good’ test object.
One such effort involved graphite – a common material used in surface science and related areas of contemporary ‘nano’ research. As a surface scientist from Lawrence Berkeley National Laboratory noted during an interview, graphite seemed very promising as a ‘test material’:
Graphite I did [image] but more as a test. Not for doing science with it, but for test. As a test material it's a good material. Well at least we thought it was a good material. It has the following advantages: graphite, in air, you can just cleave it, it's made of sheets laid on top of each other, you can remove one and the new surface … is exposed as a fresh new clean surface … [and] chemically they are so inert that nothing reacts with graphite. So even though it's in air, the air molecules and junk molecules that float in the air, they may land but they don't stay on the surface.Footnote 78
In this excerpt, ‘air’ refers to a variant of the STM in which the sample is not enclosed in an ultrahigh vacuum (UHV) chamber.
Air STMs are far less expensive and easier to use than UHV STMs, though their use is complicated by the potential for contamination. Given the scale at which samples are visualized (a matter of nanometres or, at most, micrometres), ambient molecules (‘junk’) can easily contaminate the surface under scrutiny. The scientist mentions two advantages of graphite in this regard: it is easy to peel off the top ‘dirty’ layer (for example, with a strip of common sticky tape) to expose a fresh, clean layer beneath it; and graphite is relatively inert, so ambient molecules do not tend to adhere to its interface with air.
Like the 7×7, graphite was usable as a ‘known known’Footnote 79 for taking the measure of a working instrument and ‘certifying’ the skills of novice microscopists. As one electrochemist who was among the first in his discipline to adopt the STM puts it:
Gewirth: Whenever anybody's learning a new technique and it doesn't matter what it is, you always have them work on something that's known, say ‘can you produce what's known here?’ Then we can go and move away from that …
Mody: Where do the ‘standard things’ come from? Is it a matter of sitting people down with particular specimens?
Gewirth: Yes, right, exactly. You will run graphite in air because everyone should be able to do that. Then we'll do gold under water, then we'll put down this metal monolayer business and once you get to that level then you are viewed as being certified. You have to be able to do that. The other thing is that with any technique, the most important thing is to know when the machine is broken. Machines break and that's the way it is. So we have them do some of these simpler things on a regular basis just to show that the machine is working. For example, graphite in air now is something you should be able to do every day, right – so I say, once a week go make sure you can do it, not because I think you're losing your skills but just to prove that the machine is actually working.Footnote 80
Graphite was characterized as a highly regular material, showing row after row of closely packed atoms with few point defects.Footnote 81 A further advantage was that an unusually large ‘corrugation’ (the distance between the surface layer of atoms and the next layer down) showed up in STM images of the graphite surface – it took less effort to see the corrugation on graphite than on other materials. Yet the unexpectedly large corrugation of graphite proved to be a disadvantage as well – it was a jarring ‘unknown unknown’ for a material that was not even supposed to have ‘known unknowns’. Eventually, STMers came to believe that the large corrugation was an artefact of the tip pushing on the graphite, rather than a ‘real’ distance between undisturbed layers.
Graphite also lent itself for use as a surface on which to deposit other objects – analogous to a glass slide for a light microscope. In various disciplines that are now associated with nanotechnology, graphite began to be used as a substrate on which to place objects of interest such as polymer and liquid crystal molecules and biomolecules. Graphite seemed to be an ideal substrate because it was inert, clean, easy to prepare and highly conducive to atomic resolution. Ideally, atomic resolution would provide a regular pattern with known distances between atoms, acting both as an indicator that the microscope was working properly and as a ruler to measure the adsorbed molecules (much like F.A. Nobert's ruler etched in glass).
When air STMs became commercially available in the 1980s, their relatively low cost and apparent ease of use with the graphite substrate led to a proliferation of new research in diverse areas, particularly in biology. However, many of the early adopters of the STM were not biologists by training; instead, many were physicists who sought to use the new technology to make biological discoveries. Veteran surface scientists, in contrast, denounced as ‘rubbish’ much of what was published at that time by the non-surface scientists who took up the STM.Footnote 82 They also viewed graphite as uninteresting, when compared with the 7×7 – which continued to hold interest for them as a theoretically deep research object as well as a standard test object.Footnote 83 In contrast, for many ambitious non-surface scientists, the ‘uninteresting’ surface structure of graphite was just what was needed to act as a gestalt background for highlighting the features of adsorbed specimens; a background that, moreover, exhibited a definite texture that was usable as a metric.
However, as the scientist in the penultimate quotation above testified, ‘Well at least we thought it was a good material.’ The apparent contrast in STM images between graphite substrate and adsorbed molecule broke down during a controversy over claims about ‘atomic-scale imaging’ of DNA molecules with STM. Other taken-for-granted distinctions between image, instrument and object broke down as this controversy opened up radical questioning about what the apparent visual regularities of the graphite surface ‘meant’, technically speaking.
In the late 1980s, as the Human Genome Project was getting under way, several researchers applied for funding in order to explore the possibility of using probe microscopes to visualize, and potentially sequence, DNA strands. That alternative method of sequencing never panned out, but at the time it seemed to offer a potentially fast, cheap and direct way to read the molecular ‘code’.Footnote 84 Although reasons for being sceptical about that possibility were immediately expressed, the voices of the sceptics were initially drowned out by those who claimed that the atomic resolution of DNA was tantalizingly close. The possibility of direct visual sequencing of DNA was given its most notorious boost when an STM image of a DNA molecule made the 19 July 1990 cover of Nature. The image was produced by a research group at Caltech headed by John Baldeschwieler and was accompanied by an article that described the achievement.Footnote 85
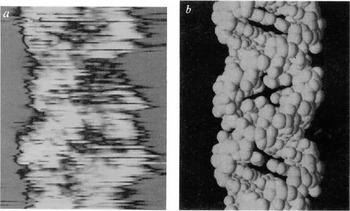
The image that purported to give atomic resolution of DNA (see Figure 11) looked something like a space-filling model of the DNA double helix. It does not take too much imagination to see the iconic turns in the helix and the ladder of base pairs linking the two strands. The authors of the Nature article interpreted the image by relating variations in electron tunnelling to established structural constituents of the molecule:
Experimental STM profiles show excellent correlation with atomic contours of the van der Waals surface of A-form DNA derived from X-ray crystallography. A comparison of variations in the barrier to quantum mechanical tunneling (barrier-height) with atomic-scale topography shows correlation over the phosphate-sugar backbone but anticorrelation over the base pairs. This relationship may be due to the different chemical characteristics of parts of the molecule.Footnote 86
The base pairs and phosphate-sugar backbone were not independently visible in the particular specimen, but those iconic structures provided a scheme for attributing variations in current to an ‘atomic-scale topography’. However, it did not take long for critics to come up with alternative schemes of interpretation: long, meandering strand-like defects in graphite that could mimic DNA, right down to the pitch of the helix.Footnote 87
Purported atomic-resolution STM image of DNA (a), compared with a space-filling model of the DNA double-helix (b). Reprinted with permission from Macmillan Publishers, Ltd: Robert J. Driscoll, Michael G. Youngquist and John D. Baldeschwieler, ‘Atomic-scale imaging of DNA using scanning tunneling microscopy’, Nature (1990) 346, pp. 294–296, p. 295, copyright (1990).

In shades of the infamous N-ray affair,Footnote 88 STMers began to ‘see DNA’ even where they had not intentionally placed it on graphite. As a microscopist recalled years later in an interview,
That certainly looks like a twisted helix of DNA. But according to these particular researchers, they put no DNA down unless they sneezed on their samples. I mean that became a running joke of, you know, who sneezed on their samples.Footnote 89
Another researcher recalled a similar joke that also keyed the familiar tropes of pathological science:
Reconstructions in graphite can resemble different crystalline materials, they can resemble long-chain molecules, literally if you look around long enough you'll see what you want to see. We had a term for that – ‘face of Jesus’. If you looked around long enough you'd see the face of Jesus.Footnote 90
Many of these STM images of DNA and other biological structures were produced by physicists who had little acquaintance with the epistemic culture of biology,Footnote 91 and particularly with established practices for interpreting transmission electron microscope images of biological specimens. Their claims were met with scepticism by biologists who could not imagine how apparent biological structures could be visualized without metal coatings (as was routine in biological electron microscopy). The growing suspicions about artefacts led to wholesale rejection of STM images of DNA and a moratorium on funding for probe microscope research from the National Institutes of Health.Footnote 92
Even before the DNA image was unravelled, so to speak, by a growing army of critics, veteran STMers had become less realist about atomic resolution. They became increasingly attuned, for instance, to how the apparent positions of apparent atoms could change dramatically from one tunnelling voltage to another. Moreover, the graphite platform itself came into question. The nearly perfect lattice structure shown in STM images – which seemed to recommend graphite as an especially fine test object – now seemed suspiciously free of defects. As a researcher explained in an interview, what looked like atomic resolution could arise from ‘a transfer of one flake of graphite to the tip’, so that the scan was ‘graphite over graphite’.Footnote 93 The reason the images were ‘never flawed’, and seemed to have ‘perfect order’, was that the pattern was ‘an ensemble average’:
Prior to that realization everybody calibrated his or her ability for atomic imaging with graphite. You joined the world [of STM] – by showing that you could image graphite. Well the truth of it was that, if you couldn't image graphite with atomic resolution, you certainly weren't going to image anything else with atomic resolution, but imaging the graphite was no proof that you had actually imaged individual atoms.Footnote 94
The tip of a probe microscope is constructed from a very thin metal wire that is chemically sharpened to a point consisting of a single atom (or, rather, a jagged surface in which a single atom should stand out as the apex). Under normal operations, electronic current flows (‘tunnels’) from the sample to the tip, and the amount and variation in the current is measured as the tip moves across the surface. The tip–surface interface is quite unstable, especially when the tip scans an uneven surface. As noted in the above account, the tip can ‘pick up’ flakes from the surface, so that they become the sentry atoms attracting the tunnelling current and lending their (unknown) structure to the tip's conductivity and raster of measurements.Footnote 95 At other times, particular topographic features in the sample being scanned are sharper than the tip, thus turning the tip into the surface that is imaged – a reverse salient, in a very concrete sense.Footnote 96 In both cases, the images that result contain large numbers of repeated features – features that probably do not correspond to anything on the surface being inspected.
Graphite continued to be an important material for research and engineering, and it continues to be used as a substrate for probe microscopy, but it lost favour as a test object for surface science, and the 7×7 still stands as an unchallenged icon of the field's golden years.Footnote 97
Conclusion
The 7×7 and, for a time, graphite became test objects because they satisfied a wide range of disciplinary objectives for the particular networks of scientists who formed around them and adopted them as preferred objects. Of the two, the 7×7 proved more robust for maintaining its integrity at the intersection of structural models, novel instrumentation and material practices in (or near) a commercial domain of research. It was a gold standard for measuring a trainee's skills, as well as an intriguingly complex and yet aesthetically pleasing research object. Some of these objectives harmonized – if indirectly – with the interests of companies like AT&T and IBM: new researchers could become familiar with handling materials similar (though not identical) to those on the production line, new instruments and theories that could be adapted for more commercially relevant questions could pass muster on the 7×7, prestige that would attract new generations of bright minds flowed towards labs that contributed to the 7×7 puzzle. Yet the interests of discipline and institution were often only loosely coupled, joined – barely – through the plausibility of seeing test objects like the 7×7 as both technologically relevant and professionally interesting.Footnote 98 We believe that test objects of this sort are widespread, cropping up whenever professions and institutions must coopt each other and share communal materials.
As discussed in this paper, the 7×7 performed an integrative function for the virtual community (or network) of surface science.Footnote 99 In this respect, it is an illustration of a well-established claim in the history and social study of science. Bruno Latour's notion of ‘immutable mobiles’ suggests that the stability, reproducibility and portability of maps, graphic recordings and graven images are coextensive with the historical expansion, accumulation and stabilization of modern science and technology.Footnote 100 Accordingly, in any given case, the successful production of immutability (the stabilization of an object, image, map and so on) sets up its mobility as well as the network that facilitates its movement. However, just how this works remains contentious. Critics of this idea point out that both immutability and mobility are contingent achievements, which are subject to all manner of natural and human subversion, so that Latour's formulation begs the question of how immutability is secured and mobility sustained.Footnote 101 This case study of the 7×7 did not answer that question; indeed, if it did anything it made it more complicated.
Perhaps one of the most confusing aspects of this history of the 7×7 is the object's epistemic mobility. Not only did it ‘move’ through a network of practitioners, while also being a nodal object for turning that network into a disciplinary ‘community’, its epistemic status also shifted among several possibilities: a novel form of entity (a reconstruction), an unsolved problem for structural modelling and a standard for testing instruments and practices. In some respects, its epistemic status followed a familiar temporal sequence from being an unstable and uncertain focus of research and controversy to becoming a ‘black box’ – a presumptive standard for further research on other, more problematic, matters. However, not only were such shifts reversible (as is especially clear in the case of graphite), they also raised the salience of different lines of epistemic distinction between image and object, theoretical model and empirical referent, and instrument and sample. All the while, the 7×7 maintained a protean stability through a series of instrumental innovations. Perhaps such epistemic mobility is characteristic of the ‘family’ of objects – model organisms, material standards, samples and so on – whose members hold intermediate status in the hiatus between conditions of experimentation and research objects. The familiar dichotomies and debates about objectivity and reference come into play in vernacular accounts of these ubiquitous epistemic things, but the ‘tensions’ these things provoke are themselves sources of historical surprise.