Introduction
The pattern of alcohol consumption varies across the adult lifespan with those aged 60 years or older being the most likely to drink alcohol on a daily basis. However, young adults (< 30 years) are most likely to engage in patterns of alcohol use that confer either long- or short-term risks (Australian Institute of Health and Welfare, 2008). Epidemiological data show that the presence of an alcohol use disorder increases the risk of a mental health disorder and vice versa (Kessler et al., Reference Kessler, Nelson, McGonagle, Edlund, Frank and Leaf1996). Cross-national data from over 29,000 people aged 14–64 indicate that increasing levels of alcohol consumption (use, problem, dependence) are associated with an increased proportion of mood disorders (Merikangas et al., Reference Merikangas1998) with most people reporting that their alcohol use pre-dated their mood disorder (Merikangas et al., Reference Merikangas1998). However, the link between lower, “non-clinical,” levels of alcohol use and mood is less certain in later life, with evidence that moderate consumption may be related to improved mood and quality of life (Byles et al., Reference Byles, Young, Furuya and Parkinson2006; Chan et al., Reference Chan, von Mühlen, Kritz-Silverstein and Barrett-Connor2009). Furthermore, data from community samples suggest that men are more likely to use alcohol as a means of coping with depression than women, but that women may be more vulnerable to depressive symptoms associated with heavy alcohol use (Nolen-Hoeksema, Reference Nolen-Hoeksema2004).
The burden of depression also varies across the adult life course. Based on scores of depressive symptomatology, there appears to be a marked increase in depression from mid-life (>40 years) to later life (>70 years), but when assessed as the proportion exceeding the threshold score on a standard screening instrument this increase appears less pronounced (Gatz et al., Reference Gatz, Johansson, Pedersen, Stig and Reynolds1993). In contrast, other reports have indicated a U-shaped trajectory, with reduced levels of negative affect from mid-life before negative affect increases in the oldest group (>80 years) (Teachman, Reference Teachman2006), no increase even in the oldest old (Haynie et al., Reference Haynie, Berg, Johansson, Gatz and Zarit2001), or even reduced prevalence of affective disorders in those aged 75–85 year (Australian Bureau of Statistics, 2008). However, it should be noted that there are limited data for the oldest old (Stek et al., Reference Stek, Gussekloo, Beekman, van Tilburg and Westendorp2004).
Increased levels of physical disability have been causally linked with depression (Gayman et al., Reference Gayman, Turner and Cui2008), which may lead to increased depressive symptoms in advanced old age; however, at least one recent study has shown that the association between disability and depression lessens in the oldest old (Mehta et al., Reference Mehta2008). These authors suggest that the risk and protective factors for depression in older adults may be age-specific.
The current study used data from the Dynamic Analyses to Optimise Ageing (DYNOPTA) project that has harmonized data from nine longitudinal Australian studies (Anstey et al., Reference Anstey2010). We examined the association between the use of alcohol and depressive symptomatology in community dwelling adults aged from mid-life to the oldest old, using analyses that also controlled for smoking status and physical impairment. Given the inconsistencies among reports on the relationship of depression with age and with alcohol use, it was tentatively hypothesized that depression would increase with age and with alcohol use. The size of the DYNOPTA cohort allows exploration of these complex relationships separately for males and females (Nolen-Hoeksema, Reference Nolen-Hoeksema2004).
Methods
Details of the DYNOPTA cohort and the component studies have been previously reported (Anstey et al., Reference Anstey2010). Six of the DYNOPTA studies collected the key variables used here. The contributing datasets and their baseline samples were: the Australian Longitudinal Study of Ageing (ALSA) (n = 2,087); Australian Longitudinal Study of Women's Health (ALSWH) (n = 26,137); Australian Diabetes, Obesity and Lifestyle Study (AusDiab) (n = 7,296); Household Income and Labour Dynamics of Australia (HILDA) (n = 6,164); Melbourne Longitudinal Studies on Healthy Ageing (MELSHA) (n = 1,000); and the Personality and Total Health Through Life Study (PATH) (n = 2,550). Of these 45,234 people, 39,104 (86%) had depression, alcohol consumption, and disability data at baseline and were living in the community at each follow-up.
All the studies included questions on the frequency and quantity of alcohol typically consumed, similar to the format in the Alcohol Use Disorders Identification Test (Babor et al., Reference Babor, de la Fuente, Saunders and Grant1992). From these values, average daily consumption was estimated. The current Australian guidelines recommend no more than two standard drinks per day (total 20 g of alcohol) for the general adult population to be at “low risk.” Consuming between two and four drinks per day increases the risk of “long-term” harms (e.g. cancer) and more than four drinks per day increases the risk of “short-term” harms (e.g. accidents). Furthermore, those aged 60 and above are advised to consult a health professional to obtain individual direction on an appropriate level of alcohol consumption (National Health and Medical Research Council, 2009).
The studies used a range of established screening instruments to assess depression. ALSA used the Center for Epidemiologic Studies Depression Scale (CES-D) (Radloff, Reference Radloff1977); the Short-Form Health Survey-36 (Ware et al., Reference Ware, Snow, Kosinski and Gandek1993) was used in ALSWH, AusDiab, and HILDA; the Mental Health Components Summary score from the SF-12 (Ware et al., Reference Ware, Kosinski and Keller1996) was used in PATH; and MELSHA used the Psychogeriatric Assessment Scales (PAS) (Jorm et al., Reference Jorm1995). The method for standardizing these scores and the creation of a binary “probable depression” variable is described elsewhere (Burns et al., Reference Burns, Butterworth, Windsor, Luszcz, Ross and Anstey2011). In brief, it involved using the cut points on each scale that have been validated against diagnostic measures. The recommended cut points on the SF-12 and SF-36 (60, 55, and 50 – reversed to reflect poor health with higher scores) equate to 1.0, 1.2, and 1.6 standard deviations (SD) above the mean on the harmonized variable. For the CES-D, cut-off values of 16, 18, and 20 equate to 1.0. 1.2, and 1.6 on the harmonized variable. For the PAS, scores of 4 and 5 correspond to 1.2 and 1.8 on the new variable. Therefore, a cut-off of 1.5 SD above the mean was selected as an indicator of “probable depression,” with the resultant prevalence by age and gender validated against national Australian data. “Impairment” was categorized by combining self-reported ability to walk 1 km (yes/no) and impairment in dressing or bathing (“not at all limited,” “a little limited,” or “limited a lot”) to form a four-item scale (walk 1 km and not at all limited, not at all limited, and a little limited or limited a lot).
Generalized Estimating Equations (GEE) were used to evaluate the relationship between the demographic and substance use predictors and probable depression. The GEE models were implemented in SPSS version 19 and specified an unstructured working correlation matrix. As the period between waves of data collection varies across the studies, time was included as years in the study since baseline. Other time-varying variables were the classification of alcohol use (“low risk,” abstinent, “long-term risk,” and “short-term risk”) and smoking (“never,” “ex-smoker,” and “current smoker”), partner status (partnered vs. not partnered), and physical impairment category (“walk 1 km and not at all limited,” “not at all limited,” “a little limited,” or “limited a lot”). Time-invariant factors were education (left school aged 14 year or younger vs. 15 year or older), gender, and baseline age group. Due to the small cell sizes in some older age groups, age was divided into ten-year periods from age 45.
Results
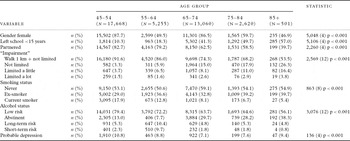
Table 1 shows demographic features, smoking status, and alcohol consumption at baseline by ten-year age groups. Alcohol classification revealed 7,526 (19%) abstinent; 28,112 (72%) low risk; 2,271 (6%) long-term risk; and 1,195 (3%) short-term risk participants. Ages ranged from 45 to 103 years, with a median of 60 years. On each measure, there were significant differences in the proportions by age group. In particular, the decline in current smoking and the increase in the proportion that was abstinent from alcohol at age 85 or older (38%) compared with younger age groups were notable. The median length of follow-up was 4 years (inter-quartile range (IQR) 0–7.8) with the median number of interviews being three (IQR 1–3). Figures 1 shows the prevalence of depression by age group and alcohol consumption for males and females, with a U-shaped curve only clearly evident for males. The overall prevalence of probable depression, shown by the black bars, was highest in the extreme age groups, i.e. 45–54 years 10.8%, 85 years or older 9.4%. It should be noted that at baseline there were no women aged 85 years and above in the short-term risk consumption group and only eight in the long-term risk group; none had depression. Among the males, there were four in the short-term risk group; none had depression.
Demographic characteristics by age group at baseline

Probable depression in males (upper) and females (lower) at baseline by age group and alcohol consumption group: (a) Male; (b) Female.

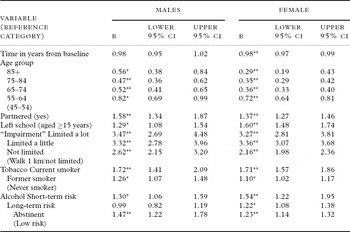
The GEE models showed a significant interaction between gender and alcohol category (Wald 10.7 (3) p = 0.014) and gender and age group (Wald 14.0 (4) p = 0.007). The interaction of alcohol by age group was not significant. To facilitate interpretation, the analyses were stratified by gender. There were significant main effects on all measures shown in Table 2. With respect to alcohol, among females the short-term risk (odds ratio (OR) 1.54), long-term risk (OR 1.22), and abstinence groups (OR 1.23) all had increased odds of probable depression compared with low-risk drinking. Among males, both short-term risk drinking (OR 1.30) and abstinence (OR 1.47) had increased odds compared with low-risk drinking. There was no evidence of increased odds of depression in the long-term risk group. Both current and former smokers had increased likelihood of depression compared with never smokers. For male and female former smokers, the respective increases were 26% and 10%; for current smokers of either gender, the increase was over 70%.
Generalized estimating equation (GEE) results for predictors of (probable) depression

*p < 0.05, **p < 0.001, and CI = confidence interval
For both males and females, each age group had a lower likelihood of (probable) depression compared to the 45–54 year group. Those without a partner, and those who left school before 15 years of age, also had increased likelihood of depression. Compared to those who could walk 1 km and who had no limitation of dressing/bathing, each of the other “impairment” categories had increased likelihood of depression. In addition, among females, the odds of depression declined by 2% for each year post baseline.
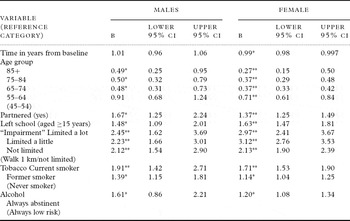
A post hoc analysis was conducted to investigate if the relationship between abstinence and depression was due to changes in alcohol status (potentially due to declines in health). A new alcohol status variable was constructed identifying those with a minimum of two waves of data, those who were abstinent at every wave, and those who were at low risk at every wave. There were 16,319 “always low risk” and 4,346 “always abstinent” participants, comprising 30% of the males (n = 2,345) and 58% of the females (n = 18,320). The new alcohol variable replaced the earlier alcohol variable in the GEE model. In both males and females, those who were always abstinent had increased odds of depression – males 60% and females 20% (Table 3). Among females, the odds ratios on other measures were essentially unchanged in magnitude and direction from the first model. Among males, the effects were mixed, including declines in the magnitude of the impact of impairment on depression and increased magnitude of effect for smoking.
Generalized estimating equation (GEE) results for predictors of (probable) depression for those with longitudinally stable alcohol consumption either “always abstinent” or “always low risk”

*p < 0.05, **p < 0.001. CI = confidence interval
Discussion
The crude prevalence of depression showed the U-shape previously reported, with those aged 45–54 years having the highest prevalence of depression, which declined through the young-old and old before increasing among the oldest old (Teachman, Reference Teachman2006). However, after controlling for other factors, among those aged 85 years and above, there was a lower likelihood of depression than in the youngest group. For both men and women, those with low-risk alcohol consumption had lower odds of depression than those who abstained or who were short-term risk consumers. Among women, but not men, long-term risk alcohol use was also associated with probable depression.
A review reported that the prevalence of depression in those over 75 years living in the community varied between 5% and 25%, with a weighted prevalence of 11.3% (Stek et al., Reference Stek, Gussekloo, Beekman, van Tilburg and Westendorp2004), congruent with the 7.6% and 9.4% reported here for the two oldest groups. Data from an elderly cohort (mean age 72 years) in the USA shows that occasional (< 3 times/week) to moderate regular alcohol use (≥3 days/week and ≥170 g/week) compared with abstinence was associated with significantly lower depression scores for women (and non-significantly different for men) (Chan et al., Reference Chan, von Mühlen, Kritz-Silverstein and Barrett-Connor2009). However, women in the current study using up to 140 g of alcohol per week had lower odds of depression than abstainers, but those in the 141—280 g range had increased odds compared to the reference group.
A range of explanations could underlie the relationship between low-risk alcohol use and reduced odds of depression. As noted previously, continued use of alcohol may contribute to overall health with, for example, moderate alcohol use being causally related to lower heart disease via lipids and hemostatic factors (Rimm et al., Reference Rimm, Williams, Fosher, Criqui and Stampfer1999). Further, abstainers are typically less socially integrated (Lucas et al., Reference Lucas, Windsor, Caldwell and Rodgers2010) and have less social support (Rodgers et al., Reference Rodgers, Korten, Jorm, Christensen, Henderson and Jacomb2000), factors that are associated with poorer mental health. Alternatively, those with better health may require fewer medications with contra-indications for alcohol, and better well-being may result in greater social support through the capacity to continue to participate in social networks where alcohol consumption is an incidental element. For this reason, our conclusions highlight alcohol use as a risk indicator, not a causal contributor, for poor mental health.
Over the life span, the net disability adjusted life years attributed to alcohol use is 2.3% of the total burden of disease in Australia (Australian Institute of Health and Welfare, 2003) with the potential benefits from moderate use of alcohol, such as improved cardiovascular outcomes (Mukamal et al., Reference Mukamal2005) and mortality (Byles et al., Reference Byles, Young, Furuya and Parkinson2006) failing to fully offset the harms. However, among those aged 65 and above, the consumption of alcohol has a net effect of reducing the burden of disease by 2.8% (Australian Institute of Health and Welfare, 2003). In the current cohort, there was no evidence of low-risk alcohol use increasing the burden of disease attributable to depression.
Across the majority of age groups for males and females, those who were abstinent had the highest prevalence of depression. Abstinence from alcohol is also associated with other adverse risk indicators, such as lower socioeconomic status, lower levels of education, and greater financial strain (Anstey et al., Reference Anstey, Windsor, Rodgers, Jorm and Christensen2005; Pattenden et al., Reference Pattenden, Nanchahal, Primatesta and Thom2008). In the current data, we were able to control for some demographic factors that could account for the relationship between abstinence and mood, including the presence of physical impairment, but other factors may still account for the relationship. Furthermore, those who move from being alcohol consumers to abstainers may do so due to declining health (Turvey et al., Reference Turvey, Schultz and Klein2006). Physical impairment was associated with probable depression and when it was included in the multivariate analysis, the increased depression in the oldest age group was no longer apparent. The up-turn in depression in the oldest old may therefore be attributable to their increasing disability rather than to aging per se.
A number of limitations should be noted in interpreting our findings. Alcohol consumption was estimated from categorical frequency and quantity questions concerning typical levels of alcohol consumption, which limits their precision. However, this method has been shown to have a similar level of reliability to diary methods in light drinkers, with both approaches performing less well with heavy drinkers (>32 drinks per week) (Webb et al., Reference Webb, Redman, Gibberd and Sanson-Fisher1991). The current analysis did not control for measures of health such as self-reported diagnosis of chronic conditions or self-rated health, as these measures were only available from a limited subset of DYNOPTA studies. The presence of major health problems could account for both depression and abstinence, and may explain the apparent relationship with depression. However, others have found moderate alcohol use to be associated with improved quality of life even after controlling for chronic conditions such as diabetes and cardiovascular disease (Chan et al., Reference Chan, von Mühlen, Kritz-Silverstein and Barrett-Connor2009). The sensitivity analysis of those who were “abstainers” at each wave and those who were “low-risk” drinkers at each wave supports the notion that differences in depression outcomes are not due to recent changes in alcohol consumption status, but does not eliminate the possibility that some people may have become abstainers before the start of the study, potentially due to declining health.
It should be noted that the very low prevalence of higher levels of drinking among people at the older end of the spectrum, especially women consuming more than two drinks per day (i.e. only eight women in the age 85 plus group), means that any effects will be difficult to detect and limits the potential to generalize recommendations. Finally, our data did not include information on whether or not individuals had received advice on appropriate levels of alcohol consumption, which may explain the low prevalence of long- and short-term risk patterns of alcohol use seen in the oldest groups.
Conclusions
The substantial sample size of the DYNOPTA cohort and, in particular, the inclusion of many at the oldest end of the age spectrum provides a unique opportunity to examine the relationship between alcohol consumption and depressive symptoms while controlling for a range of other factors. The increased likelihood of depression symptoms associated with long-term (women only) and short-term risk patterns of alcohol use did not vary with age, suggesting that these are not age-specific risk factors for depression. Drinking more than two drinks per day, along with tobacco use, may provide markers that would enable targeted screening for depression and for interventions to reduce these life-style risk factors in mid to later life.
Conflict of interest
None.
Description of authors' roles
R.J. Tait conducted the initial analysis and wrote the initial draft. D.J. French and R. Burns developed the initial topic area and contributed to subsequent statistical analyses. K.J. Anstey initiated the DYNOPTA project and provided critical interpretation of the data. All the authors contributed to the final version of the paper and provided editorial input.
Acknowledgments
The data on which this research is based were drawn from several Australian longitudinal studies including: the ALSA, the ALSWH, the AusDiab, the HILDA, the MELSHA, and the PATH. These studies were pooled and harmonized for the DYNOPTA project. DYNOPTA was funded by an NHMRC Grant No. 410215. All studies would like to thank the participants for volunteering their time to be involved in the respective studies. Details of all studies contributing data to DYNOPTA, including individual study leaders and funding sources, are available on the DYNOPTA website (http://dynopta.anu.edu.au). In this paper, the findings and views reported are those of the author(s) and not those of the original studies or their respective funding agencies. Work on this paper was supported by the NHMRC Grant No. 410215 (for the second and third authors) and NHMRC Research Fellowship No. 1002560 (for the last author).