1. Introduction
In a sentence like Mary scolded Sue because she was annoying, the pronoun she is normally interpreted as referring to Sue, the NP2, whereas in Mary angered Sue because she was annoying, she is normally interpreted as referring to Mary, the NP1. Although there are no hard (syntactic) constraints on the interpretation of the pronoun in these sentences, the meaning of the verb in the main clause does form a soft constraint: explanations for one person angering another are most often about the former person, whereas explanations for one person scolding another are most often about the latter. An explanation is said to be about a given referent when that referent is the first or only one to be (re-)mentioned in the explanation. In a given collection of explanations for the event or state described by an interpersonal verb, many verbs show a bias in the proportion of rementions of the NP1 or the NP2. This bias is known in the literature as the implicit causality (IC) bias (Garvey & Caramazza, Reference Garvey and Caramazza1974; Brown & Fish, Reference Brown and Fish1983). Several studies have shown that listeners can rapidly utilize a verb’s IC bias to resolve an ambiguous pronoun (Pyykkonen & Järvikivi, 2010; Cozijn, Commandeur, Vonk, & Noordman, Reference Cozijn, Commandeur, Vonk and Noordman2011; Järvikivi, Van Gompel, & Hyönä, Reference Järvikivi, Van Gompel and Hyönä2017). Moreover, listeners are often not even aware of the ambiguity of the pronoun (Caramazza, Grober, Garvey, & Yates, Reference Caramazza, Grober, Garvey and Yates1977).
Some researchers have argued that a verb’s IC bias is determined by the semantic roles of the individuals participating in the event or state described by the verb (Crinean & Garnham, Reference Crinean and Garnham2006), or by the verb’s lexico-semantic structure (Hartshorne & Snedeker, Reference Hartshorne and Snedeker2013; Hartshorne, O’Donnell, & Tenenbaum, Reference Hartshorne, O’Donnell and Tenenbaum2015). Indeed, IC verbs have sometimes been characterized as verbs with an ‘implicit cause’ (e.g., Garnham, Reference Garnham2001). According to this characterization of implicit causality, one of the verb’s arguments is the cause of the state or event that the verb describes, and explanations for that state or event (‘explicit causes’) are often about that implicit cause. To illustrate, in John frightened Mary, the stimulus role is filled by John, and therefore John is the implicit cause of the sentence. As a result, explanations for this event will often be about John and not about Mary. Hartshorne (Reference Hartshorne2014) has proposed an account in which comprehenders ultimately also rely on discourse context and world knowledge, but only after a first stage during which lexical semantic processing – including which of the verb’s arguments is the implicit cause – is privileged.
More recently, implicit causality has been described not as a feature of the verb’s lexical semantics, but as the result of a need to compensate for missing explanations (Bott & Solstad, Reference Bott, Solstad, Hemforth, Mertins and Fabricius-Hansen2014). The sentence John frightened Mary begs the question what John did to frighten her, and the sentence John feared Mary leaves the listener wanting to know what it is about Mary that made John fear her. Of course, this characterization by itself falls short of actually explaining implicit causality, because it does not make clear why we should want information about John in one case and about Mary in the other. In fact, Bott and Solstad do propose a mechanism that explains why some verbs have an NP1 bias and others have an NP2 bias. According to their theory, IC biases are an epiphenomenon of the use of the verb in a particular discourse or sentence context rather than a feature inherent to the verb’s lexical semantics. We will return to this theory below.
In line with the idea that IC biases are not deterministically related to verb semantics, Koornneef and Van Berkum (Reference Koornneef and Van Berkum2006) consider implicit causality to be a semantic cue, the impact of which depends on the presence and absence of other constraints: “[T]o the extent that verb-based implicit causality is ‘just another cue constraining interpretation,’ suitable wider discourse context should be able to neutralize, and perhaps even reverse the direction of the bias (cf. Arnold, Reference Arnold2001), as a function of respective cue strengths” (p. 461).
In the current paper, we report a story completion study which shows that, when devising explanations, individuals show systematic sensitivity to the wider discourse context, and not just to the verb’s semantic structure. Before we describe the story completion study, however, we report a single sentence completion study, which we conducted in order to obtain baseline remention norms and to test whether an adaptation of a recently proposed verb class taxonomy (Bott & Solstad, Reference Bott, Solstad, Hemforth, Mertins and Fabricius-Hansen2014) performed well at predicting rementions for our selection of verbs. We discuss the implications of our findings in the context of the goal of distinguishing between accounts of IC. But first we will discuss the implicit cause account and the missing explanations account of IC and their predictions regarding the effect of discourse context. In this discussion we introduce a notion from cognitive linguistics that is relevant to implicit causality, but has not yet been connected to it in the literature, namely the Idealized Cognitive Model.
1.1. implicit causality and implicit causes
As was mentioned above, implicit causality has been characterized as a facilitatory effect of congruence between implicit and explicit causes: it is easier to devise an explanation for an eventuality (i.e., event, action, or state) when that explanation is about the implicit cause of the eventuality than when it is not. Apart from the effect of the coherence relation that holds between the main clause and the subordinate clause, no immediate effects of discourse context are predicted on the implicit cause account. The implicit cause account does allow for revision of the causal inferences at a later stage, although it provides no mechanism for the influence of factors other than semantic structure, such as discourse context. However, even before the potential effect of discourse context is considered, the implicit cause account suffers from a number of problems. In this section, we will discuss two of these problems (see Pickering & Majid, Reference Pickering and Majid2007, for a more thorough discussion).
First of all, there is no straightforward way for an analyst to reliably identify the implicit cause of a verb without considering which kinds of explanations are plausible for the eventuality described by that verb. Of course there are causative verbs, which have causal arguments, but there is no one-to-one mapping between causal arguments in semantic structure and IC biases. Many interpersonal verbs do not have a causal argument at all (e.g., to like, to fear), yet they show a strong IC bias. And conversely, some prototypically causative verbs, such as to kill (to cause to die), do not show a strong IC bias (see Bott & Solstad, Reference Bott, Solstad, Hemforth, Mertins and Fabricius-Hansen2014). Verbs that are sometimes called ‘agent-evocator’ (a-e) verbs (Au, Reference Au1986), like to thank and to answer, are claimed to have an implicit cause which is not identical to the agent (the most causally potent thematic role; Croft, Reference Croft2012), because the patient evokes the action. However, as has been noticed before (e.g., Malle, Reference Malle and Shibatani2002), this class of verbs is defined circularly, with reference to the plausibility of explanations for the eventualities described by those verbs. The reasoning is as follows: if John thanked Mary, Mary must have done something thankworthy first, so she has evoked the thanking. But the reason why speakers think it is plausible that Mary has done something thankworthy is the same reason why they tend to explain a thanking event with reference to Mary, and thus the reason why to thank has an NP2 bias. So we cannot maintain that to thank has an NP2 bias because it is an a-e verb.
The second problem with the characterization of implicit causality solely in terms of implicit causes is that it fails to explain the gradient nature of IC biases. Some researchers treat the purported existence of implicit causes that are independent of the distribution of explicit causes as a given, and attribute the fact that not all explanations are about the implicit cause to measurement error (e.g., Guerry, Gimenes, Caplan, & Rigalleau, Reference Guerry, Gimenes, Caplan and Rigalleau2006). It is indeed quite common that, for a given verb, a number of participants devise an explanation that is not in line with the verb’s bias. But there is good reason to believe that these ‘deviant’ responses constitute more than just noise. In Hartshorne et al.’s (2015) IC study, participants chose the most plausible antecedent for an ambiguous pronoun, given sentences with pseudo-verbs like Mary liked Sue because she daxed. The authors found that the verb’s bias could be predicted quite well from its semantic class. However, Van den Hoven and Ferstl (Reference Van den Hoven and Ferstl2017) have shown in a corpus study that the IC biases that resulted from Hartshorne et al.’s (2015) study can be predicted more accurately by also taking into account the strength of the association between the verb and particular syntactic constructions that can be used to convey explanations (e.g., ‘NP + V + NP + for’: John criticized Mary for failing the test and ‘NP.cause + V + NP’: John’s behavior bewildered Mary), after controlling for the verb’s semantic class. This finding shows that there is variability within semantic classes which is due to more than simply measurement error, but which cannot be explained with reference to an implicit cause, since all verbs in a semantic class have the same argument (if any) as their implicit cause.
Two problems – the lack of a one-to-one mapping between IC biases and causal arguments and the gradient nature of IC biases – show that the implicit cause account of IC can only partially explain the data. Hartshorne’s (2014) two-stage account does allow for the eventual influence of world knowledge and discourse context, which can in principle account for the discrepancy between the implicit cause account’s predictions and the data. But the two-stage account lacks a mechanism for any systematic effects of factors other than semantic structure. In short, the implicit cause account under-determines IC bias. However, it is clear that the verb’s semantic structure, including the thematic roles of its arguments, is strongly correlated with IC bias. What is needed is an account that explains both why certain thematic roles are preferred as the topic of an explanation and why this preference is in some cases systematically overridden.
1.2. missing explanations
Bott and Solstad (Reference Bott, Solstad, Hemforth, Mertins and Fabricius-Hansen2014) provide a novel account of implicit causality. On their account, IC is not a unitary phenomenon, but rather a result of at least two different mechanisms that lead to a lack of information from the listener’s perspective, or ‘missing explanations’. One of the mechanisms concerns psych verbs, such as to fear (‘experiencer-stimulus’ (e-s) verbs) and to frighten (‘stimulus-experiencer’ (s-e) verbs). According to Bott and Solstad, the stimulus argument of these verbs preferably takes the form of a proposition rather than an individual. That is, a sentence such as John feared that Mary would reveal his secret, where the stimulus is a proposition in the form of a sentence complement, should be preferred over a sentence like John feared Mary, where the stimulus is the individual Mary. In the latter scenario, the argument is under-specified and the listener is missing information. In most sentence completion studies on implicit causality, both arguments of the verb are realized as individuals. However, the because clause (or the following sentence) provides a suitable place to fill in the missing information. That is why explanations for psych verbs tend to be about the stimulus and not about the experiencer.
Apart from predicting which referent should be rementioned, Bott and Solstad’s (2014) account predicts a specific type of explanation to be prevalent in the context of psych verbs, called a ‘simple cause’. Simple causes are causes that do not involve intentionality on the side of the causer, as in John annoyed Mary because he was snoring. Other types of explanations include ‘internally anchored reasons’, which elaborate on what took place inside the causer’s mind that caused him or her to perform an action, as in John annoyed Mary because he had nothing better to do, and ‘externally anchored reasons’, which elaborate on a state of affairs outside the causer’s mind that caused him or her to perform an action, as in John annoyed Mary because she had been annoying him earlier.
For action verbs that have an NP2 bias (and for the verb to apologize, which has an NP1 bias), Bott and Solstad (Reference Bott, Solstad, Hemforth, Mertins and Fabricius-Hansen2014) offer a different account. Some action verbs, they claim, are associated with causal presuppositions. Intuitively, when a person criticizes another person, the latter has normally done something blameworthy in the former’s eyes. In other words, it is presupposed that the criticism is justified and sincere, and that a particular blameworthy event took place. This set of verbs is identical to the so-called a-e verbs (see above), but Bott and Solstad’s account avoids circularity because it does not postulate an implicit cause in the argument structure. A negation test confirms that verbs like to criticize have a presupposition-like property:Footnote 1 the sentence John didn’t criticize Mary still leads to the implication that Mary did something blameworthy. These verbs carry an assumption that one of their arguments has done something that results in the agent acting upon the patient in a particular manner. Again, the because clause (or the following sentence) in a sentence completion task provides a suitable place to specify the blameworthy or praiseworthy event in detail, usually in the form of an externally anchored reason, which leads to a bias towards the argument with which the causal assumption is associated.
What the mechanisms of under-specification and causal implication have in common is that they both facilitate the formulation of a specific kind of explanation that can be expressed by means of a because clause. IC biases exist by virtue of a lack of information in the discourse, compared to some normative standard, and IC verbs are by no means the only linguistic elements that can bring about such a lack of information.
One other source of information that has an effect on which referent gets rementioned are quantifiers that affect discourse focus. Particles like even and only focus attention on the item they modify. Therefore, the sentence Only John congratulated Mary because … leads to more NP1 rementions than does the sentence John congratulated Mary because … (De la Fuente, Reference De la Fuente2015; De la Fuente, Benzerrak, & Hemforth, Reference De la Fuente, Benzerrak and Hemforth2017). Similarly, the sentence Ellen pleased Paul because … leads to more NP1 rementions when it is preceded by the sentence Few of the people pleased Paul (which focuses attention on those who did not please Paul) than when it is preceded by the sentence A few of the people pleased Paul (which focuses attention on those who did please Paul), even though few and a few are estimated to indicate roughly the same number of people in an independent rating task (Majid, Sanford, & Pickering, 2006).
The gender of the characters participating in the event or state has also been shown to affect remention biases; Ferstl, Garnham, & Manouilidou (Reference Ferstl, Garnham and Manouilidou2011) found that male characters were rementioned more often than female characters. This effect interacted with the gender of the participant, such that male participants but not female participants were more likely to remention male characters. It also interacted with the emotional valence of the verb; negatively valenced verbs were more likely to elicit rementions of the male character than neutral or positively valenced verbs. Hartshorne (Reference Hartshorne2014) replicated this interaction between the gender of the characters and emotional valence, albeit only with a selection of 20 verbs that showed a strong interaction between gender and valence in Ferstl et al.’s (2011) data – but not with a set of 24 other verbs that were chosen to be representative for all interpersonal verbs.
In sum, although there is little doubt that semantic structure strongly correlates with rementions, it seems there is no need to posit an implicit cause for every verb that has an IC bias. Preferences for certain explanations can also come about in verbs that do not entail any causal meaning, and they are dependent on not just the verb, but the entire sentence and even on the preceding sentence (Majid et al., 2006). As we will show below, the missing explanations account can explain how relevant information about protagonists (for instance about their knowledge states, goals, and preferences) can alter remention patterns.
1.3. idealized cognitive models
The studies discussed above have shown that the same verb can lead to different explanations when it is presented in a different context. This suggests that what is relevant is not the verb itself, but the eventuality it describes. The event or state is usually very abstract and rather uninformative in IC studies, because of the use of sentences with minimal content, aside from the verb, and the lack of background information. Nonetheless, people often converge on the sorts of explanations they give for these imaginary events. Verbs seem to trigger certain schemas (Alba & Hasher, Reference Alba and Hasher1983) which are similar across participants. In line with this idea is Lakoff’s (Reference Ghosh, Li and Mitra1987) notion of the Idealized Cognitive Model (ICM). This notion holds that there is an ideal situation to which words apply. The word lie, for instance, is ideally used in a situation where: (i) what is said is false; (ii) the speaker believes it to be false; and (iii) the speaker intends to deceive the listener (Coleman & Kay, Reference Coleman and Kay1981). The more of these assumptions hold, the more closely the situation matches the ICM and the more appropriate the word lie becomes. As long as there is no evidence that the ideal situation does not hold in a particular case (which is true in most sentence completion experiments that involve minimal interpersonal sentences), the language user will likely depend on the ideal situation to form inferences.
In the ideal situation for the verb to criticize, an agent is assumed to criticize a patient sincerely (cf. Fillmore, Reference Fillmore1969), based on valid information about the situation. Importantly, whether these two assumptions hold or not may influence the kind of explanation that is considered to be most appropriate. When the assumptions hold, the patient is an appropriate topic of an explanation of the criticism, because there is a causal implication in to criticize that the patient has done something wrong. However, when they do not hold, it may be more informative to mention that they do not hold.
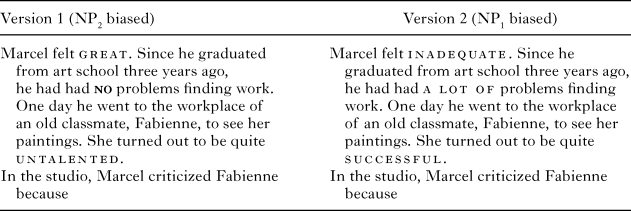
As an example of the stimuli used in Experiment 2, consider the two versions of a story in Table 1. In Version 1, there is no reason to assume that Marcel is misinformed (which would be the case for instance if the paintings he saw were not Fabienne’s but somebody else’s) or that he is not sincere. In Version 2, however, the assumption of sincerity does not hold. Since in this story Fabienne is successful and Marcel is not, Marcel would not normally be expected to criticize Fabienne, unless perhaps it is out of spite, i.e., Marcel is not sincere. If Marcel is indeed not believed to be sincere, it would be informative if the speaker/writer mentioned this in the because clause: e.g., Marcel criticized Fabienne because he was jealous of her. By doing so, the speaker/writer elaborates on Marcel’s internally anchored reasons for criticizing Fabienne (Bott & Solstad, Reference Bott, Solstad, Hemforth, Mertins and Fabricius-Hansen2014), whereas to criticize typically evokes externally anchored reasons when the ICM holds. Finally, an increase in internally anchored reasons is likely to lead to a shift in the remention bias in the direction of NP1 rementions, because the NP1 often occurs in the subject position of the because clause. Therefore, Version 2 is predicted to lead to more NP1 rementions than Version 1.
Two versions of a story in which sincerity is manipulated

Note that the claim that ICMs are relevant to implicit causality is compatible with Bott and Solstad’s (2014) account of IC, but the accounts differ in scope. With regard to its explanandum, Bott and Solstad’s account is more specific because it identifies mechanisms specific to implicit causality, whereas ICMs were initially proposed in the context of a different phenomenon, namely prototypicality in semantics. With regard to the linguistic units the accounts are applied to, Bott and Solstad’s account is less specific than ICMs because the former is applied to verb classes rather than specific verbs, whereas the latter’s predictions can differ between verbs within a verb class. For instance, although to accuse, to excuse, and to criticize are all a-p verbs with a causal implication regarding the patient, only the ICM for to criticize includes the assumption that the patient indeed did something blameworthy (Fillmore, Reference Fillmore1969). A different ICM potentially applies to all verbs that entail a form of evaluation (e.g., to like, to scare, to praise). We assume that, generally, different individuals tend to agree rather than disagree on how to evaluate a given stimulus, although different stimuli tend to evoke different responses in the same individual. In terms of the ‘covariation hypothesis’ (Kelley, Reference Kelley1967, Reference Kelley1973), both consensus (i.e., the agreement between individuals) and distinctiveness (i.e., how special the stimulus is in eliciting a certain response) tend to be high. This assumption is grounded in the idea that people as experiencers/evaluators are quite alike, compared to the variety of different stimuli that they evaluate across their lives. If this is true, then evaluatees will generally form a more informative topic for an explanation than evaluators, since knowing one person’s response to a stimulus we can reliably predict others’ responses to the same stimulus as well, although we could not reliably predict the same person’s response to other stimuli.
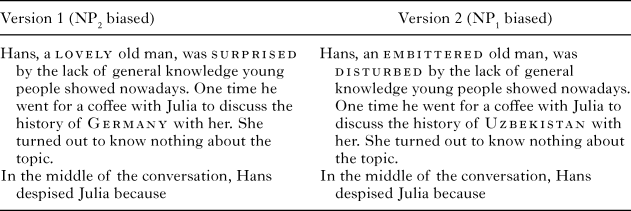
Like the ICMs for verbs with causal implications, the ICM for evaluative verbs can be violated by the discourse context. If it is known that one individual responds unlike other, comparable individuals to a given stimulus, and that this individual responds to various comparable stimuli in this manner, then people may be more likely to explain the response with reference to the individual than with reference to the stimulus. To illustrate with another example of stimuli used in Experiment 2, consider the two versions of a story in Table 2. To a German audience (such as the participants in our study), it is unremarkable if a person does not know anything about the history of Uzbekistan, but it is noteworthy if a person knows nothing about the history of Germany. Therefore, consensus is high in Version 1, but not in Version 2. Furthermore, in Version 1, the background information leads the reader to believe that Hans is a rather agreeable person who would not easily think badly of a person, meaning his response to Julia is highly distinctive. In Version 2, however, the background information given about Hans (he is embittered and disturbed by the lack of general knowledge young people showed nowadays) strengthens the belief that Hans may simply be a person with high standards about what counts as general knowledge, and he would respond to many others in the same way as he responds to Julia, so distinctiveness is low. Therefore, on the basis of consensus and distinctiveness, Version 2 is predicted to lead to more NP1 rementions than Version 1.
Two versions of a story in which consensus and distinctiveness are manipulated

To recapitulate, if IC biases depend on more than just the semantic structure of the verb, then altering the discourse context in a way that it violates assumptions that are part of the IC verb’s ICM, such as sincerity, well-informedness and the covariation variables consensus and distinctiveness, should result in a modulation of remention patterns. Apart from the study by Majid et al. (2006) discussed above, no other study (that we know of) has investigated how the larger discourse context affects rementions in the context of IC verbs.
If discourse context systematically affects rementions, then the implicit cause account will need to be enhanced to account for the data. At present, the implicit cause account includes no explicit mechanism to account for systematic effects of discourse context on remention biases. More importantly, however, if there is a systematic effect of discourse context on rementions, then this effect can be utilized in online studies on pronoun resolution to see whether there is indeed a stage of pronoun resolution during which language-structural information is privileged, or whether listeners draw upon relevant information from the discourse context as early as they draw upon language-structural information.
No study to date has provided online evidence for a two-stage process in the context of implicit causality. Moreover, there have been studies not dealing with implicit causality which have shown that there is no delay in the influence of world knowledge and discourse context during processing, relative to the influence of lexical semantics (Hagoort, Hald, Bastiaansen, & Petersson, Reference Hagoort, Hald, Bastiaansen and Petersson2004; Nieuwland & Van Berkum, Reference Nieuwland and Van Berkum2006). However, other studies have reported effects of lexical semantics that precede effects of world knowledge in sentence processing (Martin, Garcia, Breton, Thierry, & Costa, Reference Martin, Garcia, Breton, Thierry and Costa2014, Reference Martin, Garcia, Breton, Thierry and Costa2016), so the matter is still undecided.
In Tables 1 and 2 we presented examples of story-pairs used in Experiment 2 in which different components of ICMs are manipulated. However, the effect of ICMs is assumed to be the strongest when the comprehender has only minimal information about the context. Of course, information that is present in both versions of a story can also affect remention biases. Before conducting the story completion experiment, therefore, we needed to estimate the remention biases of German verbs presented in a minimal context. This way, we could distinguish in Experiment 2 between the effect of embedding the verb in a larger discourse context, regardless of whether or not this context violated assumptions from an ICM, and the effect of discourse manipulations specifically designed to violate the ICM’s assumptions and thereby alter remention biases. In the following section, we report a norming study we conducted to estimate these biases.
Apart from the primary goal of obtaining baseline remention norms, Experiment 1 also served a secondary goal. Some of the discourse context manipulations employed in Experiment 2 concerned those features of the verb that make it a member of a specific verb class. Therefore, we needed to check whether the verbs indeed behaved like members of the class they were assigned to in a sentence completion task. For instance, in five story-pairs from Experiment 2 involving verbs that are ambiguous between a-p and s-e verbs (e.g., to amuse), we manipulated whether or not the agent/stimulus intended to elicit a certain response. This manipulation depended on the assumption that these verbs can behave both as a-p verbs (which are equibiased as a group) and as s-e verbs (which are NP1 biased as a group) in a sentence completion task. Other story-pairs were constructed around verbs with a causal implication, such as to criticize, which are predicted to lead to a majority of rementions of the causally implicated argument when there is no discourse context. In short, the secondary goal of Experiment 1 was to test whether our verbs elicited the pattern of rementions predicted by the verb’s class. For this, we used an adaptation of Bott and Solstad’s (2014) taxonomy.
2. Experiment 1
Bott and Solstad (Reference Bott, Solstad, Hemforth, Mertins and Fabricius-Hansen2014) divided verbs into six categories. As various authors have done before (e.g., Au, Reference Au1986; Rudolph & Försterling, Reference Rudolph and Försterling1997), Bott and Solstad (Reference Bott, Solstad, Hemforth, Mertins and Fabricius-Hansen2014) extended Brown and Fish’s (1983) original tripartite division into a-p verbs, e-s verbs, and s-e verbs by dividing the class of a-p verbs into two classes: a class of a-p verbs with a causal presupposition and a class without such a causal presupposition. Moreover, they added a class of verbs which are ambiguous because they have an a-p and an s-e reading, and a class of verbs which are ambiguous between an a-p reading and an e-s reading. A person can deliberately surprise or hurt another person, which would make these verbs a-p verbs, but it is also possible to do so inadvertently, which would make the verbs s-e verbs. The class of ambiguous e-s/a-p verbs included only one verb in our sample: anhimmeln ‘to worship’. A person can either worship another person passively, by experiencing adoration for him or her, or actively, by expressing their adoration.
We diverge from Bott and Solstad’s (2014) taxonomy in that, instead of including a specific class of a-p verbs with causal implications, we include causal implications as a separate dimension orthogonal to verb class. The rationale behind this separation is that verbs other than a-p verbs can show causal implications that are very similar to those shown by a-p verbs. For example, to envy and to pity are unambiguous e-s verbs, but when they are negated, the implication that the person being envied or pitied is in a(n) (un)favorable situation remains.
In the analysis we tested the taxonomy by comparing the bias of each verb class to the bias of the verb class immediately following it in terms of hypothesized NP1 bias. The hypothesized ordering is based on two considerations. First, stimulus arguments should be preferred as topics for explanations over other thematic roles because stimulus arguments are under-specified when their slot is filled by an individual rather than a proposition (Bott & Solstad, Reference Bott, Solstad, Hemforth, Mertins and Fabricius-Hansen2014). And second, among verbs with an unambiguous stimulus argument, the preference for this argument as a topic for explanations should be stronger than among verbs with a stimulus argument that can also be interpreted as a different thematic role (agent or experiencer). Based on these considerations, the hypothesized ordering of the classes regarding the strength of their NP1 bias is: unambiguous s-e verbs > ambiguous s-e/a-p verbs > unambiguous a-p verbs > ambiguous e-s/a-p verbs > unambiguous e-s verbs. Concerning causal implications, we hypothesize that: (i) verbs with causal implications regarding the NP1 lead to more NP1 rementions than the other categories (no causal implications and causal implications regarding the NP2); and (ii) verbs with no causal implications lead to more NP1 rementions than verbs with causal implications regarding the NP2.
2.1. method
2.1.1. Participants
Thirty-four self-reported native German speakers (17 men, 17 women) were recruited from the online crowdsourcing platform Clickworker (www.clickworker.com) and from the University of Freiburg’s cognitive science student population. Ages ranged from 19 to 33 years (M = 24.6, SD = 3.6). Participants recruited via Clickworker received €4.50 and cognitive science students received course credit for their participation. Participants took approximately 30 minutes to complete the study.
2.1.2. Materials
We selected a total of 100 German verbs. Ninety-six verbs were translated from a selection of Ferstl et al.’s (2011) English verbs. Four additional verbs that were not in Ferstl et al.’s set were added (festhalten ‘to hold’; erkennen ‘to recognize’; verstehen ‘to understand’; and sich anschließen ‘to join’). There were 15 unambiguous s-e verbs; 16 ambiguous s-e/a-p verbs; 47 unambiguous a-p verbs; 1 ambiguous e-s/a-p verb and 21 unambiguous e-s verbs. One of the verbs had a causal implication regarding the NP1; 24 had a causal implication regarding the NP2, and 75 had no causal implication. The verbs were embedded in sentences such as the following: Milena fürchtete sich vor Florian, weil ‘Milena feared Florian because’. Each sentence was presented with a male name in NP1 position and a female name in NP2 position in one list, and with reversed genders in the other list. Half of the sentences in each list had a male name in NP1 position, and the other half a female name.
2.1.3. Procedure
Each participant completed 100 preambles by typing their continuation into a text box. They were instructed to follow their intuitions, and not to use humor. Furthermore, they were asked not to associate the names in the study with anyone they knew.
2.1.4. Data analysis
The type of continuation (‘NP1’, ‘NP2’, ‘both’, or ‘other’) was initially assigned automatically on the basis of the first word. If the letter string preceding the first white space was a personal pronoun or the name of one of the two characters in the main clause, the continuation was categorized as either ‘NP1’ or ‘NP2’, depending on the name or the gender of the pronoun. In all other cases, the continuation was categorized as ‘other’. Subsequently, we manually checked all continuations that were initially categorized as ‘other’, as well as all continuations which contained a referential form that was ambiguous (e.g., sie can mean ‘she’, ‘her’, ‘they’, or ‘them’; ihr can mean ‘her’ or ‘their’; and der and die can be either demonstrative pronouns or definite articles).
We analyzed the data using a Bayesian mixed-effects logistic regression model. For a discussion of the benefits of Bayesian analysis over frequentist analysis aimed at language scientists, see Nicenboim and Vasishth (Reference Nicenboim and Vasishth2016) and Vasishth and Nicenboim (Reference Vasishth and Nicenboim2016). The dependent variable was remention type (NP1 or not NP1). The predictors (fixed effects) were the semantic class of the verb (Semantic Category), the causal implication of the verb (Causal Implication), the gender of the NP1 (Gender NP1), the gender of the participant (Gender Participant), and the interaction between the gender of the NP1 and the gender of the participant. We used logistic regression because we are dealing with a binary dependent measure (Jaeger, Reference Jaeger2008). Since each participant and each item contributed multiple datapoints, we could estimate random intercepts and random slopes for certain fixed effects per participant and per item (Baayen, Davidson, & Bates, Reference Baayen, Davidson and Bates2008). Specifically, the model included random intercepts and random slopes for the effects of Semantic Category, Causal Implication, and Gender NP1 per participant, as well as random intercepts and random slopes for the effects of Gender Participant, Gender NP1, and their interaction per verb.
Throughout, we follow Gelman, Jakulin, Pittau, and Su (Reference Gelman, Jakulin, Pittau and Su2008) in centering factors with two levels around 0, with a difference of 1 between the two levels of the factor (e.g., if 60% of responses are given by men, the levels of the factor Gender are coded as  $- 0.6$ for women and 0.4 for men). This was done in order to minimize the correlation between the slope of the effect of the factor and the intercept. For the factors Semantic Category and Causal Implication we used successive-differences contrasts, such that each level was compared to the next, in order of the hypothesized IC bias of the level, from NP2 to NP1 (see above).
The model was fitted to the data using the stan_glmer () function from the stanarm package version 2.14.0 (Stan Development Team, 2017) in R version 3.3.3 (R Core Team, 2017). The MCMC sampler produced 4 chains of 2000 samples each, and the first 1000 samples of each chain were discarded as ‘burn-in’ (i.e., these were only used to find a good starting point for the subsequent samples). The remaining samples form the posterior distribution: a distribution of probable effect size estimates for every predictor (as well as estimates for other model parameters), given the data and the prior distribution. Student-t distributions with μ = 0, degrees of freedom parameter ν = 5 and scale = 2.5 were used as weakly informative priors for all input variables (Gelman et al., Reference Gelman, Jakulin, Pittau and Su2008; Ghosh, Li, & Mitra, Reference Ghosh, Li and Mitra2018). Student-t distributions have thicker tails than normal distributions, and are thus more robust in the presence of outliers.
We calculated the Bayes factor for each predictor using the Savage–Dickey method (Dickey & Lientz, Reference Dickey and Lientz1970; Wagenmakers, Lodewyckx, Kuriyal & Grasman, Reference Wagenmakers, Lodewyckx, Kuriyal and Grasman2010), which returns the ratio between the height of the probability density of the posterior distribution and the height of the probability density of an arbitrary prior distribution at a given value of a parameter (see ‘Appendix A’ for details). We also report the 50% and 95% Highest Density Intervals (HDIs) for each predictor, which indicate the range of the 50% (or 95%) most probable effect size estimates in the posterior distribution. The data and the analysis script are available on <https://osf.io/9anv2/>.
2.2. results and discussion
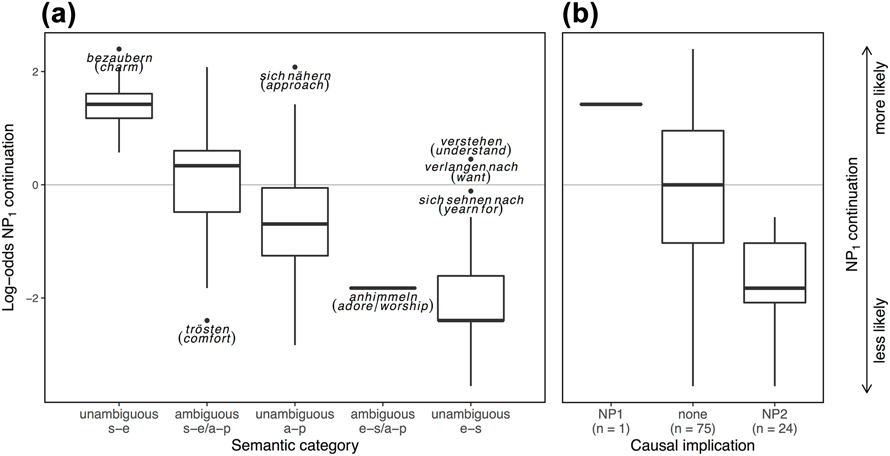
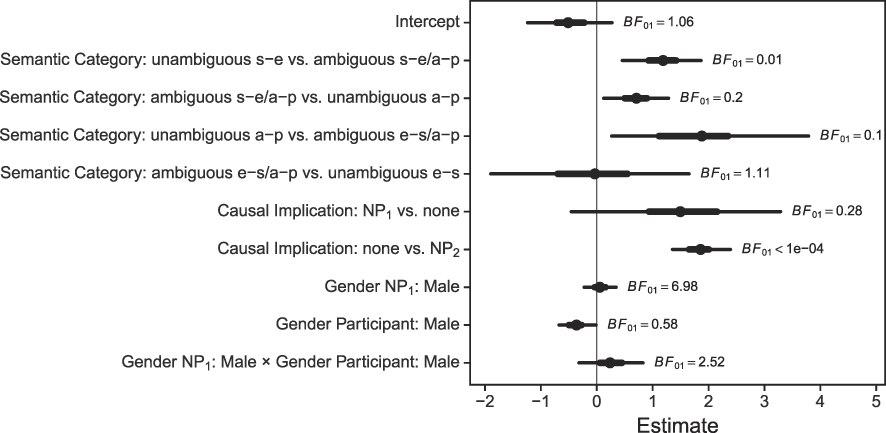
Figure 1 shows the log-odds of an NP1 continuation per verb for each of the five Semantic Categories. Figure 2 shows the medians and 50% and 95% HDIs of the posterior distributions for the comparisons between levels of Semantic Category and Causal Implication, and for the predictors Gender NP1, Gender Participant, and their interaction. There was anecdotal evidence that unambiguous e-s verbs did not differ from the ambiguous e-s/a-p verb. Furthermore, there was moderate evidence that unambiguous a-p verbs were more NP1 biased than the ambiguous e-s/a-p verb (though the HDIs had a wide range because the latter class included only one verb), and that ambiguous e-s/a-p verbs were more NP1 biased than unambiguous a-p verbs, and strong evidence that unambiguous s-e verbs were more NP1 biased than ambiguous s-e/a-p verbs.Footnote 2 In sum, the decision to separate ambiguous s-e/a-p verbs from unambiguous s-e verbs and unambiguous a-p verbs is well supported by the data, but our study provided no empirical support for the decision to separate ambiguous e-s/a-p verbs from unambiguous e-s verbs. The latter decision may be conceptually sensible, but more ambiguous e-s/a-p verbs are needed to test whether this class can also empirically be distinguished from the unambiguous e-s class. We leave this question for future research.
Boxplots of the log-odds of an NP1 continuation per verb in Experiment 1, (a) by Semantic Category and (b) by Causal Implication. Outliers (values lower than the median − 1.58 * interquartile range / sqrt(n) or higher than the median + 1.58 * interquartile range / sqrt(n) for a given Semantic Category) are plotted individually. s-e = stimulus-experiencer, a-p = agent-patient.

Posterior distributions of fixed effect estimates for Experiment 1. Dots indicate medians; thick lines indicate 50% Highest Density Intervals and thin lines indicate 95% Highest Density Intervals. BF01 indicates the Bayes Factor: the ratio between the probability of an estimate of 0 given the alternative hypothesis H1 and the probability of an estimate of 0 given the null hypothesis H0. A smaller BF01 value means more support for H1 over H0. s-e = stimulus–experiencer, a-p = agent–patient.

Turning to Causal Implications, there was very strong evidence that verbs without a Causal Implication were more NP1 biased than verbs with a Causal Implication regarding the NP2, and moderate evidence that the verb with a Causal Implication regarding the NP1 was more NP1 biased than the verbs without a Causal Implication (though here the HDIs again had a wide range because there was only one verb with a Causal Implication regarding the NP1).Footnote 3 Although the decision to include Causal Implication as a separate dimension orthogonal to verb class was made primarily on conceptual grounds, it also proves to be worthwhile empirically.
Concerning the gender-related variables, women did not provide more NP1 than NP2 continuations, as was reported by Ferstl et al. (Reference Ferstl, Garnham and Manouilidou2011), and there was only anecdotal evidence that women used more NP1 continuations than men. There was also moderate evidence against a general preference in favor of continuing the sentence with the NP1 when the NP1 was a man, which Ferstl. et al. found, and anecdotal evidence against an interaction between the two gender-related variables. With regard to the discrepancies between the current results and the results reported in Ferstl et al., it must be noted that Ferstl et al.’s study had almost three times as many participants and more than three times as many verbs than the current study. A table listing the counts of continuation types for each verb separately is provided in ‘Appendix B’.
3. Experiment 2
In line with previous work (e.g., Bott & Solstad, Reference Bott, Solstad, Hemforth, Mertins and Fabricius-Hansen2014; Ferstl et al., Reference Ferstl, Garnham and Manouilidou2011; Hartshorne et al., Reference Hartshorne, O’Donnell and Tenenbaum2015), Experiment 1 showed that, when the context consists only of a minimal interpersonal clause such as John likes Mary because, remention biases can be predicted quite well on the basis of Semantic Category – particularly when Causal Implications are also considered. However, if it is true that IC biases are dependent on ICMs, which can be violated, then particular discourse contexts should be able to systematically weaken, and perhaps sometimes even reverse the remention bias, (cf. Koornneef & Van Berkum, Reference Koornneef and Van Berkum2006). We tested this hypothesis in a story completion study, using story-pairs like the ones presented in Tables 1 and 2 as experimental materials, and the remention norms from Experiment 1 as an independent baseline.
3.1. methods
3.1.1. Participants
Forty-four self-reported native German speakers (26 men, 18 women) were recruited via Clickworker. Ages ranged from 19 to 36 years (M = 28.4, SD = 5.1). Participants received €8.00 for their participation and took approximately 60 minutes to complete the study.
3.1.2. Materials
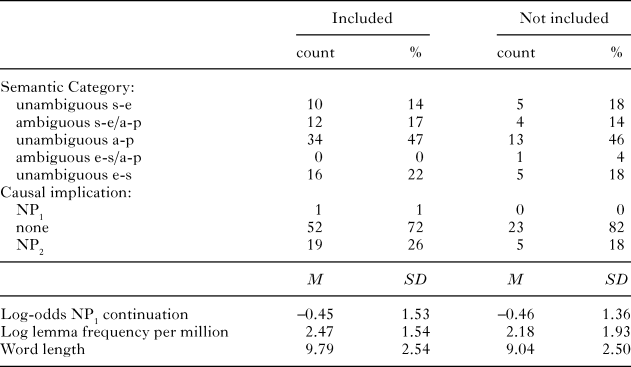
From the 100 verbs used in Experiment 1, 72 verbs with a broad range of IC biases were selected (M = 42% NP1 continuations, SD = 30, range = [0, 91]). Lemma frequency for these verbs ranged from 0.8 to 519.0 per million in the dlexDB corpus (Heister et al., Reference Heister, Würzner, Bubenzer, Pohl, Hanneforth, Geyken and Kliegl2011). The verbs included in the Experiment 1 study were similar to the verbs not included in terms of proportion of verbs from each semantic category, causal implications, IC bias, log lemma frequency per million, and word length, as Table 3 shows.
Descriptive statistics for verbs included and verbs not included in Experiment 2

Two versions of a story were constructed around each of the selected verbs, which were designed to render either an explanation with an NP1 topic or an explanation with an NP2 topic more plausible (see Tables 1 and 2 for examples). A variety of types of manipulations of the story content were used, and in some cases multiple types of manipulations were used within one story in order to strengthen the discourse context effect.
In 16 of the stories, the manipulation of the plausibility of explanations was done by altering the sincerity of the agent/stimulus, as exemplified in Table 1. In 12 stories, the well-informedness of the agent or experiencer was manipulated. For example, when the agent of a punishing event falsely believes the patient to be responsible for an event, the agent is a more likely topic of an explanation for the punishing than when the agent is correct in her belief. In 50 stories, the covariation variables consensus and distinctiveness were manipulated, as illustrated in Table 2. Finally, in 5 stories which involved ambiguous a-p/s-e verbs, the intendedness of the eventuality was manipulated. Unlike unintended eventualities, intended eventualities can be explained with internally anchored reasons, which should lead to more rementions of the agent/stimulus compared to the unintended eventualities. All 72 stories together with the types of manipulations used in them can be found in the supplementary materials (available at: http://doi.org/10.1017/langcog.2018.17).
Differences in information structure across conditions were kept to a minimum. The NP1 and NP2 referents were nearly always mentioned equally often and at the same places in the discourse in both versions of the story. Furthermore, the same type of referential form (pronoun, name, or description) was used for the referents in both versions. On average, 4.11 words differed between the two versions of the stories (SD = 1.74).
We did not add a third ‘single sentence’ condition, for the following reasons. First, the target sentence in the stories (e.g., Dann näherte sich Fabian Fiona, weil … ‘Then, Fabian approached Fiona because …’) would often be infelicitous when presented in isolation. We could delete the preverbal material and change the word order, but then the only added benefit of including isolated sentences in the story completion would be that we would have the single-sentence condition in our within-subject design. The downside of including isolated sentences among the trials, however, is that participants’ focus would likely be directed to the target sentences also in the conditions with a story context. Variation between participants in the sentence completion task was minimal compared to variation between verbs (regarding the proportion of NP1 responses, among participants SD = 0.07, whereas among verbs SD = 0.29). So it could be relatively safely assumed that the participants in the story completion task would show similar sentence completion biases to those who participated in the sentence completion task. Therefore, we preferred the option of including the verb’s IC bias as gauged by the sentence completion task as a predictor in the model.
As noted above, Ferstl et al. (Reference Ferstl, Garnham and Manouilidou2011) found that the gender of the characters in the sentence can influence IC biases (see also Hartshorne, Reference Hartshorne2014). Male characters were more likely to be the topic of an explanation in events with a negative valence (e.g., to hit, to kill) than female characters. To control for such a gender bias (although we found no effects of any of the gender variables in Experiment 1), we presented every story-pair in two conditions, one in which the NP1 was male and the NP2 was female, and one in which the genders of the characters were swapped. Consequently, every story was presented in four versions (2 Discourse conditions × 2 Gender conditions). Four lists were created, each with 18 stories from every condition, presented in random order. Verbs with different IC biases were spread evenly across the experiment. Every participant saw only one version of a given story.
3.1.3. Procedure
The experiment was conducted on the online platform <www.surveymonkey.com>. Participants were informed that they would read 72 unfinished stories about two or more persons and that their task was to complete every story. They were instructed to follow their intuitions and to think of a suitable ending. Furthermore, they were asked not to connect the names in the stories to anybody they knew. Two example stories were given, one with an NP1 continuation (The lion ate the zebra because … he was hungry) and one with an NP2 continuation (The mouse fled from the cat because … she was too dangerous).
To ensure that participants read the entire stories and not just the final sentence before devising a continuation, every story was followed by a yes/no comprehension question. The questions focused on various aspects of the discourse context and were not difficult to answer (see the supplementary materials for all comprehension questions).
3.1.4. Data analysis
The type of (re)mention (NP1, NP2, both, or other) was assigned automatically on the basis of the first word using gender when a pronoun was used, and the names of the protagonists when a name was used. Subsequently we manually checked the assignment for mistakes. A Bayesian mixed-effects logistic regression model with the predictors IC Bias (the log-odds of an NP1 continuation in the norming study); Discourse Context (NP1-biased or NP2-biased); the interaction between IC Bias and Discourse Context; Gender NP1; Gender Participant and the interaction between Gender NP1 and Gender Participant was fitted to the data using the stan_glmer() function from the stanarm package version 2.14.0 (Stan Development Team, 2017). The model included random intercepts and random slopes for the effect of Discourse Condition and all Gender terms per item, as well as random intercepts and random slopes for the effects of Discourse Condition, IC Bias, and Gender NP1 per participant. The dependent variable was the type of remention (NP1 remention vs. no NP1 remention).
In calculating the log-odds of an NP1 remention in Experiment 1, a count of 1 was added to each response category (NP1 and not-NP1) in order to overcome problems with zero counts. Subsequently, the log-odds were scaled to have a mean of 0 and standard deviation of 0.5 across all data included in the analysis. Student’s t-distributions with μ = 0, ν = 5, and scale = 2.5 were used as weakly informative priors for all terms. Bayes factors were calculated as described in ‘Appendix A’, except that the effect of IC Bias was not only tested against H 0 (there is no effect of IC Bias on rementions during story completion), but also against a second baseline hypothesis, H 2, which holds that the effect of IC Bias is unaltered by a story context. This means that under H 2, if the proportion of NP1 rementions in sentence completion differs by an amount x between two verbs, the proportion of NP1 rementions in story completion differs by the same amount x between the two verbs. In the following, Bayes factor BF 01 refers to the Bayes factor comparing H 0 to H 1, and Bayes factor BF 21 refers to the Bayes factor comparing H 2 to H 1. Smaller BF 01 values indicate larger support for H 1 (IC bias affects rementions in a story context, though not as much as in a single sentence context) over H 0 (IC bias does not affect rementions in a story context), and smaller BF 21 values indicate larger support for H 1 over H 2 (the effect of IC bias on rementions is the same in a story context as it is in a single sentence context).
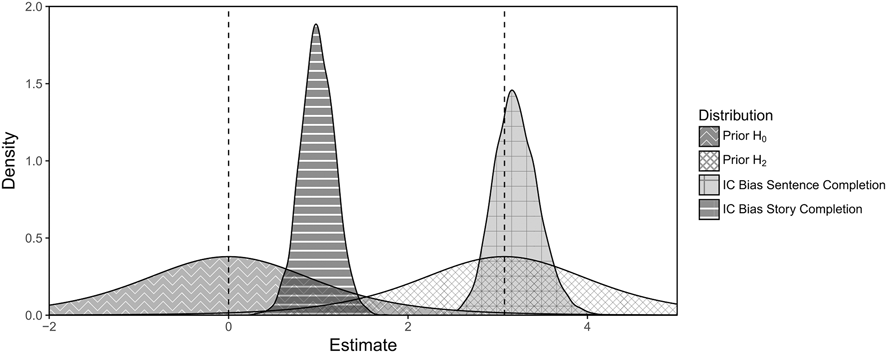
Our prior distribution representing H 2 was a shifted central Student’s t-distribution with μ = 3.07 and ν = 5. We estimated the value for μ in the following way. First, we created 100 hypothetical datasets for the story completion study, in which the proportion of NP1 responses for a given verb corresponded perfectly to the proportion of NP1 responses for that verb in the sentence completion study, but the NP1 responses were distributed randomly across participants and across the levels of the variables Discourse Context and Gender NP1. Next, we fit the same model that was fit to the actual data to each of the hypothetical data sets, and we determined the value for μ by calculating the mean of the 100 resulting posterior means for the predictor IC Bias. The Savage–Dickey density ratio was calculated at an estimate of 3.07.
We checked whether our prior distribution representing H 2 was reasonable by comparing it to the effect of IC Biases taken from one sentence completion study (Bott & Solstad, Reference Bott, Solstad, Hemforth, Mertins and Fabricius-Hansen2014) on rementions in another sentence completion study (our own Experiment 1). There should be evidence in favor of IC Bias predicting rementions given our choice of prior distribution and the point at which the Savage–Dickey density ratio was calculated. We derived the posterior distribution of the effect of IC Bias from a Bayesian logistic regression model fit to part of the sentence completion data, with as a predictor the log-odds of an NP1 continuation for a given verb in Bott and Solstad’s sentence completion study, and as outcome the type of continuation (NP1 continuation vs. no NP1 continuation) for that same verb in our own sentence completion data. Thirty-eight verbs occurred in both datasets, leaving a total of 1292 responses. The predictor IC Bias was transformed to the same scale as IC Bias in the story completion analysis. The Savage–Dickey density ratio between the posterior distribution of this analysis and a shifted central Student’s t-distribution with μ = 3.07 and ν = 5 was 3.65, meaning that, given our choice of prior distribution, there was moderate evidence that IC Bias in Bott and Solstad’s data did not differ from IC Bias in our own sentence completion data (see Figure 3). The data and the analysis script are available on <https://osf.io/9anv2/>.
The prior distributions representing H0 (IC Bias does not predict the proportion of NP1 rementions in story completion) and H2 (IC Bias corresponds perfectly to the proportion of NP1 rementions in story completion), and the posterior distributions of the effects of IC Bias on the proportion of NP1 rementions in sentence completion and in story completion. The horizontal axis indicates the estimate of the effect size in log-odds, and the vertical axis indicates the probability density for that estimate. Dashed lines indicate the values of the estimate at which the Savage-Dickey density ratios were calculated.

3.2. results and discussion
One of the stories was erroneously presented with the name of one of the characters following because in one of the lists. We only present the results for the 71 remaining stories. Data from five participants who answered fewer than 75% of the comprehension questions correctly were excluded from the analysis, as well as all 9 trials from one participant where the response field had been left blank. The remaining participants answered on average 90% of the comprehension questions correctly (SD = 4). The proportion of NP1 rementions per participant ranged from .30 to .77 (M = 0.55, SD = 0.09).
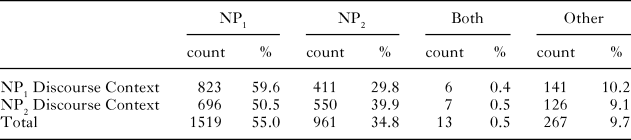
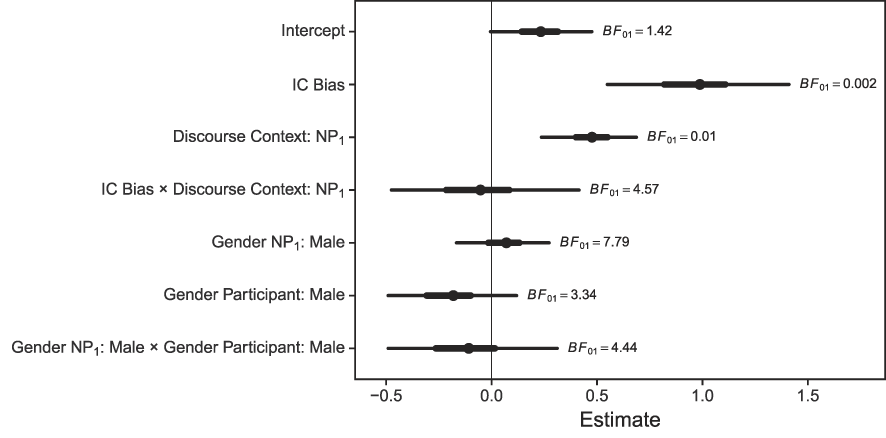
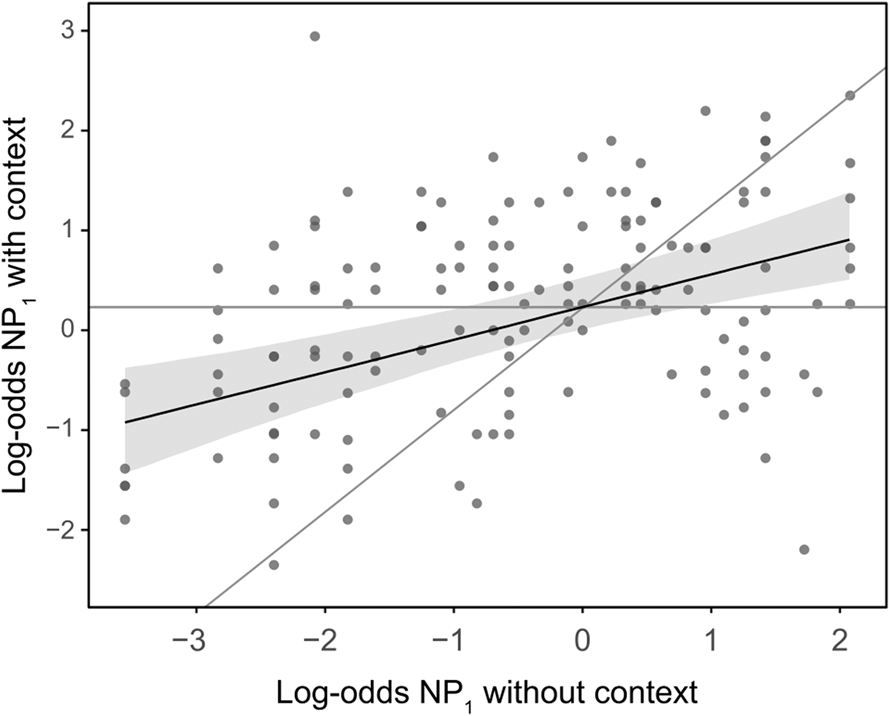
Table 4 shows the frequency of ‘NP1’, ‘NP2’, ‘both’, and ‘other’ rementions per Discourse Context. Figure 4 shows the 50% and 95% Highest Density Intervals of the posterior distributions for the effects of IC Bias and Discourse Context, and for the predictors Gender NP1, Gender Participant, and their interaction. There was very strong evidence for the effect of IC Bias (see Figure 5). However, there was also very strong evidence that the effect size of IC Bias was mitigated by the presence of a story context (regardless of the Discourse Context condition) (BF 21 < 0.0001). Figure 3 shows the two prior distributions representing H 0 (IC bias does not affect rementions in a story context) and H 2 (the effect of IC bias on rementions is unchanged by a story context), as well as the posterior distribution from the story completion analysis, and the posterior distribution from the analysis predicting sentence completion rementions from IC Biases.
Contingency table of responses by Discourse Context in Experiment 2

Posterior distributions of fixed effect estimates for Experiment 2. Dots indicate medians; thick lines indicate 50% Highest Density Intervals and thin lines indicate 95% Highest Density Intervals. BF01 indicates the Bayes Factor: the ratio between the probability of an estimate of 0 given the alternative hypothesis H1 and the probability of an estimate of 0 given the null hypothesis H0. A smaller BF01 value means more support for H1 over H0.

Scatterplot showing the effect of IC Bias (the log-odds of an NP1 remention without a story context) on the log-odds of continuing a story with an NP1 remention per story in Experiment 2. Gray shading indicates the 95% Highest Density Interval, and the black line shows the median. The horizontal gray line shows the most likely slope given H0 (IC Bias does not predict the proportion of NP1 rementions in story completion) and the diagonal gray line shows the most likely slope given H2 (IC Bias corresponds perfectly to the proportion of NP1 rementions in story completion), given the most likely intercept from the model.

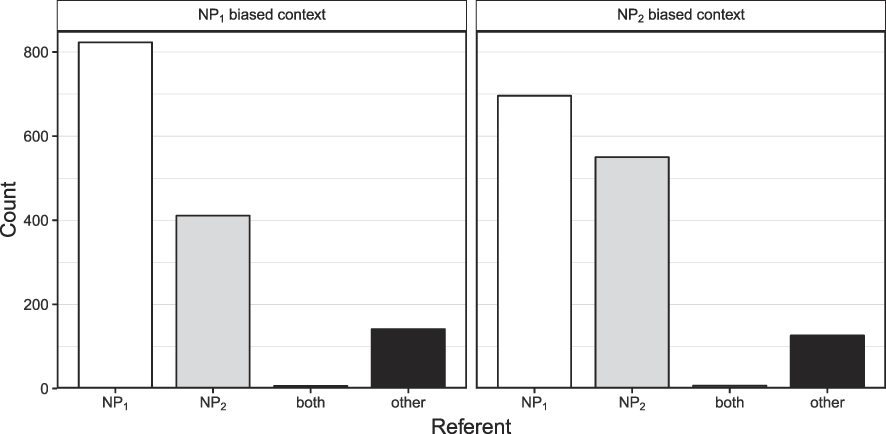
There was also very strong evidence for the effect of Discourse Context: an NP2 Discourse Context leads to a 15% (9.1 percentage points) decrease in NP1 rementions (see Figure 6). For 49 out of 71 stories, the NP1 biased version led to more NP1 rementions than the NP2 biased version. There was moderate evidence against an interaction between IC Bias and Discourse Context and against all gender-related effects (Gender NP1, Gender Participant, and their interaction).Footnote 4
Barplots showing the number of (re)mentions of each referent type per Discourse Context (NP1-biased or NP2-biased) in Experiment 2.

4. General discussion
The current study has shown that a violation of the implicit assumptions underlying the normal use of verbs leads to a difference in remention patterns. In devising explanations for interpersonal events, people are sensitive not just to verb semantics and discourse relations, but also to the discourse context in which the event is situated. These results are in line with the idea that the ICM which holds when only a minimal amount of information is provided about an event is weakened when some of the details of the event are filled in. Having more information about a situation, individuals can draw more diverse inferences, and do not need to rely on their beliefs of what is stereotypically the case when a certain type of event takes place. After embedding in a discourse context, IC bias is still a reliable predictor of remention patterns, but its predictive power is considerably diminished by knowledge about the context.
Neither the gender of the NP1 and NP2 characters, nor the gender of the participants, nor the interaction between the two gender-related variables reliably affected rementions in either of the two experiments. The lack of gender effects contrasts with two findings by Ferstl et al. (Reference Ferstl, Garnham and Manouilidou2011). First, Ferstl et al. found that participants generally – and men in particular – preferred to remention male characters. And second, they found that women preferred to remention the NP1 character more than men. They further found that verbs with a negative emotional valence were more likely to elicit rementions of the male character than the female character, but we cannot test for this effect in our data because we do not have emotional valence ratings for the German verbs.
Male participants in Experiment 1 did remention the NP1 less often than female participants did (see Figure 2), but there was too much uncertainty associated with this effect to draw strong conclusions from it. The gender effects were also small in Ferstl et al. (Reference Ferstl, Garnham and Manouilidou2011), but their study had much more statistical power to detect such small effects. In line with Hartshorne (Reference Hartshorne2014), there may be a subset of verbs for which the gender of the arguments is important. For instance, in Experiment 1, the verb verstehen ‘to understand’ was quite strongly biased towards the female character: When the NP1 was female, 83% of rementions referred to the NP1, compared with 38% when the NP1 was male. However, at present we have no account that predicts exactly which verbs should show what kind of gender effect (apart from negatively valenced verbs eliciting rementions of the male character), and verb-specific gender effects will need to be replicated before they merit more attention.
Although we have discussed a variety of manipulations that can lead to a shift in the type of explanation that is considered appropriate for a given event, the current study was not designed to answer the question of which types of contextual information are most effective in this regard. Rather, it was designed to test the more general question of whether relevant (but subtle) differences in the discourse context would lead to a difference in remention patterns. We leave it to future research to address the question of which kinds of contextual manipulation show the strongest effect on rementions.
The finding that IC biases are less predictive of rementions when embedded in a discourse context raises questions about the ecological validity of implicit causality. It is an open question to which degree listeners and readers actually rely on IC during the processing of natural discourse. In other words, in how far is implicit causality ecologically and psychologically valid, and in how far is it an artifact of the way sentence completion experiments are conducted?
The minimal discourse context utilized in sentence completion experiments is highly useful for the purpose of experimental control, but it has been criticized as a method of investigating causality attribution. Edwards and Potter (1993, p. 26) argue that “[b]y presenting people with decontextualized sentences, devoid of stake and interest and invented by the experimenter and lacking any context of discursive action, people are invited by the experimental methodology to simply confirm intrasentential semantics”. This overstates the case: neither the explanation for the eventuality nor the topic of such an explanation is deterministically related to the verb’s semantics; these have to be devised by the participant. However, it is true that sentence completion is not the best method to investigate how people generally explain interpersonal eventualities to others, if only because speakers/writers normally have more information available to them.
The fact that verb semantics are not deterministically related to explanations makes it all the more interesting that robust remention biases emerge in collections of explanations for the same verb, even though no contextual information is available to participants (apart from the characters’ names and genders). The notion of the ICM is useful in accounting for these biases. If different people have similar ‘models’ of the world on which they rely when information is scarce, it should be no surprise that they tend to explain interpersonal eventualities in a similar manner. ICMs should play less of a role when the discourse context is more informative, because information that is explicitly stated will usually override the prior conceptions that are part of the ICM (but see Molinaro, Su, & Carreiras, Reference Molinaro, Su and Carreiras2016, for an EEG study in which cultural stereotypes overrode explicit gender marking).
A potential problem with the view that a verb’s IC bias is a consequence of its associated ICM is that if each verb were associated with only one ICM, IC biases would be expected to be stronger than they are. It is more probable that verbs are typically associated with more than one ICM. To illustrate this point, consider the verb to divorce. There are various schemas concerning the grounds for a divorce. In Ferstl et al.’s (2011) sentence completion data, 26 out of 96 participants mentioned adultery, cheating, or unfaithfulness by the NP2 in their explanation (externally anchored reasons); 17 participants mentioned that the NP1 character did not love the NP2 character (anymore) (an internally anchored reason); and 5 mentioned that the NP1 and the NP2 were frequently arguing (an externally anchored reason). In addition, there were various other explanations concerning, for example, bad qualities of the NP2 and the marriage simply not functioning. Because there are various plausible internally and externally anchored reasons for participants to choose from, the verb to divorce does not have a strong remention bias, with 30% of participants rementioning the NP1, 46% rementioning the NP2, and 24% mentioning both or neither.
For to congratulate, however, the picture looks rather different. Participants almost solely gave externally anchored reasons: 95% referred to the NP2 and only 3% to the NP1 (of which two participants seemingly confused the genders of the characters). The explanations participants devised for to congratulate included, among other things, the NP2 doing well, particularly on tests (32 times), winning, often a prize or competition (26 times), having a baby (6 times), getting a job (6 times), or getting married (4 times). The main difference between to divorce and to congratulate that drives the difference in their IC biases seems to be that to congratulate is associated with a variety of similar ICMs that all provide the opportunity to elaborate on an externally anchored reason, whereas to divorce is associated with some quite diverse ICMs that allow the participants to elaborate on internal as well as external reasons. If a separate verb existed in English for a divorce where the spouse is claimed to be responsible for the failed marriage (i.e., a verb for the legal term fault divorce), this verb would be expected to pattern more like to congratulate in terms of explanation types, because ICMs pertaining to externally anchored reasons would be more salient.
However, there are also similarities between the ICMs for to divorce and to congratulate. For instance, the agent is assumed to be well informed in both cases. Although it is not impossible that the agent of to divorce was mistaken in her impression that her husband was unfaithful, the ICM assumes the agent to be correct in her assumption. And although it is possible that the agent of to congratulate has confused the patient for the actual winner, the ICM again assumes the agent not to have erred in her assumption. As our study has shown, if the assumption of well-informedness is violated, the speaker/writer who is devising an explanation is likely to prioritize this information over the externally anchored reason that drove the agent’s actions. To put it metaphorically, the verb’s IC bias exists only by virtue of the web of beliefs that constitutes the ICM being intact.
The implicit cause view can only account for these and other results, such as the effect of gender (Ferstl et al., Reference Ferstl, Garnham and Manouilidou2011), by postulating a second stage in processing, during which context can exert its influence, as Hartshorne (Reference Hartshorne2014) has done. On his account, a reader or listener initially only draws upon explicit causal information, and is biased towards a message in which the ‘implicit cause’ is rementioned as the subject of the explanation. In a second stage this bias can be overturned by incorporating all knowledge about the context, including information about the protagonists as well as information that might invalidate the a priori most likely explanations for the type of event.
Only a study that produces fine-grained temporal information about processing can address the two-stage hypothesis. However, with the relevant data pending, it is important to note that if the two-stage hypothesis holds true, sentence completion norming studies are not a reliable way of assessing the immediate influence of the verb on pronoun resolution. This is consequential because most online studies on the effect of implicit causality on pronoun resolution (e.g., Koornneef & Van Berkum, Reference Koornneef and Van Berkum2006; Pyykkonen & Järvikivi, 2010; Cozijn, Commandeur, Vonk, & Noordman, Reference Cozijn, Commandeur, Vonk and Noordman2011; Järvikivi et al., Reference Järvikivi, Van Gompel and Hyönä2017) rely on sentence completion studies precisely to determine the immediate influence of the verb on pronoun resolution. If it is true that there exists an initial bias, which is based purely on the verb’s semantic structure and which is distinguishable from the later bias that emerges when contextual information has its influence, then sentence completion norming studies cannot tell us what this initial bias is for a given verb. This is not to say that sentence completion studies are of no use; it is clear that remention biases gauged by sentence completion tasks are good predictors of online processing. However, IC bias as measured by sentence completion should not be seen as a basic lexical property of verbs, but as a complex property which is dependent on a system of beliefs about the world. The inferences needed for creating sensible continuations are not qualitatively different in sentence or story contexts. The main difference is that, in the absence of discourse context, participants in sentence completion studies need to draw upon their prior knowledge in the form of ICMs. In contrast, participants in story completion studies have more information available to them, and thus need to rely less on ICMs.
The current study cannot address the question of whether there is a separate initial stage in processing during which listeners/readers rely only on the causal potency of the arguments. We are currently trying to answer this question by means of a visual world study. However, the current study has shown that IC biases that are obtained by means of sentence completion norming studies depend on the scarcity of background information that is typical of experimental settings. As soon as relevant contextual information about protagonists, their knowledge states, preferences, and goals becomes available, the explanations that are considered most appropriate tend to change, and as reflected in modulations of the remention biases. This finding is not readily compatible with a view of IC bias (i.e., the ultimate remention bias as opposed to the hypothetical initial bias) as a consequence of implicit causes as features of the verbs. Rather, it is in line with a view of implicit causality bias in isolated sentences reflecting a lack of explanations, which are then inferred based on Idealized Cognitive Models. Thus, in discourse context, remention biases, as a proxy of implicit causality biases, reflect a complex interplay between the specific context information and more general schemata representing event knowledge.
Supplementary materials
For supplementary materials for this paper, please visit <http://doi.org/10.1017/langcog.2018.17>.
Appendix A
Bayes factors on the basis of the Savage–Dickey density ratio
The Savage–Dickey density ratio was calculated at an estimate of 0, using a Student-t distribution as a prior with μ = 0 and ν = 5. If the value of Bayes factor BF 01 is greater than 1, this means that there is stronger support for the null-hypothesis H 0 (the size of the effect is zero) than for the alternative hypothesis H 1 (the size of the effect is non-zero). In other words, if BF 01 is greater than 1, then the effect size estimates are so close to 0 (and/or so imprecise) that the probability of the effect size being 0 given our data is even greater than the probability we assigned to the effect size being 0 a priori, given the hypothesis that there is indeed no effect. Note that BF 01 being greater than 1 does not mean that the effect size is indeed equal to 0. It could simply be so close to 0 that a larger sample size is needed to distinguish it from zero with high certainty.
If the value of BF 01 is smaller than 1, that means there is stronger support for H 1. Values of BF 01 between  ${1 \!\left/{\vphantom{1 3}}\right.3}$ and 1 on the one hand, and between 1 and 3 on the other, are considered anecdotal evidence for H 1 and H 0 respectively; values between
 ${1 \!\left/{\vphantom{1 {10}}}\right.{10}}$ and
 ${1 \!\left/{\vphantom{1 3}}\right.3}$ (or 3 and 10) constitute moderate evidence; values between
 ${1 \!\left/{\vphantom{1 {30}}}\right.{30}}$ and
 ${1 \!\left/{\vphantom{1 {10}}}\right.{10}}$ (or 10 and 30) constitute strong evidence; and values below
 ${1 \!\left/{\vphantom{1 {30}}}\right.{30}}$(or above 30) constitute very strong evidence (Lee & Wagenmakers, Reference Lee and Wagenmakers2014, citing Jeffreys, Reference Jeffreys1961). To check whether our conclusions heavily depended on our choice of prior, we also calculated Bayes factors with a less informative prior Student-t distribution in which μ = 0 and ν = 0.5, and with a more informative prior Student-t distribution in which μ = 0 and ν = ∞ (i.e., a normal distribution with μ = 0 and σ = 1). We only report results that diverge from the analysis with the original choice of prior.
Appendix B
Remention counts in Experiment 1