





1. Introduction
The first millisecond pulsar was initially identified as an object of interest based on its steep radio spectrum and the fact that it scintillates, and then was later confirmed with timing measurements (Backer et al. Reference Backer, Kulkarni, Heiles, Davis and Goss1982). Searches for globular cluster pulsars were motivated by the combination of the excess in the number of X-ray binaries in globular clusters relative to field star populations (Clark Reference Clark1975; Katz Reference Katz1975) due to dynamical formation mechanisms (Fabian et al. Reference Fabian, Pringle and Rees1975; Hills Reference Hills1976; Verbunt Reference Verbunt1987) and the understanding that millisecond pulsars are recycled in low mass X-ray binaries (Smarr & Blandford Reference Smarr and Blandford1976; Alpar et al. Reference Alpar, Cheng, Ruderman and Shaham1982). The initial discovery of a millisecond pulsar in a globular cluster was made in the cluster M28, first via imaging (Mahoney & Erickson Reference Mahoney and Erickson1985) and then confirmed by timing (Lyne et al. Reference Lyne, Brinklow, Middleditch, Kulkarni and Backer1987), and this led to a series of imaging searches of globular clusters for point sources, both steep spectrum and otherwise, as well as timing searches for pulsars (Johnston et al. Reference Johnston, Kulkarni and Goss1991).
In recent years, this process has begun to repeat itself, as radio telescopes have upgraded their bandwidths to become more sensitive and new facilities have been built. Image-plane searches for pulsars have turned up a new pulsar in the Galactic Center region (Bhakta et al. Reference Bhakta, Deneva, Frail, de Gasperin, Intema, Jagannathan and Mooley2017), as well as a large number of additional candidates (Pattie et al. Reference Pattie2024), including further out in the Bulge (Frail et al. Reference Frail2024). New imaging searches in globular clusters have led to the discovery of a pulsar in the highly reddened cluster GLIMPSE C01 (McCarver et al. Reference McCarver2024), as well as new candidate pulsars in Terzan 5 (Urquhart et al. Reference Urquhart2020, Reference Urquhart, Strader, Chomiuk, Ransom, Heinke, Bahramian and Maccarone2026) and a pulsar localised via variability in 47 Tuc (Heywood Reference Heywood2023) that had previously been found, but not localised, with timing data as a redback system that only rarely has uneclipsed emission (Camilo et al. Reference Camilo, Lorimer, Freire, Lyne and Manchester2000; Ridolfi et al. Reference Ridolfi2016).
At the present time, in many of the nearest clusters, existing pulsar timing data are already quite sensitive. It is most likely, then, that some of the pulsars which have not yet been identified are in binaries in which interactions between the pulsar wind and the donor star can lead to substantial column densities of ionised gas within the binaries, which effectively eclipse the pulsar. This supposition is borne out by the fact that many of the recent discoveries in these clusters are black widow or redback pulsars (Roberts Reference Roberts and van Leeuwen2013) – collectively known as ‘spider’ binaries. An alternative possibility is that some of the yet-undiscovered binary pulsars are in binaries with unusual orbital parameters, such that their accelerations are larger than currently searched computationally. For example, the highly eccentric binary pulsar in NGC 6652 was only found because of an intensive search motivated by Fermi-band GeV emission (DeCesar et al. Reference DeCesar, Ransom, Kaplan, Ray and Geller2015), and more systems like it could be identified by radio continuum imaging, as well.
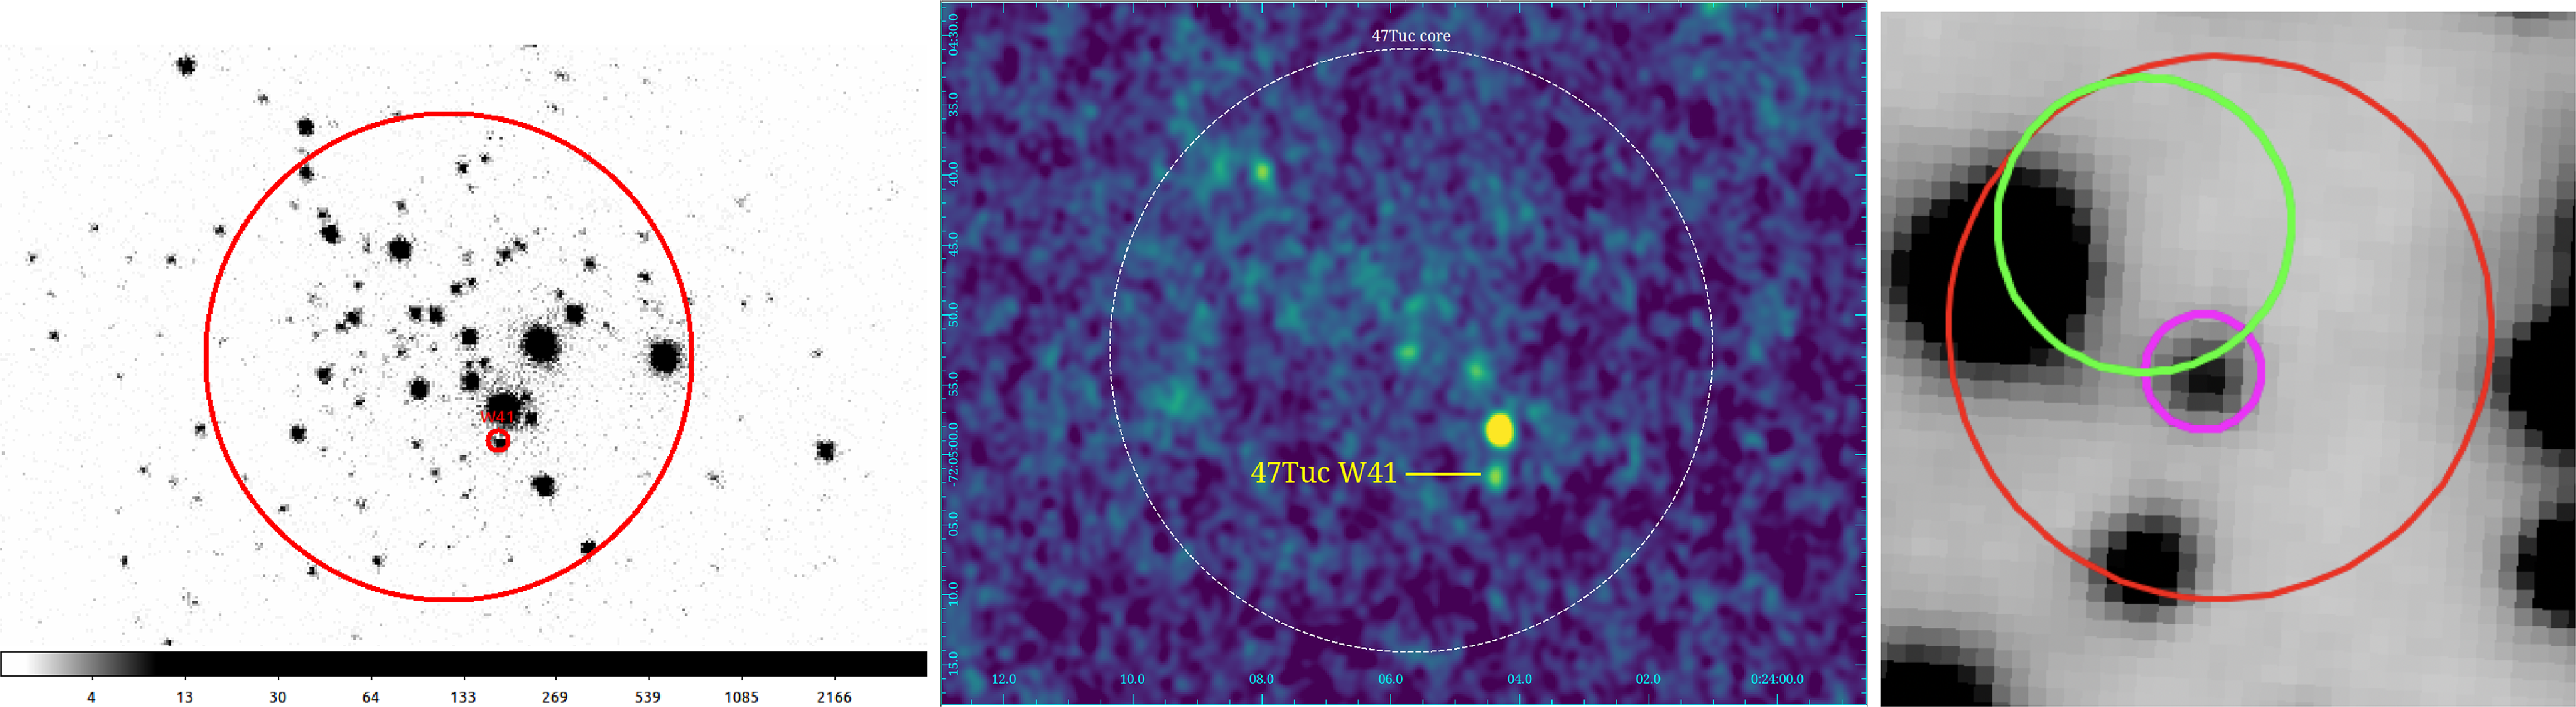
Left: The summed X-ray image from Chandra, with the large red circle representing the core radius, and the smaller circle a 1" circle around W41. Centre: the ATCA image of 47 Tuc showing the core radius and the location of W41. Right:Finding chart of W41 in the F300X filter, zoomed in considerably relative to the other two images. The red circle is the 95% Chandra error circle as given in Bhattacharya et al. (Reference Bhattacharya, Heinke, Chugunov, Freire, Ridolfi and Bogdanov2017). The green circle represents the
 $1\sigma$
radio uncertainty. The magenta circle indicates the position of the F300X counterpart.

Discoveries via continuum imaging can also lead directly to information about the systems’ optical counterparts. In the globular cluster NGC 6397, a steep spectrum radio source (Zhao et al. Reference Zhao2020) was identified as a pulsar candidate. It was then found to be associated with a binary star with a measurable orbital period of just under 2 days (Pichardo Marcano et al. Reference Pichardo Marcano, Rivera Sandoval, Maccarone, Zhao and Heinke2021) and finally, making use of the knowledge of the orbit of the binary, radio pulsations were confirmed from the system (Zhang et al. Reference Zhang2022).
A new generation of imaging surveys of globular clusters has been primarily motivated by the searches for intermediate mass and stellar mass black holes (Maccarone Reference Maccarone2004, Reference Maccarone2005; Strader et al. Reference Strader, Chomiuk, Maccarone, Miller-Jones, Seth, Heinke and Sivakoff2012; Miller-Jones et al. Reference Miller-Jones2015; Tremou et al. Reference Tremou2018), and for this reason has been undertaken at higher frequencies (4–10 GHz) than normally used for pulsar searches (
 $\sim$
 $0.5$
–3 GHz). The most extensive of these surveys is MAVERIC (Shishkovsky et al. Reference Shishkovsky2020; Tudor et al. Reference Tudor2022), which observed 50 Galactic globular clusters with deep Karl G. Jansky Very Large Array (VLA) or Australia Telescope Compact Array (ATCA) imaging. Despite the non-ideal frequency coverage for pulsar searches, owing to the depth of the images, MAVERIC identified a large number of previously unknown steep spectrum radio sources in its clusters that await further optical and radio-timing follow-up. Even deeper data than MAVERIC have been obtained for 47 Tuc (Paduano et al. Reference Paduano2024) and
 $\omega$
Cen (Mahida et al. Reference Mahida, Bahramian, Miller Jones, Sett, Dage, Strader, Galvin and Paduano2026), which are sensitive to faint pulsars in these clusters.
47 Tuc has one of the largest and best-studied pulsar populations of any globular cluster. It has 42 known pulsars, second only to Terzan 5 (Freire Reference Freire2026), most of which have been discovered in batches as new data sets and/or computational capabilities have been obtained (Manchester et al. Reference Manchester, Lyne, D’Amico, Johnston, Lim and Kniffen1990, Reference Manchester, Lyne, Robinson, D’Amico, Bailes and Lim1991; Camilo et al. Reference Camilo, Lorimer, Freire, Lyne and Manchester2000; Lorimer et al. Reference Lorimer, Camilo, Freire, Kramer, Lyne, Manchester, D’Amico, Bailes, Nice and Thorsett2003; Pan et al. Reference Pan, Hobbs, Li, Ridolfi, Wang and Freire2016; Ridolfi et al. Reference Ridolfi2021; Chen et al. Reference Chen2026). Extensive optical (Edmonds et al. Reference Edmonds, Gilliland, Heinke, Grindlay and Camilo2001, Reference Edmonds, Gilliland, Camilo, Heinke and Grindlay2002, Reference Edmonds, Gilliland, Heinke and Grindlay2003; Rivera Sandoval et al. Reference Rivera Sandoval2015) and X-ray (Bogdanov et al. Reference Bogdanov, Grindlay, Heinke, Camilo, Freire and Becker2006) follow-up has been done on the known pulsars, with several showing strong optical/UV variability that helped ensure that the right counterpart had been identified.
In this Letter, we present evidence that the object 47 Tuc W41 (Edmonds et al. Reference Edmonds, Gilliland, Heinke and Grindlay2003), located at an X-ray position of RA
 $= 00^{\mathrm{h}}24^{\mathrm{m}}04{\overset{\mathrm{s}}{.}}3351$
and Dec
 $= -72^\circ05'01\overset{''}{.}451$
(Chandra Source Catalog v2.1; Evans et al. Reference Evans2024) which had previously been suggested to be a coronally active binary (Albrow et al. Reference Albrow2001; Edmonds et al. Reference Edmonds, Gilliland, Heinke and Grindlay2003), is actually a pulsar binary. We discuss implications for searches for additional systems of this nature.
2. Data
2.1. Radio data
The source is detected in deep radio imaging of 47 Tuc from ATCA. The data consist of about 480 h of imaging of the cluster taken mostly in 2021 and 2022, with a noise level of about 1
 $\unicode{x03BC}$
Jy/beam at both 5.5 and 9 GHz. The full data reduction and analysis procedure is outlined in Paduano et al. (Reference Paduano2024).
The radio source is located at RA
 $= 00^{\mathrm{h}}24^{\mathrm{m}}04{\overset{\mathrm{s}}{.}}3471$
and Dec
 $= -72^\circ05'01\overset{''}{.}193$
, with a localisation uncertainty of
 $0\overset{''}{.}07$
in the RA and
 $0\overset{''}{.}15$
in the Dec co-ordinate. This radio source is
 $0\overset{''}{.}26$
from the X-ray coordinates of W41, within the reported
 $0\overset{''}{.}3$
uncertainty circle of the X-ray localisation in the Chandra Source Catalog (Figure 1). Given 75 X-ray sources within the 24" cluster core, the probability of an X-ray source lying within
 $0.26"$
of a radio source is only 0.9%, so it is highly likely that the radio and X-ray sources are associated.
This source exhibits a likely steep spectrum, with flux densities of
 $9.8\pm1.4\;\unicode{x03BC}$
Jy at 5.5 GHz and
 $3.9\pm0.9\;\unicode{x03BC}$
Jy at 9 GHz. The best estimate of the spectral index for the source (where the spectrum scales as
 $\nu^\alpha$
) is
 $\alpha=-1.8\pm0.4$
, and a flat spectrum can be ruled out at
 $4\sigma$
.
2.2. Optical and NUV data
In this paper we have used data from the Hubble Space Telescope in the filters F435W (B), F658N (
 $H\alpha$
) and F635W (R), which were acquired under programme GO 9281 with ACS-WFC in 2002 September 30, 2002 October 2/3 and 2002 October 11 (PI: Grindlay). We also used NUV data in the filters F390W and F300X acquired under the GO 12950 programme with WFC3 on August 13, 2013 (PI: Heinke). Astrometry for the optical and NUV data was performed as in Rivera Sandoval et al. (Reference Rivera Sandoval2015). Photometry for the NUV images, together with extinction coefficients in the corresponding filters, was obtained as described in Rivera Sandoval et al. (Reference Rivera Sandoval2018). PSF photometry for the optical images was also obtained with the DOLPHOT software package (Dolphin Reference Dolphin2016) using the individual FLC images.
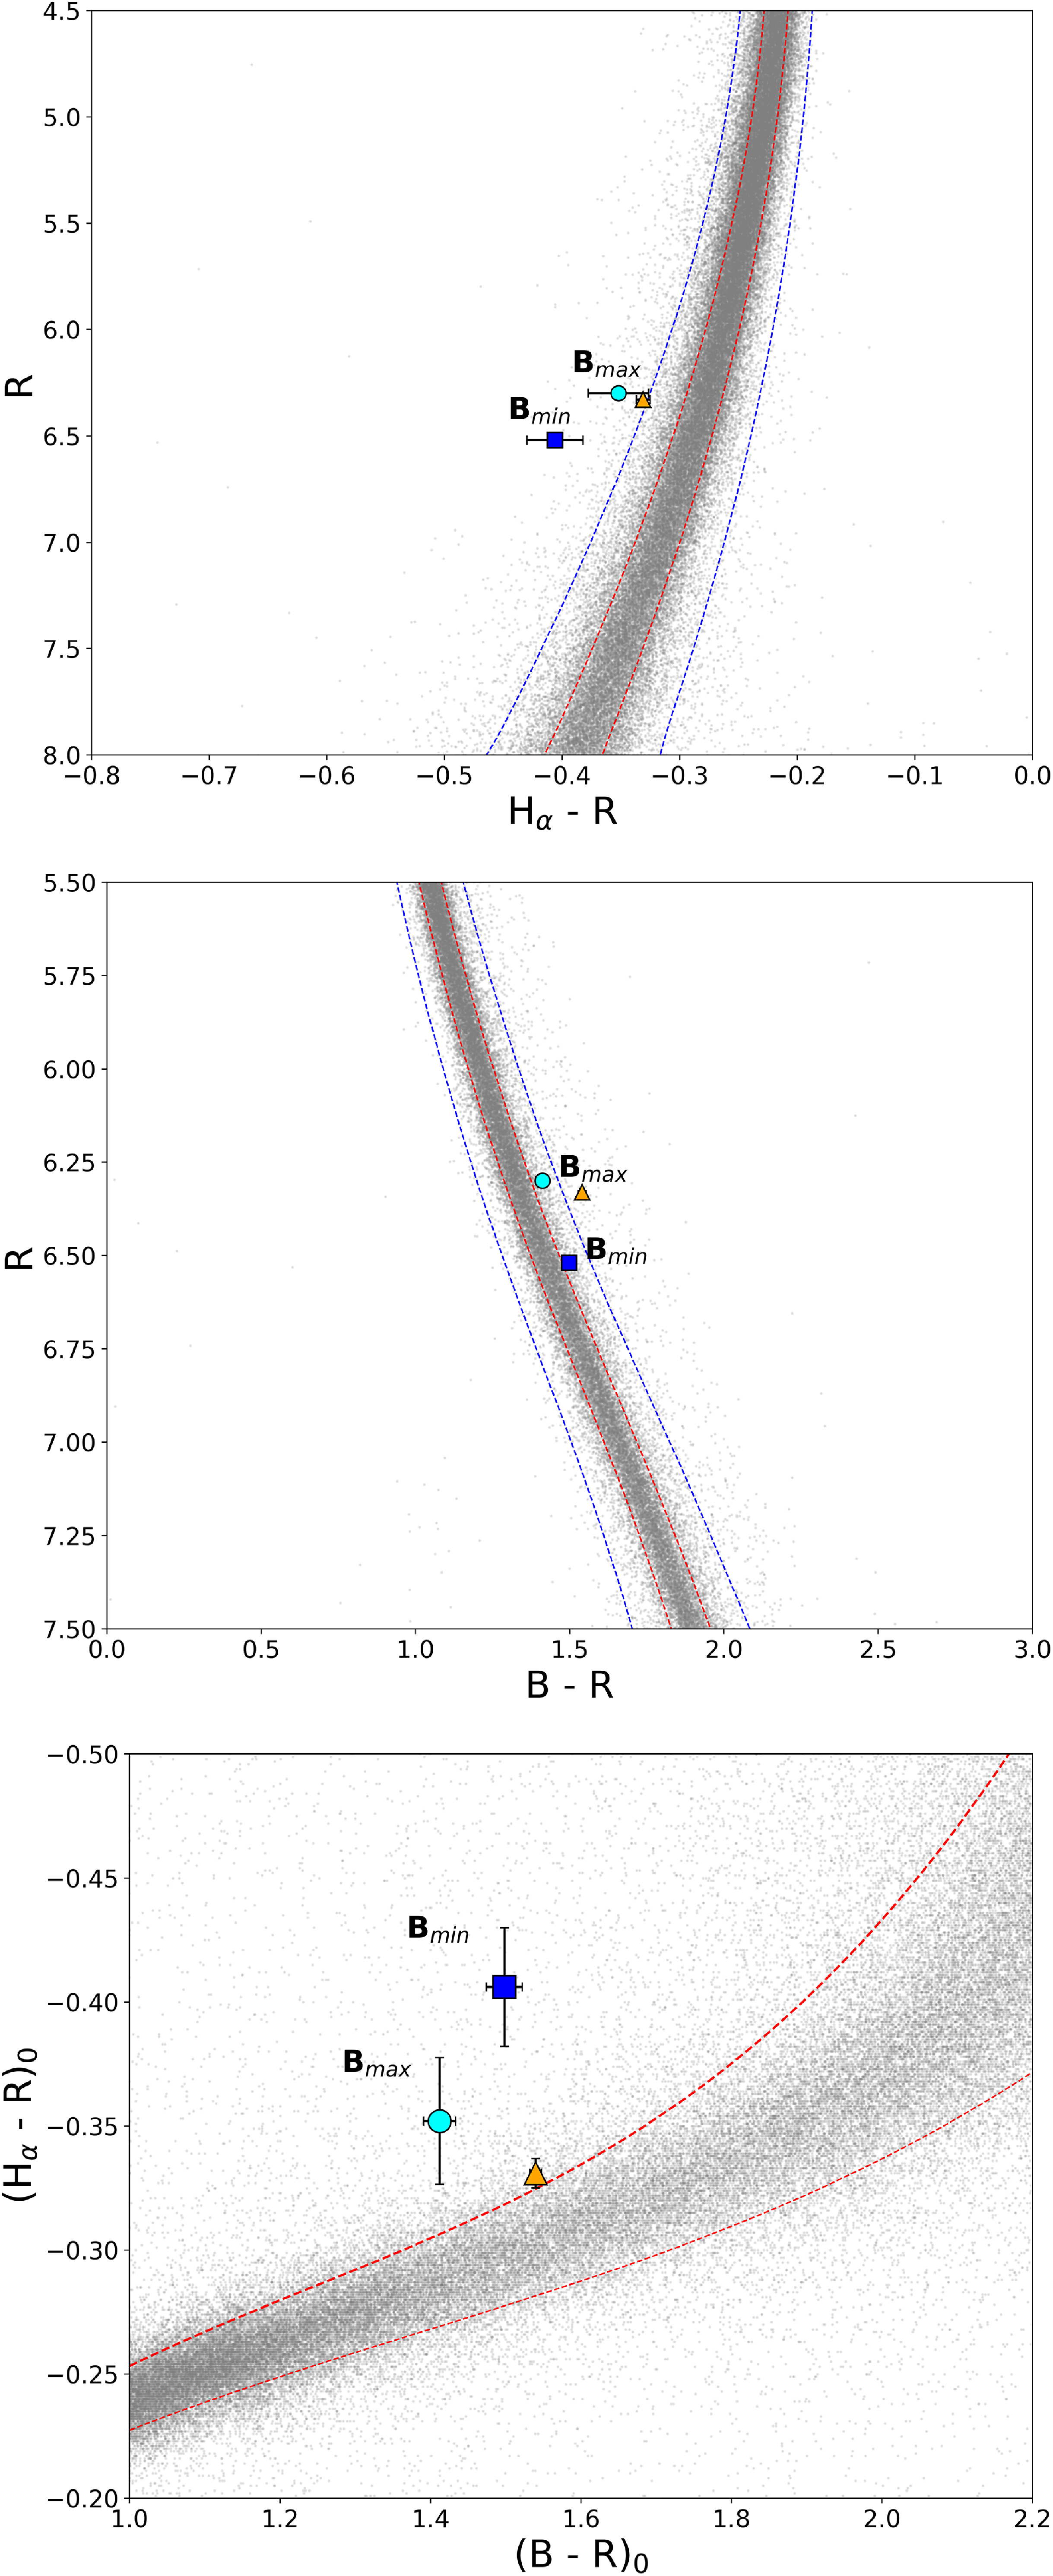
Colour magnitude diagrams (CMD) with the position of W41 in the different bands are shown in Figures 2 and 3. The binary shows a small H
 $\alpha$
excess in the H
 $\alpha$
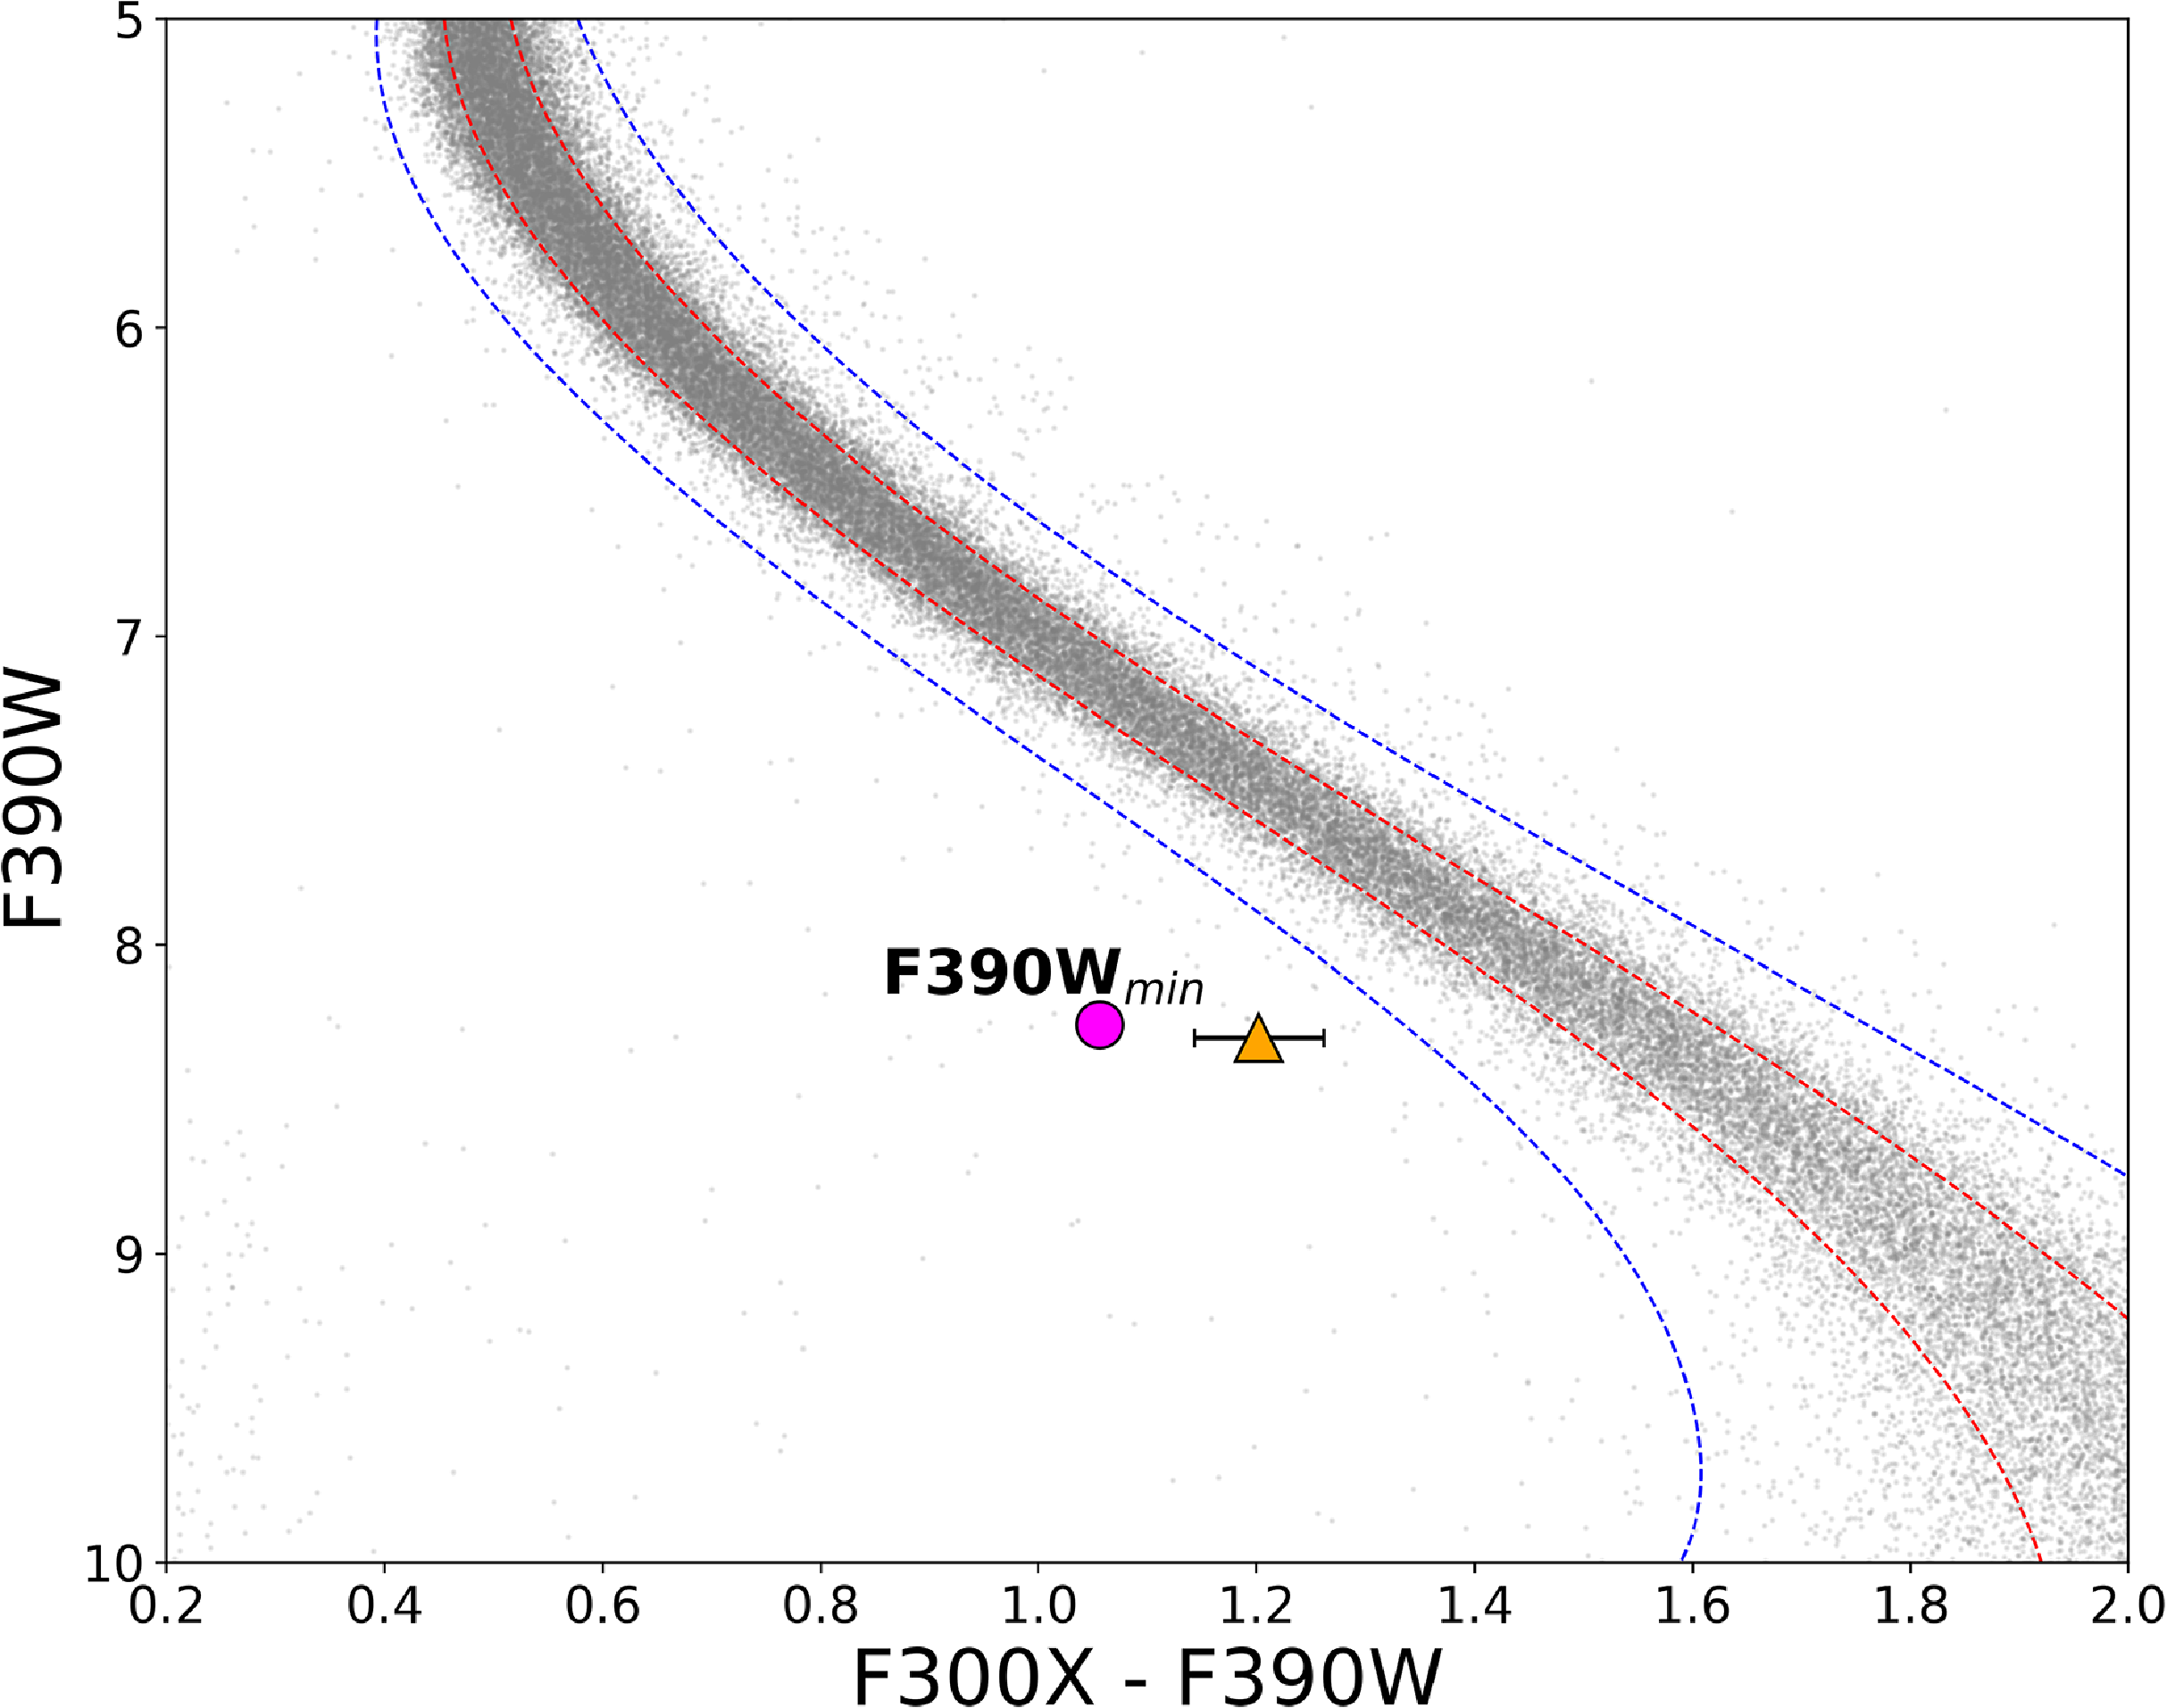
-R vs R CMD and on the colour-colour diagram. It was clearly detected on the binary sequence of the B-R vs R CMD. In the NUV, the binary shows a blue colour which indicates a substantial contribution from a hotter component.
Dereddened optical CMDs and colour-colour diagram of 47 Tuc. The blue and red lines around the main sequence indicate the 1 and 3
 $\sigma$
dispersion limits from the main sequence ridgeline. The average magnitude of W41 is marked with an orange triangle. The blue square and cyan circle refer to points taken at the same phase, taking as a reference the min and max phase in the B band light curve. The system has an H
 $\alpha$
excess relative to other stars of the same B-R colour, and a broader continuum, with an R band excess.

Dereddened F300X – F390W vs F390W CMD of 47 Tuc. The average magnitude of W41 is marked with an orange triangle. The magenta circle refers to points taken at the same phase, taking as a reference the min phase in the F390W band light curve.

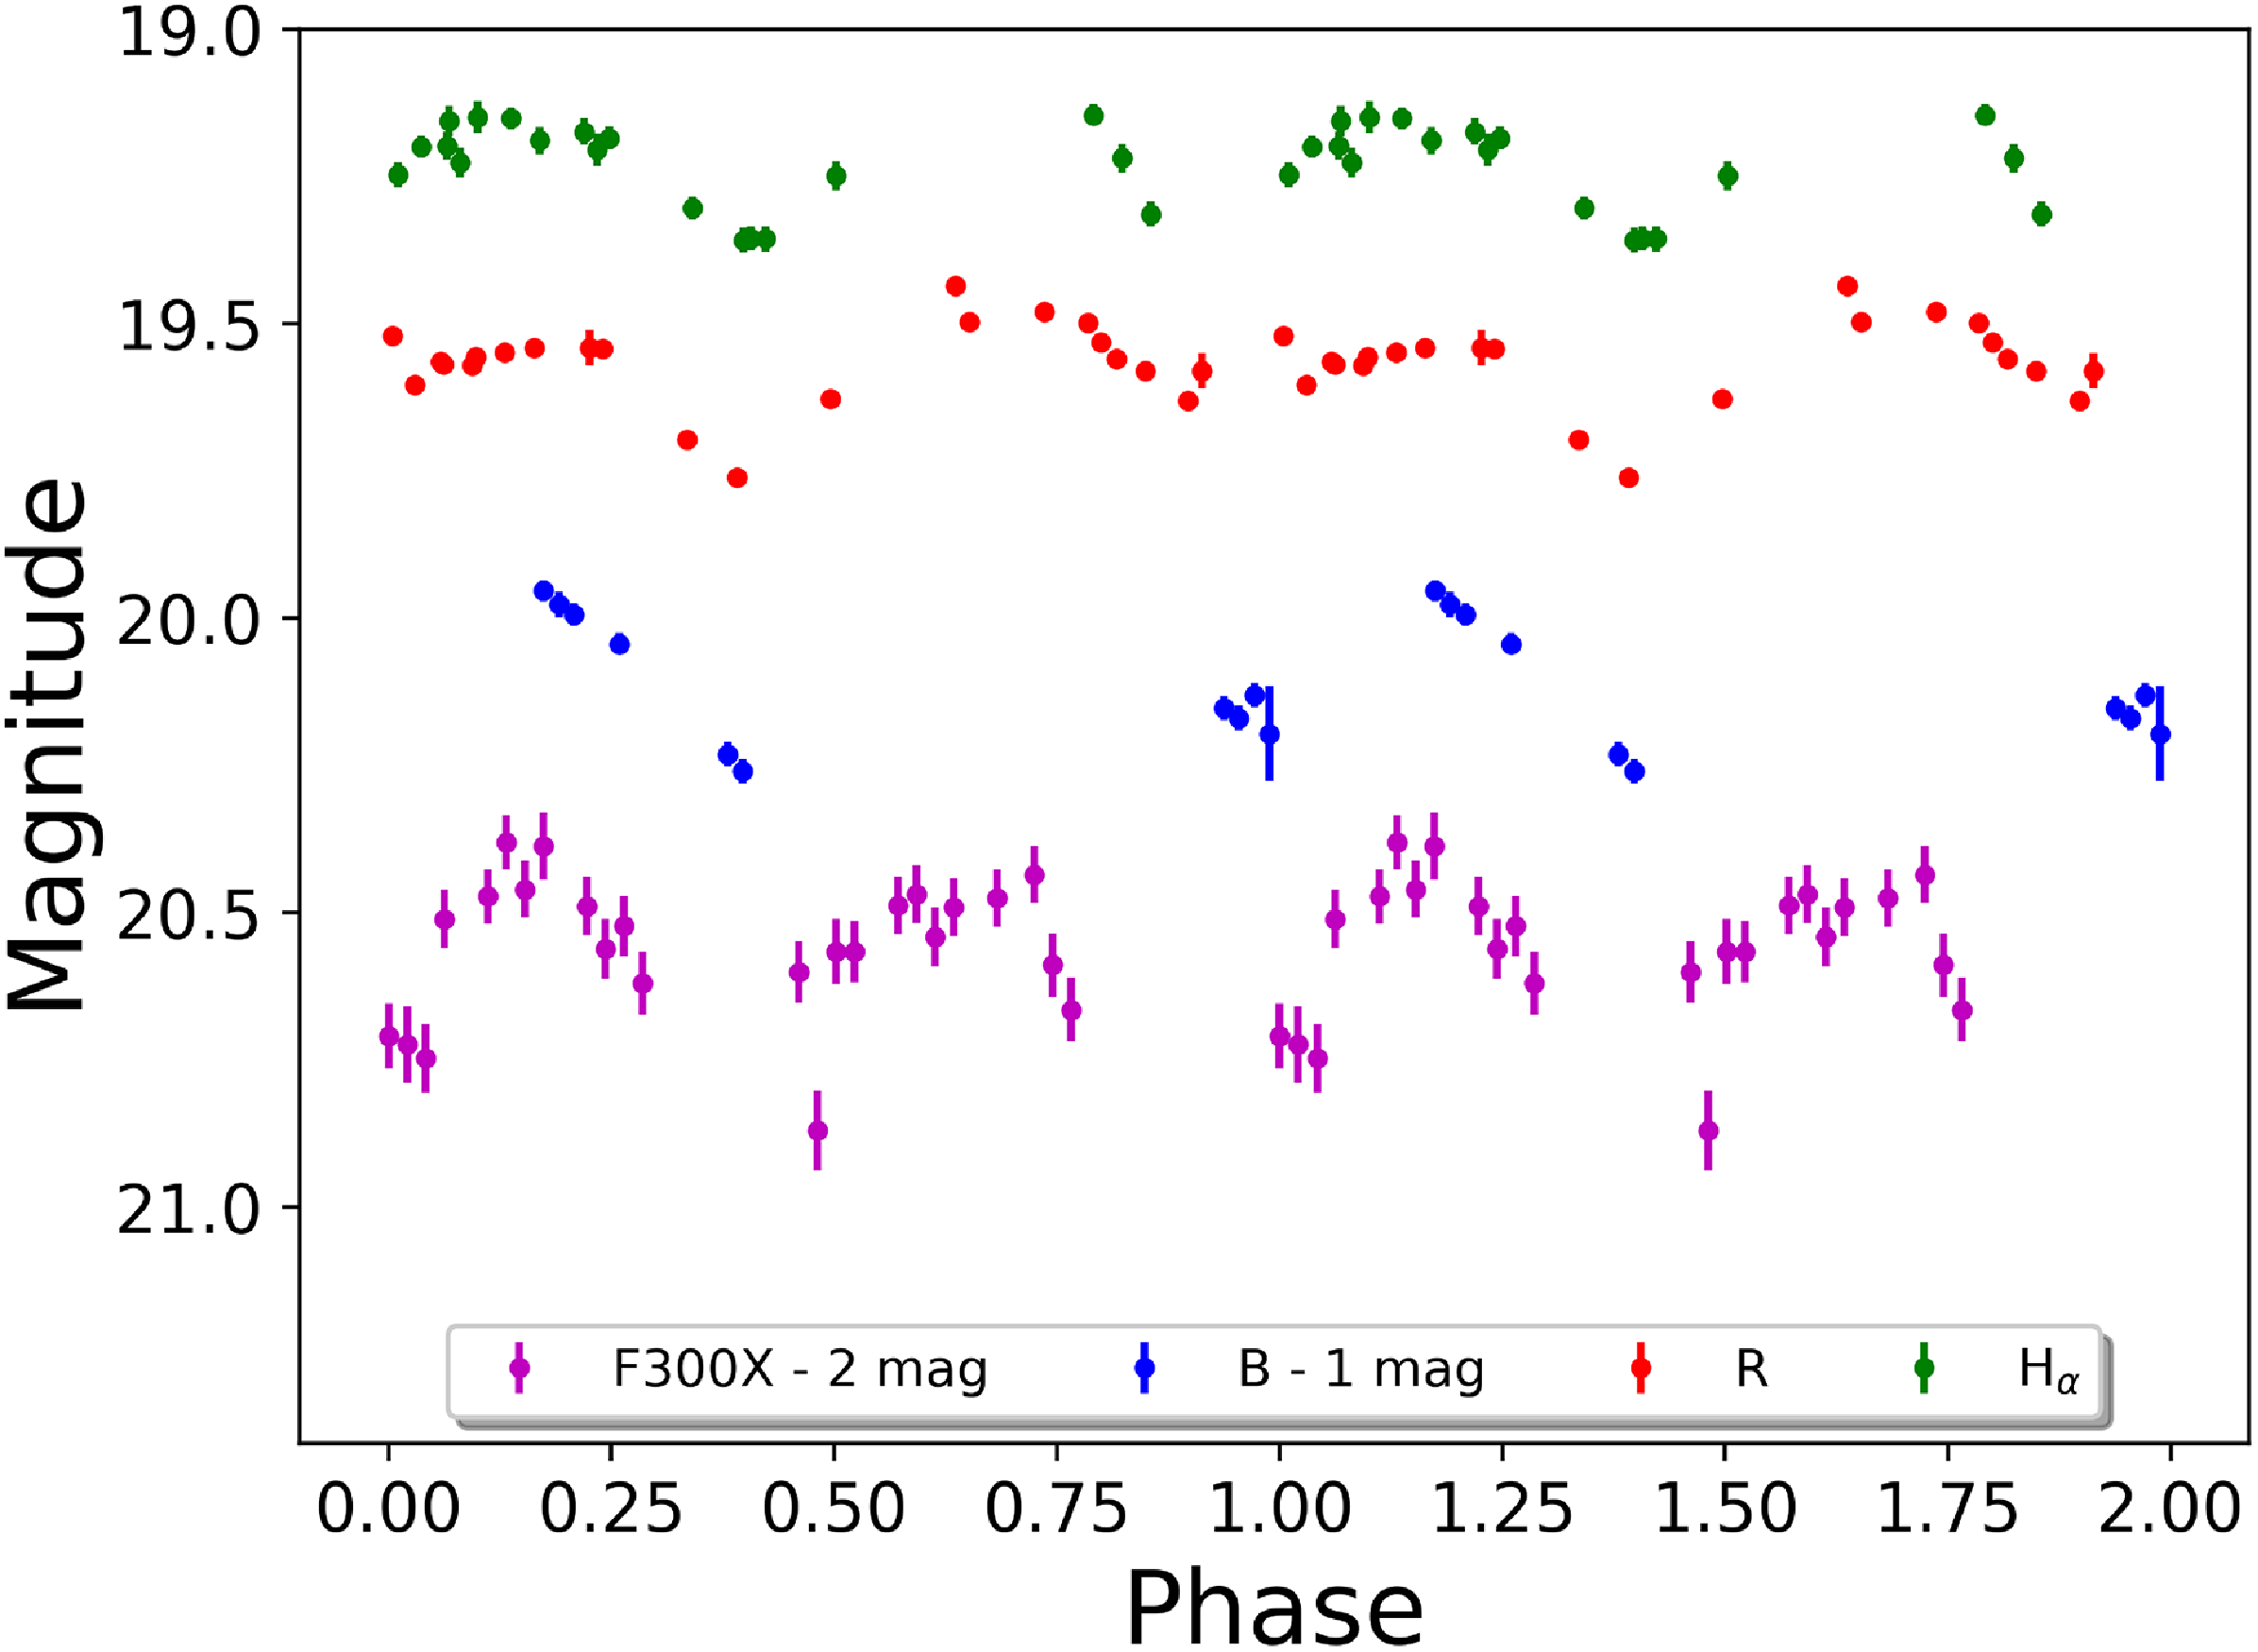
Light curves in the different filters are presented in Figure 4. They were folded at the 0.4145 d orbital period found by Albrow et al. (Reference Albrow2001), using as T0 the date of the first measurement in the F300X data. All measurements obtained by Dolphot are displayed. The modulation is observed in all filters.
Dereddened light curves of the optical counterpart to W41. These light curves were folded at the
 $0.4145$
d period identified by Albrow et al. (Reference Albrow2001). For clarity, the phase is plotted twice.

2.3. X-ray data
47 Tuc has been extensively observed by Chandra (more than 500 ks with ACIS and 700 ks with HRC). While W41 is relatively faint, it is clearly detected in most Chandra observations. Thus, we extract spectra from all Chandra/ACIS observations with exposure
 $\geq 10$
ks (to ensure reliable spectral extraction).
All Chandra data were reduced and reprocessed using ciao (version 4.14 CalDB 4.9.8, Fruscione et al. Reference Fruscione, David and Rodger2006), with spectra extracted via specextract assuming a circular extraction region with a radius of
 $1.1''$
centred on the source, and a background annulus with inner and outer radii of 2″ and 10″, respectively, with all detected sources within and close to this region excluded from extraction. The background selection is to make sure to consider the elevated background levels in the core of 47 Tuc due to crowding. We then combined the extracted spectra (and associated files) with combine_spectra, and binned spectra with at least one background count per bin.
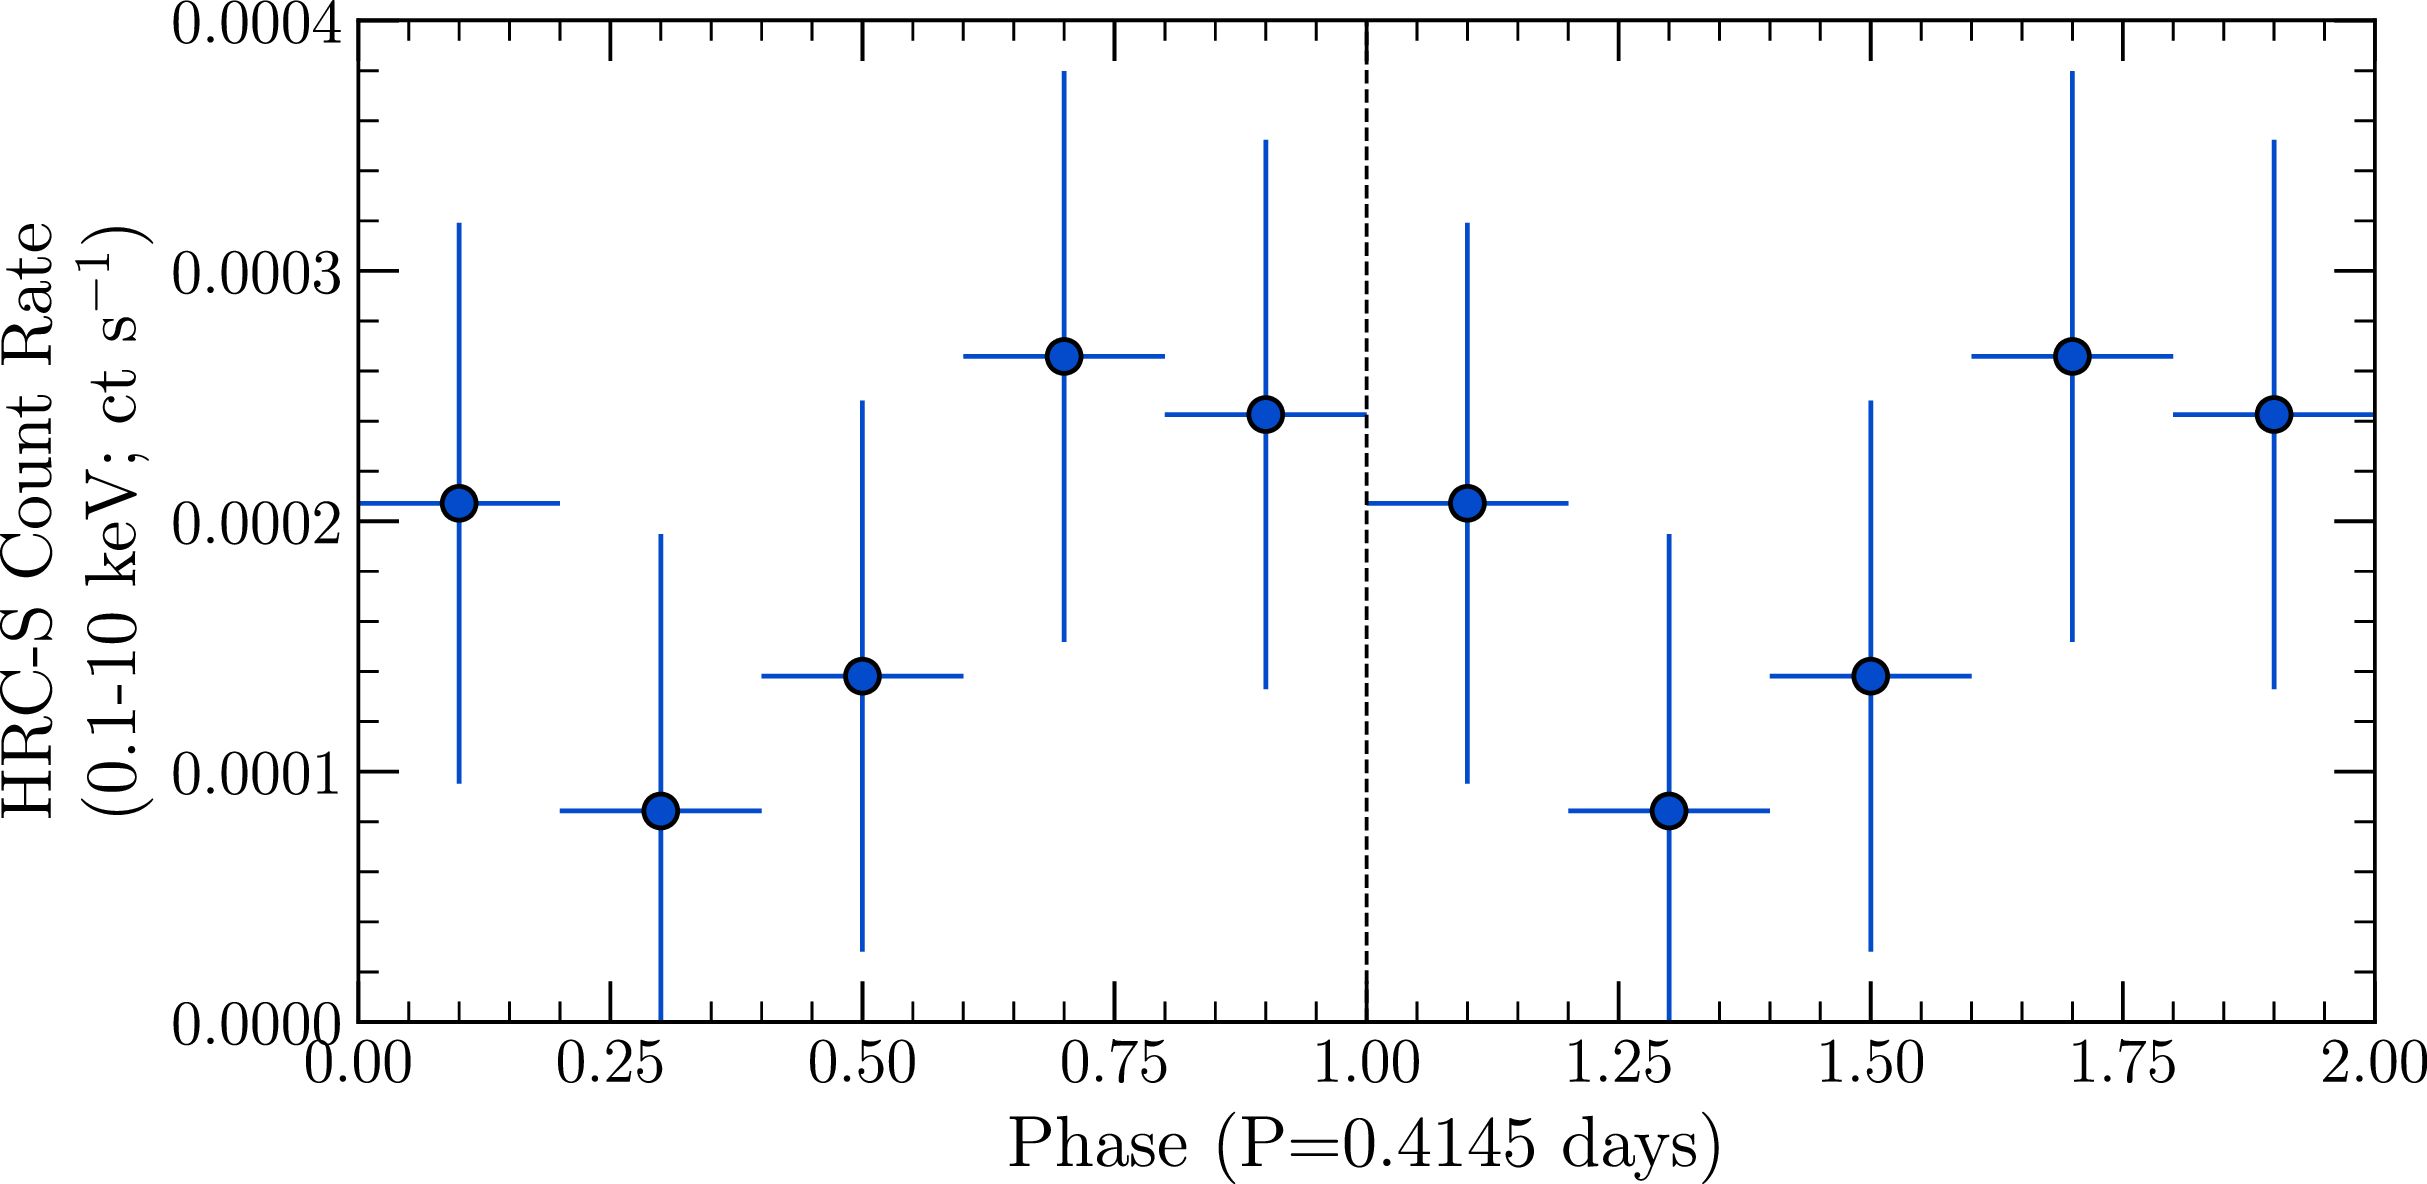
Chandra/HRC data were first barycenter-corrected (using axbary), re-projected and stacked (with reproject_obs). Background-subtracted light curves were extracted using dmextract, assuming Gehrels uncertainties (Gehrels Reference Gehrels1986). The light curve from the Chandra data is shown folded on the orbital period in Figure 6. It shows statistically marginal evidence for this periodicity.
3. Analysis
3.1. X-ray spectral analysis
We performed spectral analysis with Xspec (version 12.12.1c, Arnaud Reference Arnaud, Jacoby and Barnes1996) and Bxa (version 4.0.5, Buchner et al. Reference Buchner2014) with the w-statistic (Cash Reference Cash1979, assuming a Poisson process for the background), abundances of elements based on Wilms et al. (Reference Wilms, Allen and McCray2000), and photo-electric cross-sections based on Verner et al. (Reference Verner, Ferland, Korista and Yakovlev1996). Modelling the spectrum with an absorbed power-law model (tbabs*pegpwrlw in Xspec), we assumed the following priors: a Gaussian prior on hydrogen column density (N
 $_{\textrm{H}}$
) based on the hydrogen column density towards 47 Tuc (
 $3.5\pm0.2\times10^{20}$
cm
 $^{-2}$
, Salaris et al. Reference Salaris, Held, Ortolani, Gullieuszik and Momany2007; Bahramian et al. Reference Bahramian, Heinke, Degenaar, Chomiuk, Wijnands, Strader, Ho and Pooley2015; Foight et al. Reference Foight, Güver, Özel and Slane2016), uniform prior on photon index (
 $\Gamma$
) with lower and upper bounds of 0 and 5, respectively, and a log-uniform prior on power-law normalisation (i.e. unabsorbed flux in the 0.5–10 keV band) with lower and upper bounds of
 $10^{-17}$
and
 $10^{-10}$
erg s
 $^{-1}$
cm
 $^{-2}$
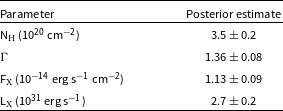
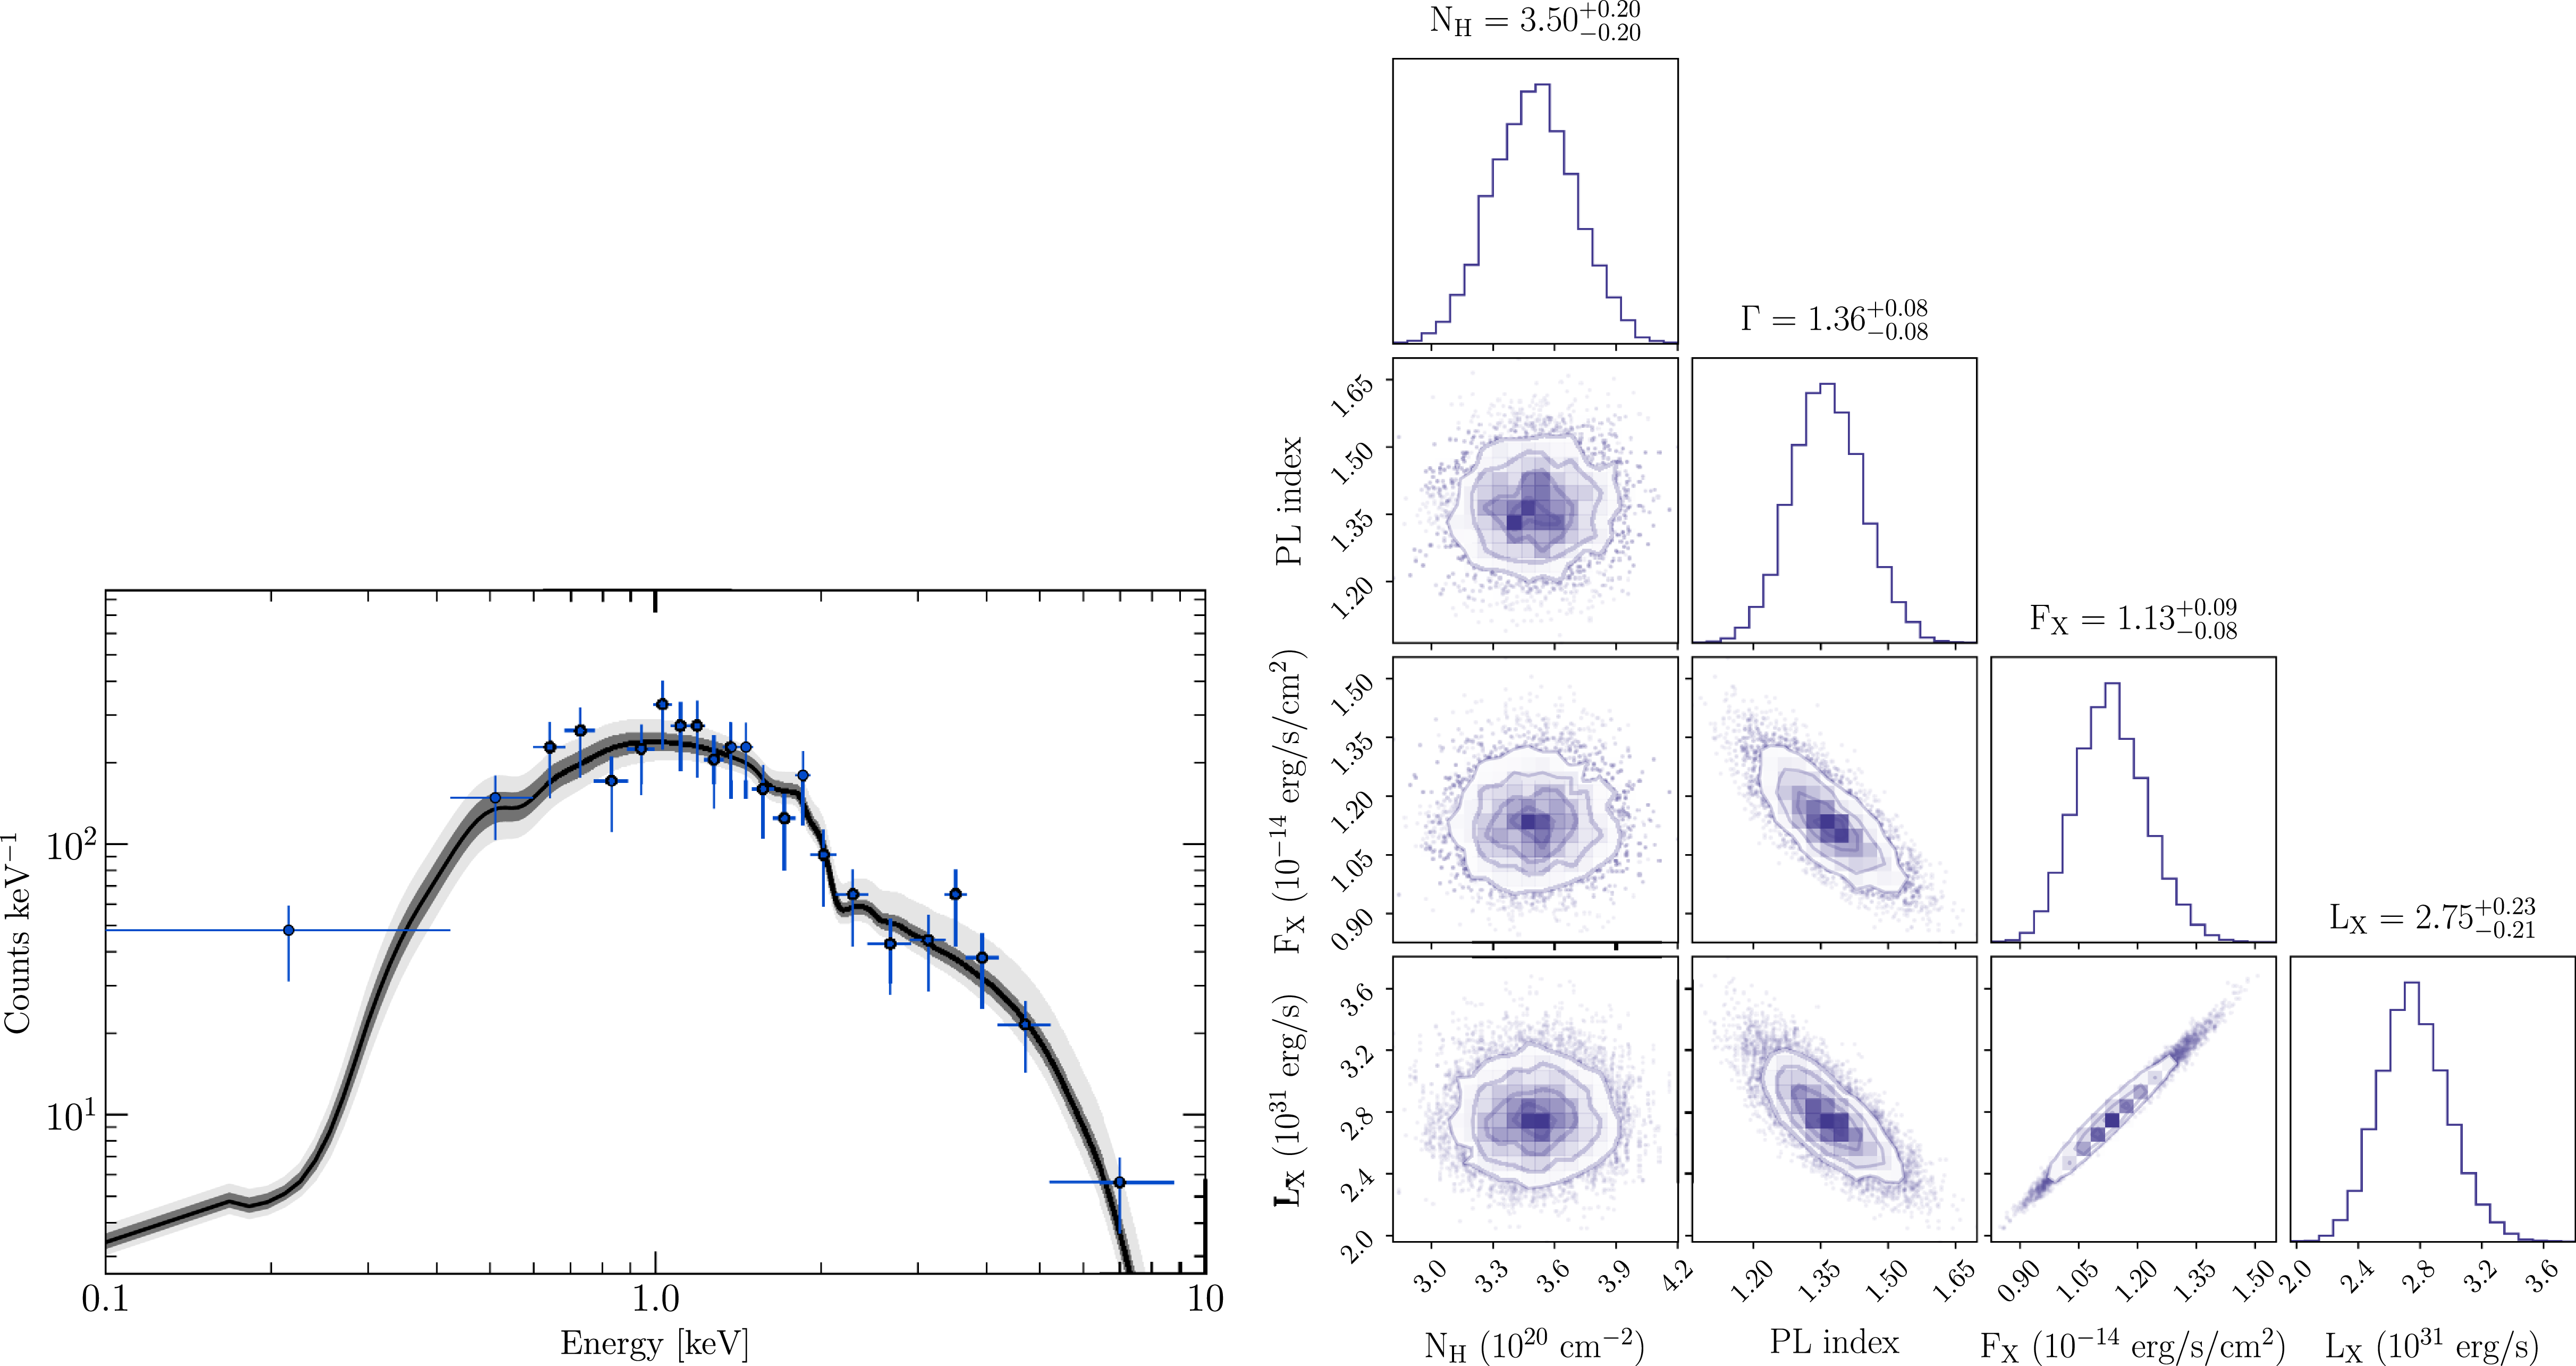
. Posterior estimates for model parameters are tabulated in Table 1. The spectrum and pairwise distributions of the posterior samples are visualised in Figure 5.
3.2. Light curve modelling and companion properties
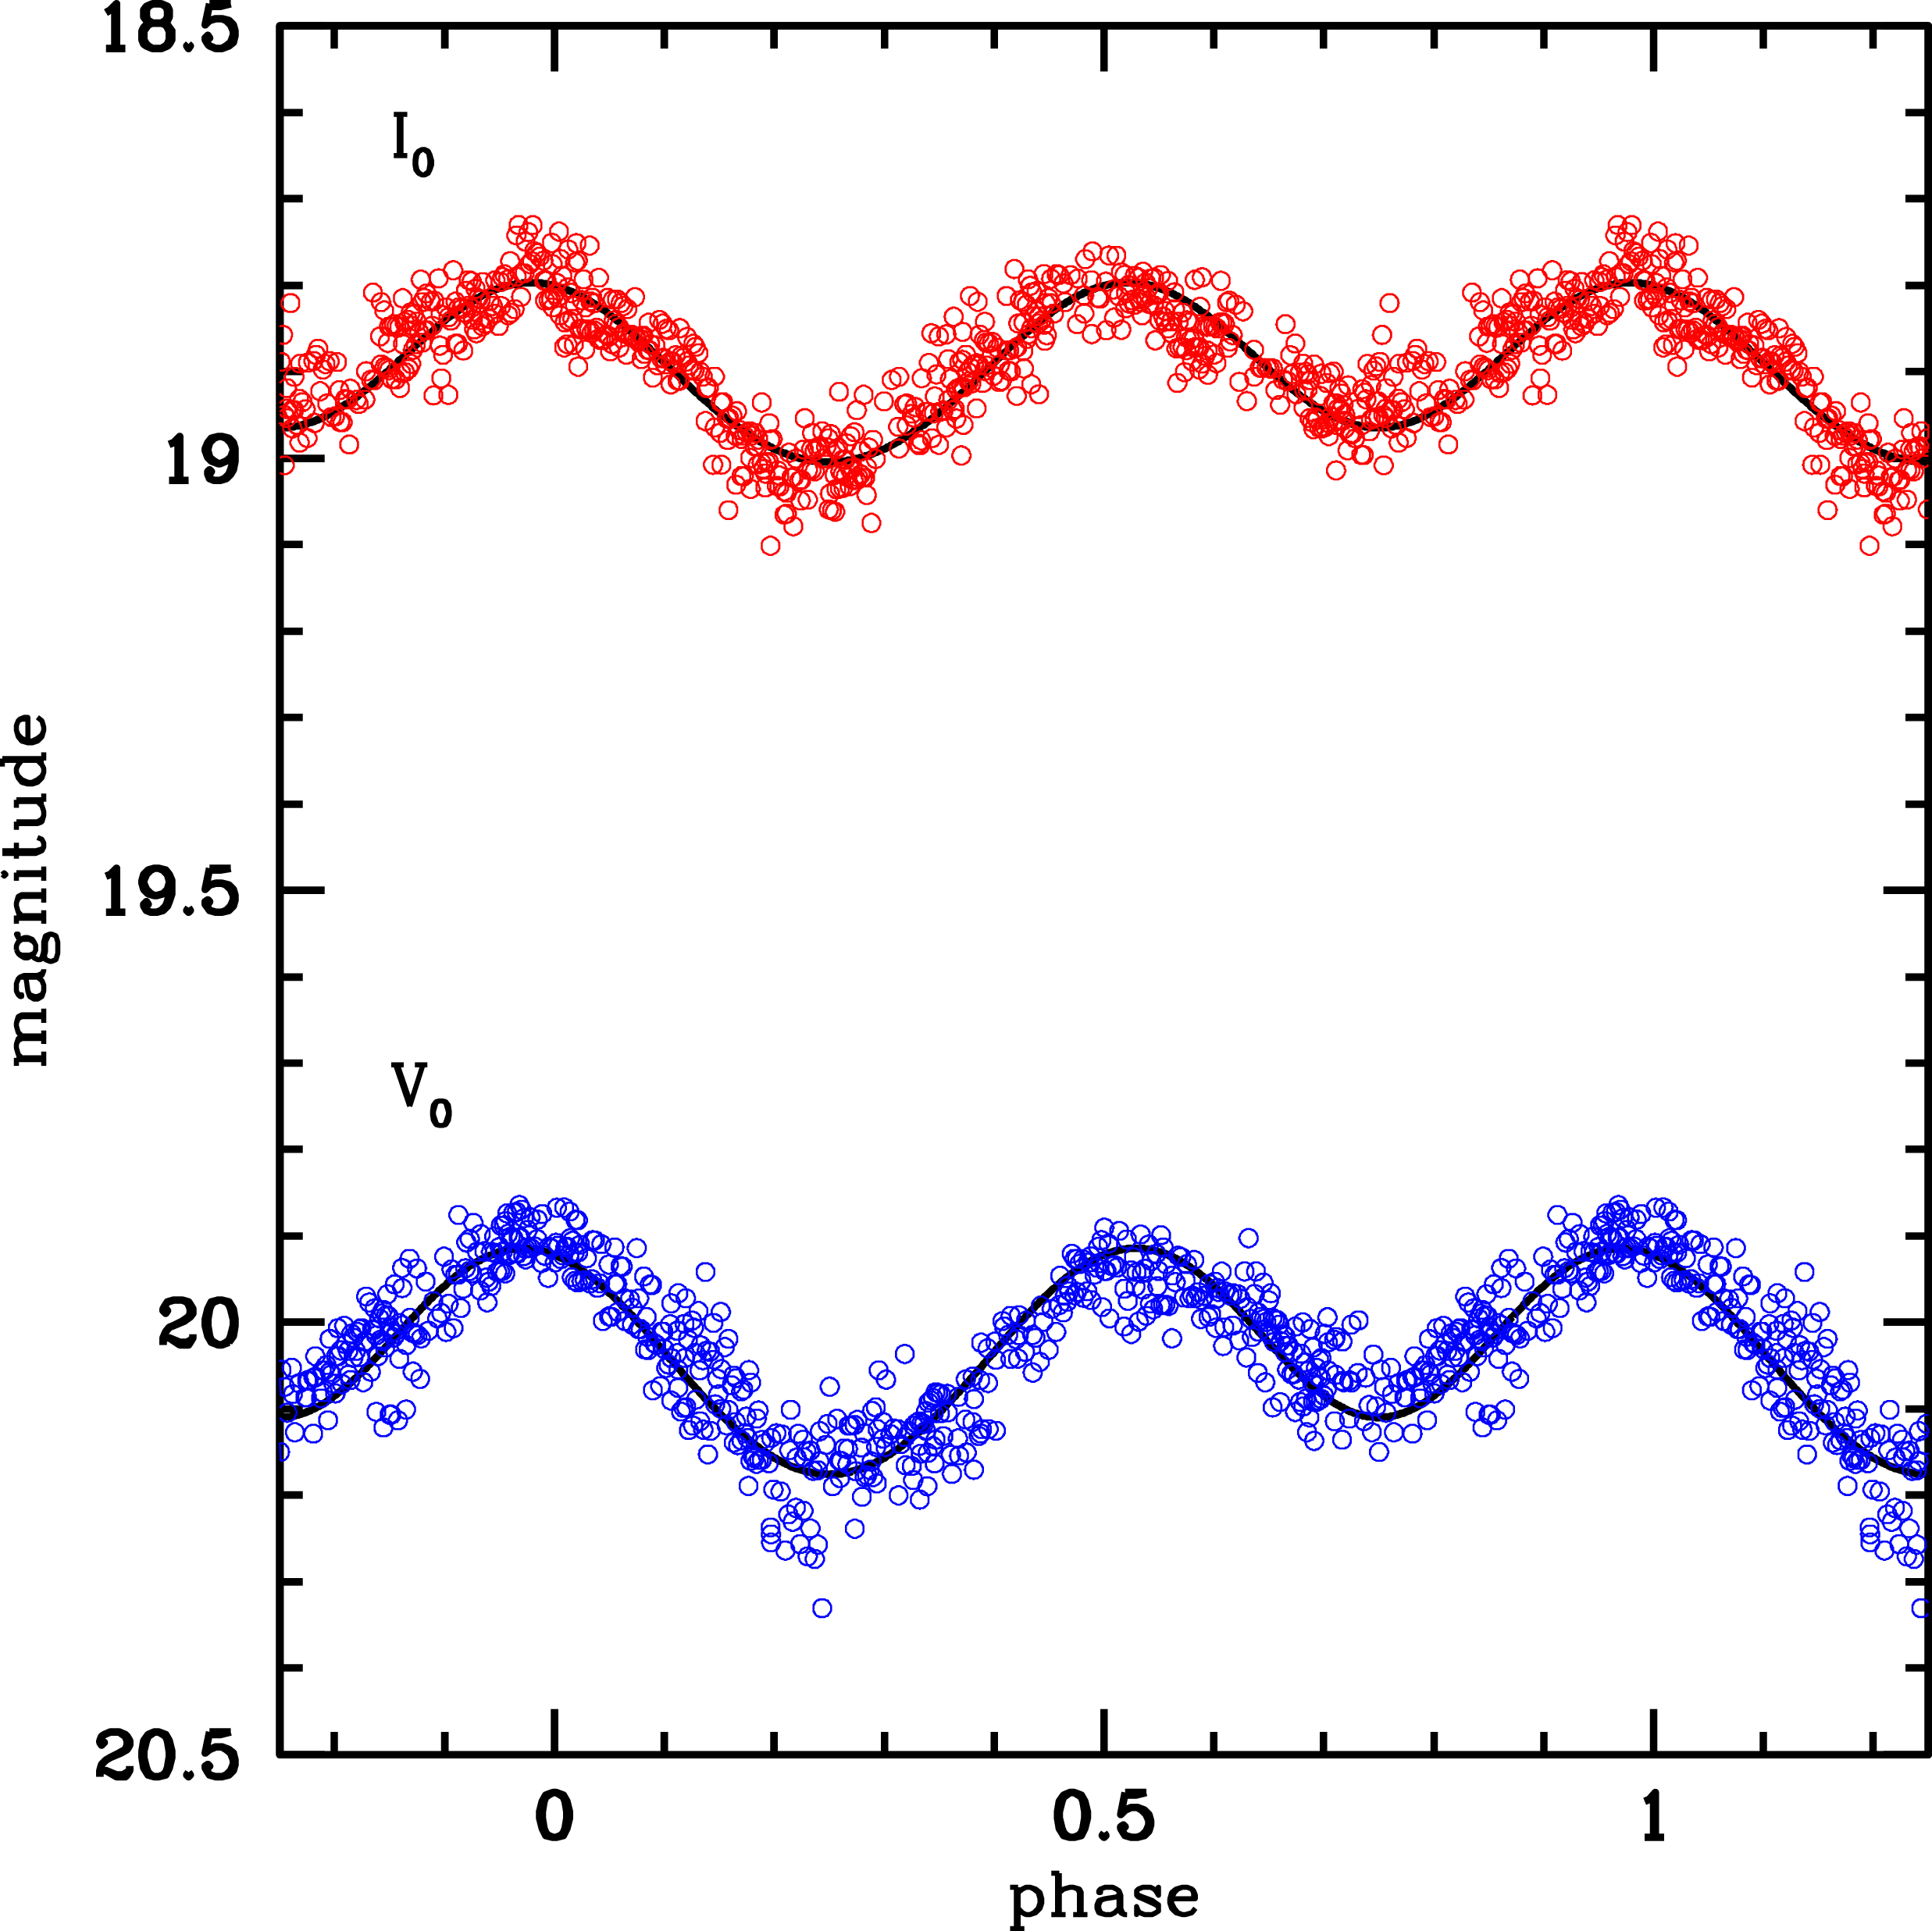
While the light curves plotted in Figure 4 are too sparse for good constraints for light curve fitting, there is an additional data source: the phased light curve in V and I published in Figure 12 of Albrow et al. (Reference Albrow2001). While this light curve has the advantage of a large number of data points (over 600 in each filter), it also has a disadvantage: these data are not available in tabular form, nor do they have the original epochs attached – they are only available in the Albrow et al. (Reference Albrow2001) phasing.
Given these constraints, we decided to model this light curve in a preliminary manner. We digitised the data points, applied a correction for foreground extinction, and then began by fitting a pure ellipsoidal model using PHOEBE version 2.4.22 (Prša & Zwitter Reference Prša and Zwitter2005; Conroy et al. Reference Conroy2020). Since light curve fitting alone cannot constrain the mass of the primary independent of the secondary, we fixed the primary mass to
 $1.8$
M
 $_{\odot}$
, a typical value for redbacks (Strader et al. Reference Strader2019), [Fe/H] = –0.5 (reasonable for a solar-scaled abundance given that 47 Tuc has [Fe/H] = –0.7 and is
 $\alpha$
-enhanced; Alves-Brito et al. Reference Alves-Brito2005), and a distance of 4.52 kpc (Baumgardt & Vasiliev Reference Baumgardt and Vasiliev2021). We fit the secondary mass and
 $T_\mathrm{eff}$
, the Roche lobe filling factor, the binary inclination, and a phase offset (no specific conjunction appears to have been chosen for the phase zeropoint for the figures in Albrow et al. Reference Albrow2001). The normalisation of the models is not a free parameter – it is set entirely by the distance assumed and the shape and temperature of the secondary.
Posterior estimates (median, along with 16 and 84 percentiles) for the absorbed power-law model. Unabsorbed flux (F
 $_{\textrm{X}}$
) is reported in the 0.5–10 keV band. X-ray luminosity (in the same band) is inferred from the flux assuming a distance of
 $4.52\pm0.03$
kpc to 47Tuc (Baumgardt & Vasiliev Reference Baumgardt and Vasiliev2021). It is worth noting that the posterior sample for N
 $_{\textrm{H}}$
appears similar to the prior distribution, indicating the weak influence of data on constraining N
 $_{\textrm{H}}$
.

Table 1. Long description
A table with three rows and four columns presents posterior estimates for an absorbed power-law model. The columns are labeled ‘Parameter’, ‘Posterior estimate’, ‘N_h (10^20 cm^-2)’, ‘Γ’, ‘F_x (10^-14 ergs s^-1 cm^-2)’, and ‘L_x (10^31 ergs s^-1)’. The first row lists the parameter ‘N_h’ with a posterior estimate of 3.5 ± 0.2. The second row lists the parameter ‘Γ’ with a posterior estimate of 1.36 ± 0.08. The third row lists the parameter ‘F_x’ with a posterior estimate of 1.13 ± 0.09. The fourth row lists the parameter ‘L_x’ with a posterior estimate of 2.7 ± 0.2. The table provides specific values and uncertainties for each parameter, indicating the results of spectral analysis using an absorbed power-law model.
The best-fitting ellipsoidal model has
 $M_2 = 0.50$
M
 $_{\odot}$
,
 $T_\mathrm{eff} = 4\,500$
K, a Roche lobe filling factor of 0.96, and a binary inclination of
 $62^{\circ}$
. The overall quality of the model fit is not great (
 $\chi^2/d.o.f .\sim 1.7$
), and the residuals of this fit are dominated by a single broad single peak, which is characteristic of irradiation.
We then add a central irradiating source, with its luminosity as another free parameter. While this luminosity is not amenable to direct interpretation, it can serve as a stand in for the luminosity of the pulsar wind, some of which is expected to heat the companion; irradiation from an intrabinary shock could also be relevant if the shock is close to the secondary.
Left: Chandra/ACIS X-ray spectrum of W41 (blue circles), model posterior median (solid black line) and 90% highest density interval (shaded gray region). Here, the spectrum is grouped by 20 counts per bin for plotting. Right: Pairwise plot of posterior samples. Unabsorbed flux (F
 $_{\textrm{X}}$
) is reported in the 0.5–10 keV band. X-ray luminosity (in the same band) is inferred from the flux assuming a distance of
 $4.52\pm0.03$
kpc to 47Tuc (Baumgardt & Vasiliev Reference Baumgardt and Vasiliev2021).

In this interpretation of the light curve; the phase is shifted by
 $\phi = 0.5$
compared to the pure ellipsoidal model, such that the deepest minimum is when the nightside of the secondary is visible, while the dayside (which would normally be the faintest due to gravity darkening) is instead slightly brighter due to the irradiation. The best-fit stellar parameters in this model are very similar to the pure ellipsoidal model (
 $M_2 = 0.55$
M
 $_{\odot}$
,
 $T_\mathrm{eff} = 4\,500$
K, filling factor
 $0.93$
), but with a more edge-on inclination required (
 $i = 85^{\circ})$
. The implied volume-equivalent radius of the star is
 $0.82$
R
 $_{\odot}$
. Accommodating such a high inclination angle, along with the lack of orbital modulation of the X-ray emission, would require a rather large intrabinary shock region; the pulsar 47 Tuc W is thought to have a high binary inclination and shows only sporadic modulation of its X-rays on the orbital period (Hebbar et al. Reference Hebbar, Heinke, Kandel, Romani and Freire2021), so such a scenario is not an unreasonable one.
This new fit is plotted in Figure 7. It is a much better fit overall (
 $\chi^2/d.o.f. \sim 1.2$
), representing an excellent fit to the
 $I_0$
light curve and an adequate fit to the
 $V_0$
light curve. Given how common irradiation is in redback light curves, it seems reasonable to expect that it is present here as well.
Under the assumption that the secondary is not overfilling its Roche lobe (reasonable given the evidence for a radio pulsar, which would not be visible if accretion were present), we can calculate a minimum mass of the secondary, since we have a measurement of its radius, and the mean density of a Roche lobe-filling star is determined almost entirely by the orbital period and is insensitive to the primary mass (Paczyński Reference Paczyński1971). Our radius measurement of
 $0.82$
R
 $_{\odot}$
implies a minimum mass of
 $\sim$
 $0.45$
M
 $_{\odot}$
. We can also roughly estimate the maximum mass of the secondary by comparing the absolute magnitude to that of normal main sequence stars in 47 Tuc, under the assumption that an irradiated secondary should not be less luminous than a main sequence star of the same mass. The mean nightside minimum
 $V_0 = 6.88$
corresponds to a main sequence mass of about 0.62 M
 $_{\odot}$
, using a MIST isochrone (Dotter et al. Reference Dotter, Bauer, Park, Conroy, Milone, Joyce and Cantiello2026) with [Fe/H] = –0.7, [
 $\alpha$
/Fe = +0.2], and age 12.5 Gyr, appropriate for 47 Tuc. These masses encompass the values found by the light curve fitting.
Chandra/HRC light curve of W41, folded on the period reported by Albrow et al. (Reference Albrow2001). While there is weak evidence for a similar periodic modulation in the X-rays, it is not statistically significant.

Irradiated ellipsoidal light curve fit to HST/WFPC2
 $V_0$
and
 $I_0$
photometry of W41, as described in the text. We adopt the pulsar phase convention where
 $\phi=0$
is the ascending node of the pulsar, so
 $\phi=0.25$
is the inferior conjunction of the secondary.

Given the issues with the provenance of the data themselves, we do not argue that the exact derived values, especially for the inclination and Roche lobe filling factor, should be taken too seriously. Nonetheless, the properties are typical for redback systems. The fit is a plausibility check that shows the interpretation suggested by the rest of the data are also broadly consistent with these unusually well-sampled light curves.
4. Discussion
The object W41 in 47 Tucanae has previously been classified on several occasions as a coronally active binary, either as a member of the BY Draconis class, or a semi-detached W Ursa Majoris (Albrow et al. Reference Albrow2001). It was noted that this object has an X-ray luminosity higher than expected for these classes of objects (Edmonds et al. Reference Edmonds, Gilliland, Heinke and Grindlay2003), and that, unusually for active binaries, it showed no statistically significant variability (Heinke et al. Reference Heinke, Grindlay, Edmonds, Cohn, Lugger, Camilo, Bogdanov and Freire2005). Steady coronal X-ray activity saturates at 0.1% of the bolometric luminosity (Vilhu & Walter Reference Vilhu and Walter1987). Edmonds et al. (Reference Edmonds, Gilliland, Heinke and Grindlay2003) suggested that it might have been caught in a flaring state by Chandra, since flaring can bring the X-ray emission above the saturation level, and the source otherwise showed consistency with semidetached W Ursa Majoris variables (Albrow et al. Reference Albrow2001). As the subsequent Chandra data continue to show a similar L
 $_{\rm X}$
, it is clear that flaring cannot explain the source exceeding the saturation limit. Given the X-ray excess, the source would be most likely either to have accretion or to be a pulsar binary. The steep spectrum radio emission strongly favours the latter possibility.
4.1. W41 as a redback pulsar
All data for W41 are consistent with a single interpretation: that it is a redback millisecond pulsar. The faint, likely steep-spectrum radio emission is as observed for pulsars. The 0.5–10 keV X-ray luminosity (
 $3 \times 10^{31}$
erg s
 $^{-1}$
) and hard photon index (
 $\Gamma = 1.4\pm0.1$
) are fully consistent with that observed for redbacks (Roberts et al. Reference Roberts, McLaughlin, Gentile, Ray, Ransom and Hessels2015; Urquhart et al. Reference Urquhart2020), where the X-rays arise primarily in an intrabinary shock. The orbital period (10.4 h) and inferred secondary mass (
 $\sim$
 $0.5$
–0.55 M
 $_{\odot}$
) are likewise typical for redbacks (Strader et al. Reference Strader2019; Koljonen and Linares Reference Koljonen and Linares2025). The light curve is well-fit by an ellipsoidal model with some irradiation, which is again normal for redbacks (e.g. Turchetta et al. Reference Turchetta, Linares, Koljonen and Sen2023). The H
 $\alpha$
excess and possible UV excess observed in the HST photometry can be attributed to either ionisation of the outflow of the secondary or the intrabinary shock, as observed in other redbacks (e.g. Sabbi et al. Reference Sabbi, Gratton, Ferraro, Bragaglia, Possenti, D’Amico and Camilo2003; Halpern et al. Reference Halpern, Strader and Li2017; Strader et al. Reference Strader2019).
4.2. Future characterisation of the source
Ultimate confirmation that W41 is a pulsar would come from its detection as a radio pulsar. New pulsar discoveries in 47 Tuc are ongoing as part of the Transients And PUlsars with MeerKAT (TRAPUM) project, with 15 new discoveries just reported (Chen et al. Reference Chen2026). Of the known pulsars with measured binary periods or locations, none match W41. However, it is possible that it could be one of the new poorly localised binary pulsars: ah, an, aq, ar, or as, or else a yet-undiscovered pulsar. As timing observations of 47 Tuc are ongoing, future observations could confirm such an association.
Progress could also be made in the optical. While existing archival MUSE data are not sensitive enough to yield spectra of this star (S. Kamann, private communication), with narrow-field mode adaptive optics observations, it should be straightforward to measure its radial velocity curve with MUSE or with the James Webb Space Telescope’s integral field unit.
4.3. Implications for other potential source misclassifications
It is important to note that in the original classification of W41 as an active binary, Edmonds et al. (Reference Edmonds, Gilliland, Heinke and Grindlay2003) had already recognised that this system had an X-ray luminosity significantly higher than expected for an active binary and noted that the most likely explanation for this was flaring activity in the X-ray data. Our attention was drawn to this source only because of the steep spectrum radio source. It is likely then, that in clusters without such deep radio data, there are other spider pulsars that have been misclassified as active binaries for the same reason and which are waiting to be discovered.
Acknowledgements
The Australia Telescope Compact Array is part of the Australia Telescope National Facility (grid.421683.a) which is funded by the Australian Government for operation as a National Facility managed by CSIRO. We acknowledge the Gomeroi people as the traditional owners of the Observatory site. We thank S. Kamann for carefully investigating the VLT/MUSE IFU data for any sign of W41. AP thanks Texas Tech University for its hospitality during a visit in which this project began. C. O. Heinke is supported by NSERC Discovery Grant RGPIN-2023-04264. J.S. is supported by NSF grant AST-2205550 and NASA grants 80NSSC21K0628 and 80NSSC26K0226. L.C. is grateful for support from NASA grant 80NSSC23K0497. L.R.S. is grateful for support from grant CS-CSA2025-051 from the Cottrell Scholar program of the Research Corporation for Science Advancement.
Data availability statement
The Australia Telescope Compact Array data are all public data which have been archived by the Australia Telescope National Facility. The X-ray data presented are all public data, which have been archived by the Chandra X-ray Observatory. The Hubble Space Telescope data are all public data which have been archived at the Space Telescope Science Institute.
 1σ
 σ
 α
 0.4145
 X
 4.52±0.03
 H
 H
 X
 4.52±0.03
 V0
 I0
 ϕ=0
 ϕ=0.25

 Open access

