INTRODUCTION
Diet formulation for ruminant animals requires accurate estimates of energy and nutrient requirements for maintenance, production and other activities. Currently, energy and protein requirements for maintenance in cattle are calculated as a proportion of empty body (EB) weight (EBW) (Agricultural and Food Research Council (AFRC) 1993; National Research Council (NRC) 2001). The accurate estimation of EBW from live weight (LW) of cattle is therefore critical to develop an appropriate feeding and management strategy. Furthermore, there is increasing evidence in the literature to indicate that the energy expenditure for maintenance in animals mainly results from protein metabolism, while lipid metabolism requires relatively little energy (Agnew & Yan Reference Agnew and Yan2000). Birnie (Reference Birnie1999) reported a significant and negative relationship between fasting heat production and body condition in dairy cows, indicating a lower maintenance metabolic rate per kg body weight with fat than thin cows. Therefore, the estimation of protein and lipid contents in live animals is a key factor to quantify accurately maintenance energy and protein requirements.
There are few reports in the literature of comparative slaughter studies involving lactating dairy cows (Reid & Robb Reference Reid and Robb1971; Gibb et al. Reference Gibb, Ivings, Dhanoa and Sutton1992; Andrew et al. Reference Andrew, Waldo and Erdman1994; Waltner et al. Reference Waltner, McNamara and Hillers1994). The studies cited each presented a relatively small dataset (n=23–54), when compared to the cow numbers used in the present study (n=146). The relatively small numbers of cows used in the cited studies limits the range of animal factors, such as LW, parity, milk yield, stage of lactation and body condition score (BCS). The prediction models presented in published studies are mostly based on linear relationships using body weight as a single predictor and only a few equations have included BCS as a secondary predictor. A number of other readily available live animal factors, e.g. parity, milk yield and stage of lactation, were not examined, but they can affect body composition. Furthermore, as genetic merit of dairy cows has been continuously improved, body composition may also have changed to cope with the increase in feed intake and milk yield (Agnew & Yan Reference Agnew and Yan2000). Consequently, there is a need to develop new relationships between body composition and live animal measurements for current high-yielding dairy cows.
During 1999, a series of slaughter trials was undertaken at the Agri-Food and Biosciences Institute, Hillsborough, N. Ireland. The objectives of the present study were to use these data to examine the relationships between body composition and live animal factors and then develop prediction equations for body composition.
MATERIALS AND METHODS
Animals and feeds
Body composition data of Holstein–Friesian lactating dairy cows (n=146) were derived from a compulsory slaughter programme in 1999, which resulted from a consequence of a disease incident (brucellosis). Only a small number of cows were in fact infected, but cattle were selected from the disease-free herd at the Agri-Food and Biosciences Institute to represent a range of parity, BCS, genetic merit (low to high), stage of lactation (early to late) and LW (light to heavy) within the overall herd. Forty-seven cows were in the first lactation, 47 in the second lactation and the remaining animals were in the third or subsequent lactation. These cows had been subjected to a variety of nutritional and management regimes across a range of indoor feeding experiments before slaughter. They were housed in cubicle areas with box stalls and milked twice daily commencing at 06.00 and 16.00 h, and offered ad libitum mixed diets of grass silages and concentrate supplements, with forage proportions in diets ranging from 0·30 to 0·60 (dry matter (DM) basis) according to milk yield. No extreme diets were offered and all concentrate ingredients and their proportions in concentrate supplements used in the present study were within the range of normal practice. The silages were made from perennial ryegrass dominant swards and encompassed primary growth and first and second re-growth materials. The grass was either unwilted or wilted prior to ensiling and ensiled with or without application of silage additives (e.g. formic acid and inoculant additives). The concentrates used included a vitamin and mineral supplement and some of the following ingredients: barley, wheat, maize, maize gluten meal, molassed sugar-beet pulp, citrus pulp, molasses, soyabean meal and rapeseed meal.
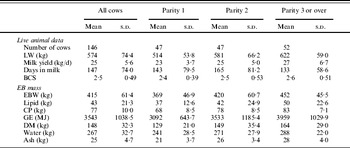
Milk production was recorded daily and daily milk yield was averaged for the week before slaughter. The LW and BCS data were recorded 3 or 4 days prior to slaughter and on the same day of slaughter, after morning milking but prior to feeding. The mean LW and BCS from the two records were used. Body condition of each cow was scored by two experienced technicians (one for each recording time) using the method as described by Mulvanny (Reference Mulvanny1977), with BCSs ranging from 1 (very thin) to 5 (very fat). The live animal data are presented in Table 1.
Live animal measurements and EB component masses

Body composition analysis
Animals were offered their experimental diets on the morning prior to the day of slaughter, and were then transported a distance of 70 km to the lairage in the late evening, put into lairage and slaughtered early on the following day. Alternatively, some animals were transported to the lairage early on the day of slaughter. Prior to slaughter, cows were milked and feeds and water were freely available for all cows.
All procedures for the determination of body composition were undertaken over a period of 2 weeks. After slaughter, foetus and associated fluid and membranes were removed for pregnant cows. The exsanguinated bodies of the animals were then divided into eight components, namely, hide, feet, udder (milk was drained), head (including spinal cord and thymus), alimentary tract (excluding all contents that were measured, except contents of omasum), urino-genital tract, pluck (trachea, lungs, heart, diaphragm, liver, kidneys and tail) and carcass. Perinephric and retroperitoneal fat were included with the alimentary tract. The weight of each component was recorded at the time of collection and all components were stored at −20°C. The draining blood was not collected due to technical difficulty, but predicted using a ratio of 0·0874 of free draining blood weight against carcass weight as derived from the data of 54 Holstein–Friesian lactating cows reported by Gibb et al. (Reference Gibb, Ivings, Dhanoa and Sutton1992).
Each component was subsequently shredded and minced while in the frozen state and representative samples taken for determination of DM. Representative samples of each component were also taken for determination of nitrogen (N), total lipid, ash and energy concentrations. The DM, N and ash concentrations were determined as detailed in Association of Official Analytical Chemists (AOAC) (1996) (methods 950·46, 920·153 and 981·10, respectively). Total lipid was determined as described by Bligh & Dyer (Reference Bligh and Dyer1959). Energy concentration was determined in an adiabatic bomb calorimeter using a modification of the method of Porter (Reference Porter1992) for all components except the feet and hide components. For these two components, energy concentration was estimated by applying constant energy values of 23·85 and 39·75 MJ/kg to crude protein (CP) and total lipid, respectively (Brouwer Reference Brouwer and Blaxter1965). The data on EBW (LW minus weights of gut contents and foetus and associated fluid and membranes) and EB masses of lipid, CP, energy, DM, water and ash are presented in Table 1.
Statistical analysis
Prediction equations for EBW and EB composition were developed using LW as a single predictor in the linear and quadratic regression, and using LW together with other live animal factors (e.g. milk yield, BCS, parity and stage of lactation) as predictors in multiple regression. In the latter case, LW and other live animal factors were used as independent predictors for prediction of EB component proportions. For prediction of EBW and EB component masses, LW was used as an interaction factor with other predictors (BCS, milk yield, parity and stage of lactation), because LW is a main variable for change of EBW and EB component masses. For example, the weight gain or loss for one unit change in BCS increases with increasing LW of cows (NRC 2001).
The stepwise multiple regression technique was used to develop multiple prediction equations and the technique automatically selects the best and significant predictors to fit the prediction equations. Effects of stage of lactation or lactation number on these relationships, if significant, were removed by the following model (Eqn a):

where ai represents the effect of stage of lactation or parity i for i=1–3, x 1, x 2, … and xn are the x-variables and b 1, b 2, … and bn are their regression coefficients. The statistical program used in the present study was Genstat 6·1, sixth edition (Lawes Agricultural Trust, Rothamsted, England, UK). With including parity or stage of lactation in the model, the statistical program produced a range of sub-models for each response variable (EBW, or EB component mass or proportion). These sub-models had parallel lines (coefficients) and different constants. The latter was determined using parity one or first stage of lactation as reference level. The differences in constants were then adjusted using their associated s.e. values to produce a common equation.
The stage of lactation was categorized as three stages, i.e. stages 1, 2 and 3 representing days in milk for 1–100, 101–200 and over 200, respectively. The parity was also divided into three categories, i.e. parities 1, 2 and 3 that were for lactation 1, 2 and 3 or over.
An internal evaluation was undertaken to validate the prediction equations for EBW and EB component masses by dividing the whole dataset into two subsets, one-third (n=49) and two-thirds (n=97) of data. To obtain a similar range in LW between two sub-datasets, the whole dataset was divided into groups of three cows according to LW from the highest to the lowest values; within each group, data for one cow were randomly selected for the one-third dataset and data for the remaining two cows for the two-thirds dataset. Two-thirds of the data were used to develop similar relationships to those developed using the whole dataset. These new equations were then evaluated using the remaining one-third of data and the mean-square prediction error (MSPE, Eqn b):

where P or A is predicted or actual EBW or EB component masses; n is the number of pairs of values of P and A compared. Mean prediction error (MPE), rather than MSPE, was used to describe the prediction accuracy ( ).
The one-third dataset was also used to validate a range of published equations developed from the body composition data of lactating dairy cows. The validation was undertaken using the same procedure as described above. The equations selected for this validation are presented in the footnote of Table 7.
RESULTS
Live animal data and EB component mass
The objective of selection of animals was to maximize and equally represent a range of live animal variables, e.g. parity, LW, BCS, milk yield and stage of lactation. The objective was achieved as evidenced in Table 1 and Fig. 1 for the whole dataset. There was a large range in LW (419–781 kg), milk yield (12·2–44·1 kg/d), days in milk (21–498), BCS (1·1–4·0) and parity (1–7) for the whole dataset. Accordingly, EB component mass varied greatly, e.g. the highest EB CP mass was 1·8 times that of the lowest EB CP mass and the proportions for EB masses of water, ash, energy and lipid were 1·8, 2·6, 3·6 and 8·1 times, respectively. The mean and s.d. values for these variables for cows of first, second and third lactation or over are also presented in Table 1.
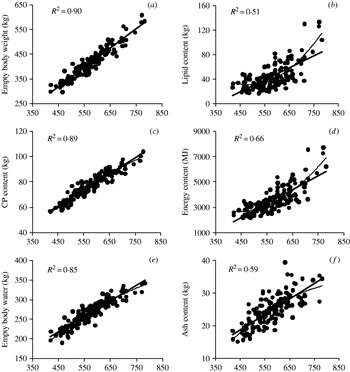
The relationship between LW (kg, x-axis) and EBW or component content (y-axis) of lactating dairy cows (n=146) (R 2 value in each sub-figure was derived from the linear relationship, R 2 values for quadratic relationships in sub-figures (b) and (d) were 0·59 and 0·72, respectively).

Relationships between body composition variables and live animal data
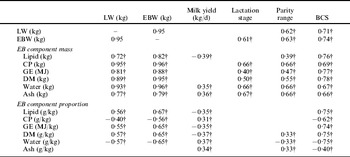
The correlation coefficients (r) in the linear relationships between live animal measurements and body component mass are presented in Table 2. There was a positive relationship between EBW and LW (P<0·001). LW and EBW were positively related to BCS and parity range (P<0·001) and EBW was also positively related to stage of lactation (P<0·01). The EB component masses (lipid, CP, gross energy (GE), DM, water and ash) were each positively related to LW, EBW, parity range and BCS (P<0·001), respectively, with the exception that the significance level between EB lipid mass and parity range was at P<0·01. Milk yield was negatively related to EB lipid mass (P<0·05), and positively related to EB ash and water masses (P<0·05). There were positive relationships between the stage of lactation and EB masses of CP, ash, DM and water (P<0·01) and total GE content (P<0·05).
Correlation coefficients (R) in the linear relationships between live animal data and body weight and composition (n=146)Footnote *

* No data presented indicate that the linear relationships were not significant, otherwise were significant (P<0·05).
† The R value indicates that the effect of stage of lactation or parity range on the relationship was removed. Lactation stage=stage 1 for days 1–100 of lactation, stage 2 for 101–200 and stage 3 or over 200. Parity range=1 for lactation 1, parity range 2 for lactation 2 and parity range 3 for lactation 3 or over.
The correlation coefficients (r) in the linear relationships between live animal measurements and EB component proportions are also presented in Table 2. The r values in all relationships are smaller than those with EB component masses.
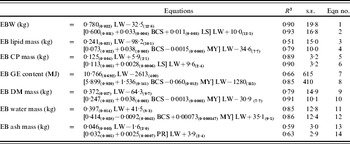
Prediction of EBW and component mass
The prediction equations for EBW and EB component mass using LW as the primary predictor are presented in Table 3 and Fig. 1. These relationships are all highly significant (P<0·001) and each predictor has a significant effect on the relationship (P<0·05). The R 2 for the relationship between EBW and LW (Eqn 1) was very high (0·90) with an s.e. of 19·8. Adding BCS and stage of lactation as secondary predictors improved the relationship, with R 2 increasing to 0·93 and s.e. reducing to 16·8 (Eqn 2).
Prediction equations for EBW and component contents using LW and other variables (subscript values in parentheses=s.e.)

BCS, body condition score; LS, lactation stage; LW, live weight (kg); MY, milk yield (kg/d); PR, parity range.
Effect of parity range (Eqns 3 and 4) or stage of lactation (Eqns 5–14) on the relationship was removed.
The R 2 values for the linear relationships between LW and EB masses of CP (Eqn 5) and water (Eqn 11) are very high, followed by DM (Eqn 9), and relatively low with GE (Eqn 7), ash (Eqn 13) and lipid (Eqn 3). However, the relationship between LW and EB lipid mass or EB GE content was considerably better described by a quadratic (Eqns c or d) than by a linear equation, with R 2 increasing from 0·51 to 0·59 or from 0·66 to 0·72. This may mainly be attributed to body condition of the cows. With the same body size, fat cows have a higher proportion of fat content over EBW than thin cows (NRC 2001).


The relationships were all improved when adding BCS and milk yield as supporting predictors. For example, the R 2 for EB lipid mass increased from 0·51 to 0·79 (Eqns 3 v. 4), for EB GE content from 0·66 to 0·85 (Eqns 7 v. 8) and for EB DM mass from 0·79 to 0·91 (Eqns 9 v. 10). The corresponding s.e. values reduced from 15·0 to 10·0 for EB lipid mass, 615 to 410 for EB GE content and from 14·9 to 10·1 for EB DM mass. However, the improvement with the multiple equations over the linear equations was small, with the R 2 values being similar, for prediction of EB masses of CP (Eqns 5 v. 6), water (Eqns 11 v. 12) and ash (Eqns 13 v. 14).
Prediction of EB component proportion
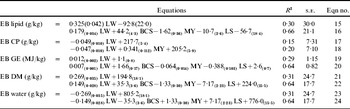
The prediction equations for EB component proportion using LW as the primary predictor are presented in Table 4. These relationships are all significant (P<0·001) and each predictor has a significant effect on the relationship (P<0·05). There is no significant relationship between EB ash proportion and LW. The linear relationships between LW and EB proportions of lipid, CP, GE, DM and water were relatively poor (Eqns 15, 17, 19, 21 and 23), with R 2 ranging from 0·15 (CP proportion) to 0·31 (DM and water proportions). Adding BCS, milk yield and/or stage of lactation as supporting predictors to the linear relationships improved them for prediction of EB proportions of lipid, GE, DM and water (Eqns 16, 20, 22 and 24, R 2=0·64–0·66), although the R 2 values were still much smaller in comparison with those for predicting EB component masses. However, the fit when adding stage of lactation as a supporting predictor to the relationship between EB CP proportion and LW was still very poor (Eqn 18, R 2=0·20).
Prediction equations for EB component proportions using LW and other variables (subscript values in parentheses=s.e.)

The relationship between LW and EB ash proportion was not significant.
BCS, body condition score; LS, lactation stage; LW, live weight (kg); MY, milk yield (kg/d); PR, parity range.
Effect of parity range on all relationships was removed.
Internal validation of prediction equations for EBW and mass
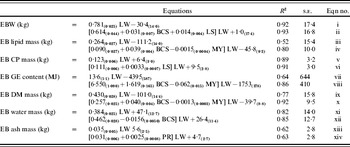
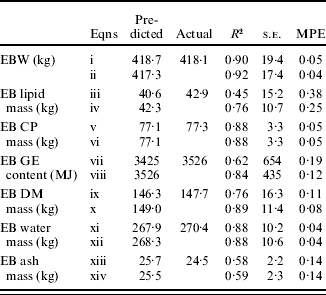
New linear and multiple regression equations developed for predicting EBW and EB component mass using two-thirds of the present dataset (Table 5) were very similar to those developed from the whole dataset (Table 3). The results of the internal validation are presented in Table 6. The mean prediction values are relatively close to actual data for all equations. Prediction of EBW (Eqn i) and EB masses of CP and water (Eqns v and xi) using LW alone produced a very small MPE and very high R 2 in the relationship between predicted and actual values. Addition of stage of lactation or BCS did not improve the prediction accuracy for EB masses of CP and water (Eqns vi and xii), although addition of these two variables as supporting predictors increased the prediction accuracy for EBW (Eqn ii). Inclusion of parity range to support LW for prediction of EB ash mass resulted in no improvement in the relatively poor prediction accuracy (Eqns xiv v. xiii), with MPE of 0·14 and R 2 of 0·58. Prediction accuracy for EB lipid and GE from LW alone was poor with high MPE (0·38 and 0·19) and low R 2 (0·45 and 0·62) (Eqns iii and vii). However, addition of BCS and milk yield as supporting predictors reduced MPE to 0·25, s.e. values from 15·2 to 10·7 and increased the R 2 to 0·76 for prediction of EB lipid mass (Eqns iv v. iii); and similarly for EB GE content with MPE reduced to 0·12, s.e. from 654 to 435 and R 2 increased to 0·84 (Eqns viii v. vii). Prediction of EB DM mass from LW alone produced relatively good prediction accuracy and including BCS and milk yield as supporting predictors improved prediction accuracy by reducing MPE and s.e. and increasing R 2 in the linear relationship between predicted and actual EB DM mass (Eqns ix v. x).
Internal validation – quadratic and multiple prediction equations for EBW and component mass developed using two-thirds of the present data (n=97) (subscript values in parentheses=s.e.)

LS, lactation stage; LW, live weight (kg); MY, milk yield (kg/d); PR, parity range.
Effect of parity range (Eqns iii and iv) or stage of lactation (Eqns v–xiv) on the relationship was removed.
Internal validation – on one-third of the present data using equations (Table 5) developed from two-thirds of dataFootnote *

* MPE, mean prediction error.
R 2 was derived from the relationship between predicted and actual EBW or EB component mass.
DISCUSSION
Body composition is ultimately a reflection of the response to dietary nutrients by lactating dairy cows and accurate estimation of body composition is therefore important for developing appropriate nutritional and management strategies. There are a few studies in the literature that used a relatively limited number of animals to examine relationships between body composition and live animal measurements in lactating dairy cows. For example, Gibb et al. (Reference Gibb, Ivings, Dhanoa and Sutton1992) developed linear relationships between body energy mass and body weight in a slaughter study with 54 lactating Holstein–Friesian dairy cows in their second to fourth lactation. Andrew et al. (Reference Andrew, Waldo and Erdman1994) also reported results of modelling studies to predict body energy mass in 10 prepartum, seven early and eight late lactating Holstein dairy cows in their first and fourth lactation. Waltner et al. (Reference Waltner, McNamara and Hillers1994) reported relationships between EB fat mass and LW and BCS using 23 lactating Holstein cows. In comparison with these published studies, the present study included considerably more animals (n=146), which were selected from a large herd to represent a wide range of animal characteristics (LW, BCS, parity, stage of lactation and milk yield). Therefore, the present dataset represents body composition of lactating Holstein–Friesian dairy cows under a very wide range of conditions. Furthermore, the present study enabled prediction of EBW and EB masses of lipid, CP, GE, DM, water and ash from a number of live animal characteristics, which are available on commercial farms. This compares to previous studies that presented limited prediction models for fat, protein and GE (Reid & Robb Reference Reid and Robb1971; Gibb et al. Reference Gibb, Ivings, Dhanoa and Sutton1992; Gibb & Ivings Reference Gibb and Ivings1993; Ivings et al. Reference Ivings, Gibb, Dhanoa and Fisher1993; Andrew et al. Reference Andrew, Waldo and Erdman1994, Reference Andrew, Erdman and Waldo1995; Waltner et al. Reference Waltner, McNamara and Hillers1994).
Variations in EB composition
Gibb et al. (Reference Gibb, Ivings, Dhanoa and Sutton1992) reported that EBW of dairy cows declined by 1·1 kg/d during the first 8 weeks of lactation, of which only 0·1 kg/d was protein, giving a total loss of CP over the 8 weeks equivalent to only 0·066 of the original CP pool. Protein content in the body of dairy cows is relatively constant. In the present study, CP mass as a proportion of fat-free EBW (FFEBW) was very similar, between 0·205 and 0·207, irrespective of lactation number or stage of lactation. Similarly, Gibb et al. (Reference Gibb, Ivings, Dhanoa and Sutton1992) reported that CP/FFEBW was between 0·212 and 0·218 for lactating Holstein–Friesian dairy cows from lactation weeks 0 to 29. This variable was unchanged with dairy cows offered different levels of concentrates (3, 6 and 9 kg DM/d) before slaughter (Gibb et al. Reference Gibb, Ivings, Dhanoa and Sutton1992). Even in comparisons between cows of different breeds, CP/FFEBW was similar, i.e. 0·230 for Whitebred Shorthorn and Galloway cross and 0·226 for Hereford–Friesian, Galloway, Luing and British Friesian genotypes (Wright & Russel Reference Wright and Russel1984a). These cited results indicate that growth in lean mass occurs at a similar rate to that of skeleton from lactation one to three or over and protein contents in lactating dairy cows are very constant. However, Andrew et al. (Reference Andrew, Waldo and Erdman1994) reported a variation in CP/FFEBW among pre-calving, early and late lactation cows (0·209, 0·201 and 0·215). Similarly, EB ash mass as a proportion of FFEBW is also constant and was only influenced marginally by parity (the present study), stage of lactation (Gibb et al. Reference Gibb, Ivings, Dhanoa and Sutton1992; Andrew et al. Reference Andrew, Waldo and Erdman1994; the present study), plane of nutrition (Gibb et al. Reference Gibb, Ivings, Dhanoa and Sutton1992) and breed (Wright & Russel Reference Wright and Russel1984a).
The most variable body component in a lactating dairy cow is fat content. In the present study, fat mass as a proportion of EBW ranged from 0·045 to 0·235 with a mean of 0·104. This variable, on average, was similar between cows in their first and second lactation (0·099 v. 0·095), but higher (P<0·05) in lactation three or over (0·109). Fat mass as a proportion of EBW was also influenced by stage of lactation, with values of 0·078, 0·092 and 0·125 (P<0·05) for early, mid and late lactation in the second lactation, and 0·124, 0·095 and 0·130 (P<0·05) in the third lactation or over, although in the first lactation this variable was unaffected (0·103, 0·097 and 0·101) by stage of lactation. Similar results were also reported by Andrew et al. (Reference Andrew, Waldo and Erdman1994) with fat/EBW ratios of 0·105 and 0·169 for early and late lactation in Holstein cows in lactation four. Gibb et al. (Reference Gibb, Ivings, Dhanoa and Sutton1992) reported that fat/EBW reduced from lactation week 0 to 8 (0·221–0·165) and then gradually increased to lactation week 24 (0·165–0·229). The fat/EBW ratio was also influenced by plane of nutrition, with values of 0·186, 0·194 and 0·212 with cows offered 3, 6 and 9 kg DM/d concentrates, respectively, before slaughter (Gibb et al. Reference Gibb, Ivings, Dhanoa and Sutton1992).
The large variation in EB fat content leads to similar variations in GE mass as a proportion of EBW, as energy content of fat is much higher than that of protein and CP content is very constant. The mean GE/EBW concentrations were 8·3, 8·2 and 8·7 MJ/kg (P<0·05) for the first, second and third lactation cows, respectively, and 8·6, 8·1 and 8·9 MJ/kg (P<0·01) for the early, mid and late lactation, respectively, in the present study. The large variation in GE/EBW concentrations with stage of lactation have also been observed elsewhere (Gibb et al. Reference Gibb, Ivings, Dhanoa and Sutton1992; Andrew et al. Reference Andrew, Erdman and Waldo1995), and similarly large variations with plane of nutrition have also been observed (Gibb et al. Reference Gibb, Ivings, Dhanoa and Sutton1992). Although many animal and dietary factors influence body fat and GE contents, the previous discussion indicates that, in general, body fat deposition gradually increases as cows grow from the first to multiple lactations and as lactation progresses from early to late lactation.
EB water mass as a proportion of EBW varies between first and multiple lactations and between stages of lactation. In the present study, EB water/EBW was higher in early and mid than in late lactation (0·645 and 0·655 v. 0·633) (P<0·01), and reduced linearly from 0·652, 0·649 to 0·640 (P<0·05) for lactation one, two and three or over, respectively. The effect of stage of lactation on EB water concentration has also been reported elsewhere. Andrew et al. (Reference Andrew, Waldo and Erdman1994) reported a higher EB water/EBW in early compared to late lactation (0·662 v. 0·600). Gibb et al. (Reference Gibb, Ivings, Dhanoa and Sutton1992) reported that EB water/EBW in dry cows was 0·566, while higher (0·584–0·609) in lactation weeks 2–14 and then reduced (0·561–0·575) to lactation weeks 19–29. The variation in EB water content is in line with milk yield. It is possible that more water is stored in the body of cows with a greater milk yield due to a greater intake of DM and water compared to cows with a lower milk yield.
Prediction models for EBW and component mass
There was little comparable information in the literature on prediction of EBW from live animal variables in lactating dairy cows. The present study indicated a very strong relationship between EBW and LW (R 2=0·90), the addition of BCS and stage of lactation improved the relationship with the R 2 value increasing to 0·93 and the s.e. value reduced from 19·8 to 16·8. The present internal validation also indicated that addition of BCS and stage of lactation to support LW for prediction of EBW reduced the MPE and s.e. values. Therefore, where available, BCS and stage of lactation should be used to support LW for accurate prediction of EBW.
As discussed previously, EB CP proportion is very constant in the present study and elsewhere, irrespective of a number of animal and dietary variables, e.g. parity, stage of lactation and plane of nutrition. Therefore, the relationship between this variable and LW was very strong in the present study, with an R 2 of 0·89. Adding stage of lactation as a supporting predictor gave little improvement in either the R 2 value or s.e. value. Gibb & Ivings (Reference Gibb and Ivings1993) also reported a high R 2 (0·83) in the linear relationship between EB CP mass and LW with a dataset of 54 dairy cows. The same dataset was also used by Ivings et al. (Reference Ivings, Gibb, Dhanoa and Fisher1993) to develop a prediction equation for muscle weight from LW with an R 2 of 0·76. In a review of body composition data published in the early half of the 20th century, Reid & Robb (Reference Reid and Robb1971) reported that the relationship of EBW with EB protein mass was much stronger than that with EB fat or energy (R 2=0·89 v. 0·69 or 0·79) using a dataset of 53 dairy cows. The internal validation in the present study also indicated an accurate prediction of EB CP mass using LW alone, and addition of stage of lactation gave no improvement in the accuracy of prediction.
However, as discussed previously, body fat proportion is influenced by many dietary and animal factors. LW and BCS are important factors for prediction of EB fat mass and GE content. In the present study, LW and BCS were strongly related to body fat mass and GE content. Use of both LW and BCS, rather than LW alone, to predict these two variables significantly increased the R 2 from 0·51 to 0·78 for EB fat mass and 0·66 to 0·82 for EB GE content. Inclusion of milk yield further increased the R 2 value for prediction of both EB fat mass and GE content (0·79 and 0·85). A similar improvement was reported by Waltner et al. (Reference Waltner, McNamara and Hillers1994) in the relationship between LW and EB fat mass, by including BCS as a supporting predictor (R 2=0·50 v. 0·78). Gibb & Ivings (Reference Gibb and Ivings1993) also reported a comparable R 2 value when using LW and BCS to predict EB fat mass (0·85) or GE content (0·87). The present internal validation indicated a higher prediction accuracy by using both LW and BCS to predict EB fat mass or GE content, rather than LW alone. Use of LW and BCS plus milk yield, rather than LW alone, to predict EB fat mass largely reduced both s.e. (14·5 v. 10·7) and MPE (0·36 v. 0·25); the corresponding values for EB GE content were 632 v. 435 and 0·18 v. 0·12.
In the present study, prediction of EB water mass from LW produced a very high R 2 (0·85), which is the same as that (0·85) obtained by Wright & Russel (Reference Wright and Russel1984b) using a dataset of 73 dairy and beef cows. Andrew et al. (Reference Andrew, Erdman and Waldo1995) reported a relatively low R 2 value (0·51) in the linear relationship between EB water mass and LW, but this might be due to a small number of dairy cows (n=21) used. Although EB water/EBW varies between lactation number and stage of lactation in the present study, addition of milk yield, lactation number or BCS as supporting predictors did not improve the relationship between EB water mass and LW. The present internal validation also indicated no improvement in prediction accuracy in terms of MPE and s.e., by including BCS as a supporting predictor over LW to predict EB water mass. This result demonstrates that LW alone is a good predictor of EB water mass in lactating dairy cows. LW has also been shown to be a better indicator of EB water mass than the urea dilution technique (Andrew et al. Reference Andrew, Erdman and Waldo1995; Agnew et al. Reference Agnew, Yan, McCaughey, McEvoy, Patterson, Porter and Steen2005).
In conclusion, EBW and EB masses of CP and water can be accurately predicted from LW alone, while use of LW alone to predict EB masses of fat and GE can result in large errors. Therefore, other live animal factors (BCS, milk yield, parity and stage of lactation) should be added as supporting predictors to improve the prediction accuracy for EB fat mass and GE content.
Validation accuracy for prediction equations published elsewhere
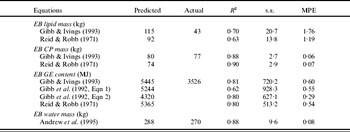
The one-third dataset, used for the internal validation as reported previously, was also used to validate a range of equations published elsewhere during the last 40 years. The details of the equations evaluated are presented in the footnote of Table 7 and the results presented in Table 7. The reasons for selection of these equations were: (1) they were developed from body composition data of slaughtered dairy cows, (2) they were published in refereed scientific journals and (3) the predictors used in these equations were available in the present dataset. Use of LW or EBW alone to predict EB mass of protein (Reid & Robb Reference Reid and Robb1971; Gibb & Ivings Reference Gibb and Ivings1993) and water (Andrew et al. Reference Andrew, Erdman and Waldo1995) produced good prediction accuracy, with a low MPE and a high R 2 in the relationship between predicted and actual data. These results were similar to those derived from the present internal validation. This could be mainly attributed to the fact that the variation in EB CP proportion in dairy cows is small, irrespective of source of data, stage of lactation and parity, as discussed previously. For example, EB CP proportion was 185 g/kg EBW in the present study, 172 g/kg EBW in Gibb et al. (Reference Gibb, Ivings, Dhanoa and Sutton1992) and 179 g/kg EBW in Andrew et al. (Reference Andrew, Erdman and Waldo1995) for lactating Holstein cows. Similarly, the agreement in prediction accuracy in EB water mass between the present study and Andrew et al. (Reference Andrew, Erdman and Waldo1995) is mainly due to a similar EB water proportion between these two studies (644 v. 631 g/kg EBW, the latter for lactating cows only).
Validation of published equations for EB component mass using one-third of present data as used in the internal validation (Table 6)Footnote *

* MPE, mean prediction error; R 2 was derived from the relationship between predicted and actual data.
Equations used are presented below:
- EB lipid mass (kg)
=41·86×BCS+0·292×LW−162·5 (Gibb & Ivings Reference Gibb and Ivings1993)
=0·367×EBW−61·6 (Reid & Robb Reference Reid and Robb1971)
- EB CP mass (kg)
=0·0997×LW+22·37 (Gibb & Ivings Reference Gibb and Ivings1993)
=0·149×EBW+11·2 (Reid & Robb Reference Reid and Robb1971)
- EB GE content (MJ)
=1615×BCS+13·88×LW−6750 (Gibb & Ivings Reference Gibb and Ivings1993)
=19·3×LW−5854 (Gibb et al. Reference Gibb, Ivings, Dhanoa and Sutton1992, Eqn 1)
=22·4×EBW−5045 (Gibb et al. Reference Gibb, Ivings, Dhanoa and Sutton1992, Eqn 2)
=(4·381×EBW−549·3)×4·184 (Reid & Robb Reference Reid and Robb1971)
- EB water mass (kg)
=79·07+0·3627×LW (Andrew et al. Reference Andrew, Erdman and Waldo1995)
However, the results for prediction of EB fat mass and GE content using equations reported by Reid & Robb (Reference Reid and Robb1971), Gibb et al. (Reference Gibb, Ivings, Dhanoa and Sutton1992) and Gibb & Ivings (Reference Gibb and Ivings1993) were very poor. The predicted EB GE content was 23–54% higher and EB fat mass was over two times greater than the actual data and consequently this considerable over-prediction resulted in a very high MPE. The reason for the poor prediction accuracy could be related to the difference in EB fat proportion between the present study and Reid & Robb (Reference Reid and Robb1971) and Gibb et al. (Reference Gibb, Ivings, Dhanoa and Sutton1992). For example, EB proportions of fat (198 v. 104 g/kg) and GE (11·7 v. 8·4 MJ/kg) in the study of Gibb et al. (Reference Gibb, Ivings, Dhanoa and Sutton1992) were much higher than that in the present study. This reflects the much higher genetic merit of cows in the present study compared to those used by Gibb et al. (Reference Gibb, Ivings, Dhanoa and Sutton1992) (7350 v. 4807 kg milk/lactation). There is increasing evidence that improvement of cow genetic merit reduces EB fat proportion (Agnew & Yan Reference Agnew and Yan2000).
There are also other factors that could affect the prediction accuracy for EB fat mass and GE content for the published equations. Firstly, although Gibb & Ivings (Reference Gibb and Ivings1993) used both LW and BCS for prediction of EB fat mass and GE content, these two variables were used as independent factors (EB fat or GE=aLW+bBCS+c). In the present study, BCS was used as an interaction factor with LW (EB fat or GE=[a+bBCS+ …]×LW+c). Total weight and component mass for a change of one unit BCS depend on the body size (LW) of the animal. The larger the body size, the higher the weight gain or loss for one unit change in BCS. This was built into the NRC energy rationing system for dairy cows (NRC 2001). Secondly, the present study also used milk yield as a supporting predictor to LW and BCS. As discussed previously, EB fat proportion was negatively related to milk yield (Table 2). This negative relationship reflects not only the effect of stage of lactation (milk yield) on body condition, but also the variation of fat proportion in LW gain during lactation. Water proportion in LW gain is higher during early than late lactation (high v. low milk yield, Agnew & Yan Reference Agnew and Yan2000).
The energy content for each kg difference in LW of lactating dairy cows gaining or losing LW (19 MJ/kg) reported by Gibb et al. (Reference Gibb, Ivings, Dhanoa and Sutton1992) was adopted as an estimate of the energy content of LW change by the AFRC (1993) and UK Feed into Milk projects (Agnew et al. Reference Agnew, Yan, France, Kebreab, Thomas and Thomas2004). Both systems are widely used in the UK for energy rationing for current high genetic cows. However, results of the present study indicate that the equation of Gibb et al. (Reference Gibb, Ivings, Dhanoa and Sutton1992) over estimated the energy content of LW if used for current high genetic merit dairy cows. Consequently, to improve the production efficiency and animal welfare, there is an urgent need to update the energy requirement or release for 1 kg LW change for current high genetic merit cows.
CONCLUSIONS
A range of linear, quadratic and multiple regression models have been developed in the present study to predict the EB data of dairy cows from live animal characteristics. An internal validation indicated that these models could be used to predict accurately EBW and EB masses of protein, fat and water and total energy content. These models therefore present researchers, nutritionists and dairy farmers with an opportunity to predict the body composition of individual animals. However, validation of equations published elsewhere over 10 years ago indicated that use of these equations (e.g. Gibb et al. Reference Gibb, Ivings, Dhanoa and Sutton1992) to predict body component mass of fat or GE for current dairy cows could result in considerable errors. The accurate prediction of body composition is a key element in the development of appropriate management and nutritional strategies to improve production efficiency, animal welfare and the efficiency of nutrient utilization.
This study was funded by the Department of Agriculture and Rural Development of Northern Ireland. The authors wish to thank their colleagues for the collection of live animal data and body composition analysis and Dr D. Kilpatrick for advice on statistical analysis.