Introduction
Accurately identifying macroinvertebrate species is important for biomarker, population and species biodiversity studies. However, when a high level of morphological variation is present within a genus, it can be difficult to describe and delineate species, and to identify characters that are taxonomically informative from those that vary within a species. The expression of some morphological traits can be sensitive to environmental conditions, producing a variety of phenotypes. For example, shell morphology is influenced by thermal conditions in the aquatic snail genus Physa (Britton & McMahon, Reference Britton and McMahon2004) and by salinity in the ostracod genus Mytilocypris (Finston, Reference Finston2007). Thus, while shell morphology is used as a taxonomic character in these groups, it may not accurately identify species. Determining which morphological characters vary between individuals of a species can be further complicated if similar or cryptic species commonly co-exist in the same habitat (Tokeshi, Reference Tokeshi, Armitage, Cranston and Pinder1995). Furthermore, some groups lack obvious morphological characters in immature life stages that could be used for species identification. For example, many immature life stages of aquatic Diptera remain undescribed or misidentified due to high diversity and few reliable morphological characters for species identification (Moulton, Reference Moulton2000; Brown, Reference Brown2005; Wagner et al., Reference Wagner, Barták, Borkent, Courtney, Goddeeris, Haenni, Knutson, Pont, Rotheray, Rozkošný, Sinclair, Woodley, Zatwarnicki and Zwick2008).
A combination of molecular and morphological approaches may be effective for separating species and to identify useful morphological characters. Molecular approaches have proven useful for separating species in morphologically cryptic invertebrate groups and can also be used to help determine what morphological characters might be useful for taxonomic descriptions (Hebert et al., Reference Hebert, Penton, Burns, Janzen and Hallwachs2004; Carew et al., Reference Carew, Pettigrove and Hoffmann2005; Buhay & Crandall, Reference Buhay and Crandall2009; Novo et al., Reference Novo, Almodóvar, Fernández, Trigo and Díaz Cosín2010). In chironomids, molecular methods have proven useful for species discrimination where there is lack of informative morphological characters (Sharley et al., Reference Sharley, Pettigrove and Parsons2004; Pfenninger et al., Reference Pfenninger, Nowak, Kley, Steinke and Streit2007; Sinclair & Gresens, Reference Sinclair and Gresens2008).
Larvae of the chironomid genus Procladius (Diptera: Chironomidae) are commonly collected in freshwater environments. Species in this genus inhabit a range of conditions, including highly polluted waters, and have been used to study the sub-lethal effects of pollutants through characterizing larval, antennal and mouthpart deformities (Pettigrove, Reference Pettigrove1989; Dermott, Reference Dermott1991; Warwick, Reference Warwick1991; Townsend et al., Reference Townsend, Pettigrove, Carew and Hoffmann2009). Taxonomically, Procladius is a difficult group; it has high levels of intra-specific variability and lacks clear differences between species at some life stages, which has impeded the ability of taxonomists to delineate species within the genus (Moore & Moore, Reference Moore and Moore1978; Cranston, Reference Cranston2000).
There are currently five described Procladius species in Australia. Procladius paludicola Skuse and P. villosimanus Kieffer are common, widespread and distinct from each other, while P. squamifer Freeman found in south eastern Australia are distinct as pupae and adults, but larvae cannot be distinguished from P. paludicola (Freeman, Reference Freeman1961; Cranston & Martin, Reference Cranston and Martin1996; Cranston, Reference Cranston2000). Another species, P. goanna Roback, found in northern Australia, is described as an adult with tentative placement for immature stages, while P. martini Roback, found in south eastern Australia, is described at all life stages although it is not easily separable from P. villosimanus (Roback, Reference Roback1982). Cranston (Reference Cranston2000) proposes that ‘ecophenotypes’ or environmental factors affecting phenotypes may exist in Procladius, based on material examined from the Northern Territory, Australia. Cranston (2000) suggests that P. paludicola, P. villosimanus and P. squamifer are distinct species but is sceptical of the existence of additional species, particularly given potential allometry associated with size dependent characters.
Here, we use a combination of molecular and morphological approaches to identify the status of Procladius from southern Australia. We use sequence from the mitochondrial Cytochrome oxidase I (COI) and Cytochrome b (Cyt b) genes and the nuclear Carbamoylphosphate synthetase (CAD) gene to determine whether Procladius species fell into multiple groups or ‘genetic clusters’ and examine sequence variation between and within these clusters. We also measure several characters commonly used to describe species to examine allometric ratios and, where possible, link our Procladius specimens to existing taxonomic descriptions.
Methods
Field collections
Procladius larvae and pupae were collected from 64 wetlands or streams in autumn and spring between 2002 and 2009. The majority of sites (53) were located within the greater Melbourne area, which encompassed a 100-km radius of the city of Melbourne, Australia. We also included specimens from seven sites in Sydney, New South Wales, two sites in Adelaide, South Australia, and two sites in Perth, Western Australia. Adult Procladius were also collected from several microcosm experiments conducted north of Melbourne and were used to assist in species identification.
DNA extraction and PCR-RFLP analysis
An initial screen of molecular variation in Procladius was completed by subjecting 366 individuals from 49 sites to PCR-RFLP analysis of the 709 bps of the COI region. Larvae for DNA analysis were dissected to remove head capsules and posterior parapods, which were mounted in Hoyer's mounting medium for morphological examination. DNA was extracted from the remaining bodies using the Chelex-100 resin method described in Carew et al. (Reference Carew, Pettigrove and Hoffmann2003). Primers 911 and 912 (Guryev et al., Reference Guryev, Mararevitch, Blinov and Martin2001) were used to amplify a 709-bp region of COI. Conditions for PCR and restriction digests are described in Carew et al. (Reference Carew, Pettigrove and Hoffmann2003). Digests were done with four restriction enzymes: Hinf I, Rsa I, Ssp I and Taq I, which were found to be useful in delineating species-specific nucleotide differences in chironomids (Carew et al., Reference Carew, Pettigrove and Hoffmann2003). The exact size of fragments resulting from each digest was calculated by importing COI sequence data (see below) into NEB cutter V2.0 (http://tools.neb.com/NEBcutter2/).
After the initial COI PCR-RFLP screen of larvae, we searched our archived Procladius material for pupae and adults, and completed a second COI RFLP screen. Pupae and adult Procladius were extracted using CTAB extraction. Pupae were extracted by first puncturing the pupal skin several times with a small scalpel blade. Soft tissues were digested out from pupae using 5 μl of Proteinase K in 100 μl of CTAB overnight at 37°C. Pupal skins were then removed and mounted in Hoyer's medium for morphological examination. The DNA in the CTAB lysate was extracted by adding 100 μl of chloroform isoamyl alcohol (24:1), inverting the tube and spinning at 13,000 rpm for 5 min. The top layer was separated and placed in a new microcentrifuge tube. The DNA was precipitated by adding 200 μl of cold ethanol and 5 μl of 5 M NaCl and left at −20°C for >2 h. The DNA was then pelleted by spinning at 13,000 rpm for 15 min at 4°C. DNA pellets were washed with 70% ethanol and eluted in 20 μl ddH2O. The same extraction method was used for adults, except delicate structures such as wings, antennae and legs were mounted prior to beginning the DNA extraction.
Sequence analysis
All unique COI RFLP profiles found in the initial screen were sequenced for the mitochondrial cytochrome oxidase I (COI) and cytochrome b (Cyt b) genes and the nuclear carbamoylphosphate synthetase (CAD) gene. Multiple individuals were sequenced for common RFLP haplotypes or those that showed inconsistencies with morphology (i.e. Haplotype 4). Unfortunately, not all individuals that could be amplified and sequenced for COI and Cyt b could be sequenced for CAD, most likely due to low concentrations of suitable DNA remaining in Chelex extractions. To improve success, we designed a second reverse primer for CAD (5′ GCAAATCCATGATTTTGMGATGTC 3'), which enabled us to amplify some additional individuals. We also included sequence from interstate specimens, any pupae or adults that had novel RFLP profiles for COI and eight P. villosimanus samples from another study (M. Carew, unpublished data) (table 1). Ablabesmyia notabilis Skuse, Fittkauimyia disparipes Karunakaran, Monopelopia sp. Fittkau, and ‘Anatopynia’ pennipes Freeman were used as outgroups for the phylogenetic analysis. Sequencing reactions and runs were done by Macrogen (Seoul, Korea). All gene products were sequenced in both directions, and forward and reverse sequences were aligned and manually edited in Sequencher (version 3.2.1; Genecodes, Ann Arbor, Michigan). Consensus sequences were aligned using ClustalX 1.84 (Thompson et al., Reference Thompson, Plewniak and Poch1999) and analysed by a distance-based method (neighbour-joining) as implemented in MEGA (available from: www.megasoftware.net) and character-based method (maximum parsimony) as implemented in PAUP* (Swofford, Reference Swofford2003). Neighbour-joining trees were constructed using the distance calculated from the Kimura-2-parameter (K2P) model. Maximum parsimony analysis was completed with 100 heuristic searches using random addition of sequences and tree bisection–reconnection. For both methods, all codon positions were considered. Bootstrap re-sampling was applied based on 1000 replicates. Pairwise sequence divergences within and between genetic clusters for each gene were calculated under a K2P model in MEGA.
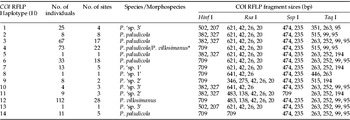
The distribution of COI PCR-RFLP haplotypes for Procladius larvae collected from the greater Melbourne area (Victoria) and the Sydney area (New South Wales). The number of individuals belonging to each haplotype and the number of sites where haplotypes were found are given. The sizes of fragments resulting from each digest are also given.

* H4 can be split using either Dde I (P. villosimanus=601, 22, 8 bps & P. paludicola=307, 283, 22, 11, 8 bps) or Ase I (P. villosimanus=431, 200 bps & P. paludicola=367, 200, 64 bps).
Taxonomic identification and morphology
Keys and description by Freeman (Reference Freeman1961) were followed for adults, and keys and/or description by Roback (Reference Roback1982) and Cranston (Reference Cranston2000) were followed for pupae and larvae. Any genetic cluster determined by sequence analysis that was distinct, based on morphology, but could not be linked to existing taxonomic keys or descriptions, is defined as ‘sp.’; these discrete morphospecies could represent a new species or an unknown life stage of a described species. Measurements and observations of larvae and pupae were made where sequence data showed discrete genetic cluster or clades (i.e. a group of individuals showed >5% average sequence divergence from other groups for at least two genes and showed strong grouping, as indicated by bootstraps values). Measurements of larvae and pupae were compared to Roback (Reference Roback1982) to confirm species identity. We aimed to measure individuals from different sites throughout the geographical range where possible, with 4th instar larvae measured. All measurements and photographs were made using NIS element BR (Nikon Instruments Inc., Melville, New York) and CombineZP (http://www.hadleyweb.pwp.blueyonder.co.uk/CZP/files.htm). Discriminant analysis was done with SPSS 18.0 for Windows (SPSS Inc., Chicago, Illinois) to test whether the larval measurements (we did not include ratios) were consistent with molecular variation. For discriminant analysis, species/morphospecies, as determined through the sequence data, was used as the grouping variable and a within-group covariance matrix computed. Larval measurements were entered as independents in a stepwise manner to determine discriminating variables, and standardized canonical discriminant functions were computed based on significant variables. We also examined pupae for morphological characters that supported genetic clusters. Vouchers of the species collected in our study were submitted to the Museum of Victoria, Australia.
Results
PCR-RFLP and sequence analysis
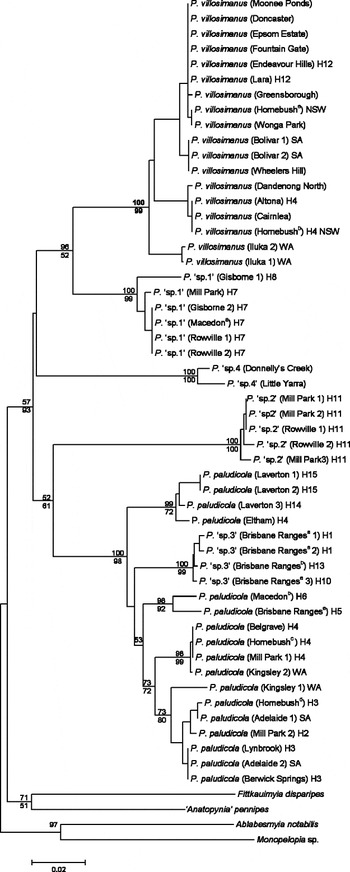
Restriction analysis of Procladius larvae revealed 14 different COI haplotypes (table 1). Individuals belonging to the most common haplotype (H12) could be identified as P. villosimanus. Using morphological keys for larvae, only P. villosimanus could be accurately recognised as a species, all remaining larvae are described as ‘resembling P. paludicola’ due to the difficulty in distinguishing species at the larval life stage. The second most common haplotype, H4, was composed of a mixture of species, belonging to P. villosimanus (39 individuals) and individuals resembling P. paludicola (34 individuals). When individuals from H4 were sequenced for COI, they fell into two separate clades that supported morphological separation (fig. 1), and subsequent analysis of sequence in NEBcutter revealed either Dde I or Ase I were able to separate these species (table 1). According to the taxonomic keys of Cranston (Reference Cranston2000), all the individuals with the remaining haplotypes keyed to P. paludicola.
A COI neighbour-joining tree for Procladius species based on 631 bp of sequence. The location for the collection of each individual is given; numbers refer to multiple individuals from the same location and superscripts multiple sites at the same location. All specimens are larvae, except for pupal specimens of P. ‘sp. 4’. Samples not collected from the greater Melbourne area, Victoria, are indicated (SA, South Australia; WA, Western Australia; NSW, New South Wales). The COI PCR-RFLP haplotype is given for samples included in the initial screen. Bootstrap values for NJ (above) and parsimony (below) are based on 1000 replicates with bootstrap values between species shown (except for P. paludicola).

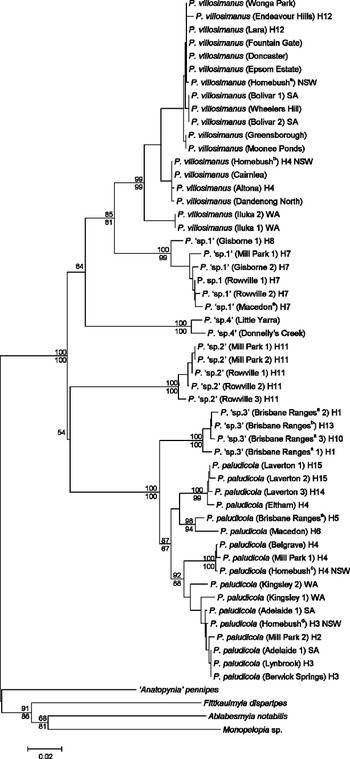
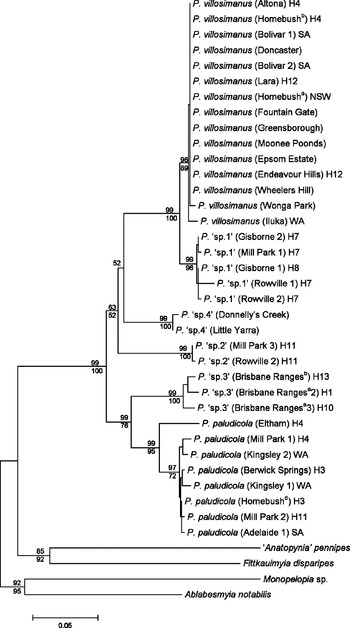
Sequence analysis of all 14 COI haplotypes, plus the additional sequences generated from pupal specimens, interstate larvae and the P. villosimanus from another study for COI, Cyt b and CAD suggested multiple Procladius species. All sequences were deposited in Genbank (see Appendix 1). All three genes suggested our samples contained at least five genetic clusters, which were in separate clades supported by bootstrap values greater than 99 (figs 1–3). The phylogenetic analysis of the CAD sequence suggested a sixth genetic cluster (P. ‘sp. 3’) which was separate from P. paludicola (fig. 3). This was supported by bootstrap values greater than 99 and with P. ‘sp. 3’ separated by average sequence divergence of 9.5% from P. paludicola (fig. 3, table 2). The existence of P. ‘sp. 3’ was supported by Cyt b (fig. 2) and morphology (see below). Although COI placed P. ‘sp. 3’ within P. paludicola (fig. 1), the average sequence divergence between these clades (P. ‘sp. 3’ and P. paludicola) was 4.9%. The alternate placement between P. ‘sp. 3’ and P. paludicola individuals from Laverton and Eltham among the three genes suggests it is possible that additional genetic clusters exist within P. paludicola. However, we left these as P. paludicola, as they were separated by <5% average sequence divergence from other P. paludicola for all three genes and, unlike for P. ‘sp. 3’, there was no morphological evidence to support denoting this genetic cluster as an additional morphospecies.
A cytochrome B neighbour-joining tree for Procladius species based on 764 bp of sequence. The location for the collection of each individual is given; numbers refer to multiple individuals from the same location and superscripts multiple sites at the same location. All specimens are larvae, except for pupal specimens of P. ‘sp. 4’. Samples not collected from the greater Melbourne area, Victoria, are indicated (SA, South Australia; WA, Western Australia; NSW, New South Wales). The COI PCR-RFLP haplotype is given for samples in included in the initial screen. Bootstrap values for NJ (above) and parsimony (below) are based on 1000 replicates with bootstrap values between species shown (except for P. paludicola).

A CAD neighbour-joining tree for Procladius species. All specimens are larvae, except for pupal specimens of P. ‘sp. 4’. The location for the collection of each individual is given; numbers refer to multiple individuals from the same location and superscripts multiple sites at the same location. Samples not collected from the greater Melbourne area, Victoria, are indicated (SA, South Australia; WA, Western Australia; NSW, New South Wales). The COI PCR-RFLP haplotype is given for samples in included in the initial screen. Bootstrap values for NJ (above) and parsimony (below) are based on 1000 replicates with bootstrap values between species shown (except for P. paludicola).

Average % pairwise sequence divergence between species/morphospecies for COI, Cyt b and CAD. Average pairwise sequence divergence within species/morphospecies is also given along the diagonal in italics.

* Fewer individuals were considered in pairwise comparisons for CAD.
Sequence divergences across all genes typically showed low diversity within genetic clusters (table 2). The highest intra-specific variation was observed in P. paludicola with an average sequence divergence of 3.3% compared to P. villosimanus at <1.7%, despite a similar number of samples being sequenced across a comparable geographical range (i.e. Perth, WA to Sydney NSW separated by >3000 km) (table 2). However, this was only the case for the mitochondrial genes, with CAD showing higher diversity in P. villosimanus. The remaining Procladius morphospecies were less common, compared to P. villosimanus and P. paludicola, and were found at a few sites. They were collected from Victoria and, with the exception of P. ‘sp. 4’, co-existed with other Procladius. Average sequence divergence tended to be low at <1.7%. Some morphospecies were found in specific regions. Procladius ‘sp. 3’ was found in the Brisbane Ranges National Park (a forested area surrounded by farmland to the West of Melbourne), and P. ‘sp. 4’ was found at two stream sites in forested areas north east of Melbourne. Neither P. ‘sp. 3 nor P. ‘sp. 4 were found in urbanised areas, which tended to be dominated by P. villosimanus and P. paludicola.
Morphological analysis
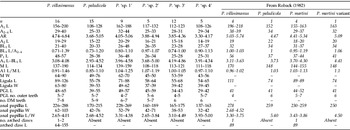
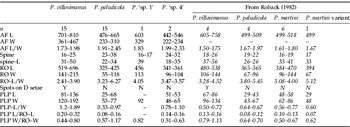
Larval and pupal morphological measurements were taken and compared to those of Roback (Reference Roback1982) and adults to the descriptions of Freeman (Reference Freeman1961). COI PCR-RFLP profiles (table 1) or DNA sequencing was used to link different life stages. Larval and pupal measurements for P. villosimanus largely overlapped with those of Roback (Reference Roback1982), but our measurements tended to cover a greater geographical range and considered more individuals (tables 3 and 4). Only measurements and ratios of the respiratory organs differed; Roback's measurements showed little or no overlap with our measurements/ratios, which tended to be larger (table 4). We also found that immature life stages of P. villosimanus could be reliably identified using morphological characters described by Roback (Reference Roback1982) and Cranston (Reference Cranston2000). Larvae could be distinguished by 1–2 strongly arched claws on the rear parapods. Roback (Reference Roback1982) described this character in P. martini, but we did not observe it in any of the other species or morphospecies we collected, despite our samples being collected from similar locations to Roback's P. martini samples. Pupal P. villosimanus were large (table 4) and had abdominal D setae arising from pigmented spots. We also examined eight adults of P. villosimanus, which fitted the descriptions of Freeman (Reference Freeman1961), confirming our identification of this species.
Ranges of Procladius larval measurements compared to Roback (Reference Roback1982) (in italics).

Abbreviation of the terms used follows Roback (Reference Roback1982). A1, antennal segment 1; A2–4, antennal segment 2–4; AR, antennal ratio (A1 A2–4–1); A2, antennal segment 2; BL1, antennal blade; P1, maxillary palpus segment; M, mandible; PGL, paraligula; DM, dorsomentum; L, length; W, width.
Ranges of Procladius pupal measurements compared to Roback (Reference Roback1982) (in italics).

Abbreviation of the terms used follows Roback (Reference Roback1982). AF, anal fin; Spine, spines on anal fins; RO, respiratory organ; PLP, plastion plate of respiratory organ.
Larval and pupal measurements for P. paludicola mostly overlapped with the measurements of a single individual taken by Roback (Reference Roback1982). Our measurements were smaller for several larval characters (length of antennal segment 1, antennal segments 2–4, antennal blade, mandible and anal papilla), but Roback's measurements were just outside the range of our measurements (table 3). For pupae, the number of spines on the anal fins differed from Roback (Reference Roback1982). Typically, we found that P. paludicola had more spines on the anal fins than indicated in Roback (Reference Roback1982) (table 4). All other morphological characters, such as pale/hyaline pupal skin with smooth wing sheath and the lack of strongly arched claws on the rear parapods of larvae, were consistent with morphological characters described by Cranston (Reference Cranston2000) and Roback (Reference Roback1982). We also examined six adults of P. paludicola which fitted the descriptions of Freeman (Reference Freeman1961), further confirming identification of this species.
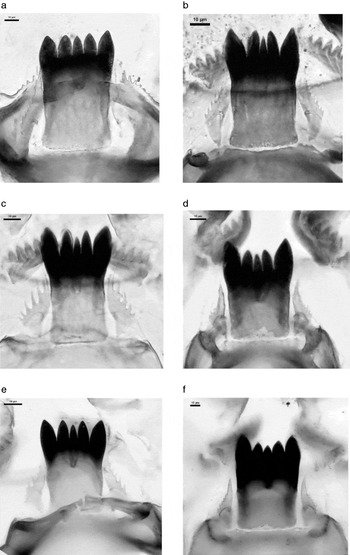
The remaining morphospecies were less common, and we were unable to examine all life stages. Both larvae and a pupa were examined for Procladius ‘sp. 1’. Many of these measurements overlapped with Roback's (Reference Roback1982) measurements for P. martini and a specimen he describes as ‘P. martini variant’ for both larvae and pupae (tables 3 and 4). Ligula and paraligula (analogous to the ‘paraglossa’ in Roback (Reference Roback1982)) measurements varied in larvae (table 4). Furthermore, larvae of this morphospecies appeared to have larger median teeth on the ligula compared to the other Procladius, and all ligula teeth were of equal length (fig. 4). Anal fin length, respiratory organ width and plastron width varied from the other Procladius although we examined a single pupa. Procladius ‘sp. 1’ largely fitted the description of P. martini Roback (Reference Roback1982), as this morphospecies was the only one that was intermediate in size between the larger P. villosimanus and smaller P. paludicola. Although we did not observe any arched claws on the rear parapods as described by Roback (Reference Roback1982) for P. martini, we note this character was absent in an individual Roback described as a ‘P. martini variant’ (table 3).
The ligula and paraligula of Procladius species (a) P. ‘sp. 1’, (b) P. ‘sp. 2’, (c) P. ‘sp. 3’, (d) P. ‘sp. 4’, (e) P. paludicola and (f) P. villosimanus. Scale bars show 10 μm.

Procladius ‘sp. 2’ was found as a larva, and measurements of this morphospecies showed little overlap with any of the species described by Roback (Reference Roback1982) (table 3). Procladius ‘sp. 3’ was found as larvae and also as four adults. These larvae had little overlap with the species described by Roback (Reference Roback1982), having smaller measurements for most characters (table 3). However, the paraligula of this morphospecies differed when compared to the other Procladius (fig. 4c). All individuals belonging to this morphospecies had broad paraligula with long spines, showing that this morphospecies could potentially be differentiated at the larval life stage (fig. 4). Adults for this morphospecies most closely fitted the description of P. paludicola and could not be distinguished based on the keys of Freeman (Reference Freeman1961).
Procladius ‘sp. 4’ was found when searching previous collected material for pupae. Both pupae and larvae were examined for this morphospecies, which showed smaller measurements than those given by Roback (Reference Roback1982) for both pupae and larvae. However, the number of spines on the anal fin pupae was higher than observed for any species described by Roback (Reference Roback1982). We also noted that this morphospecies had squared anal fins when compared to other Procladius and was less pale/hyaline than the comparably-sized P. paludicola.
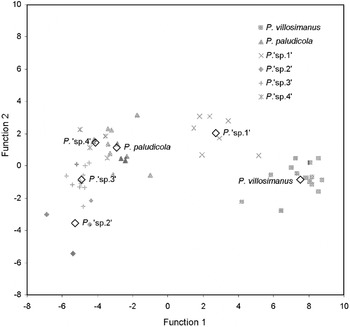
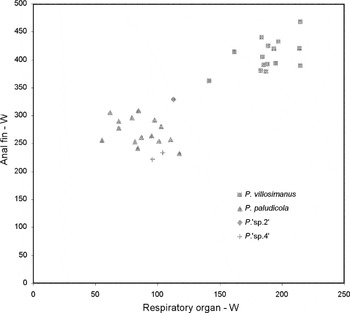
Discriminant analysis supported grouping determined by molecular analysis for both Procladius larvae and pupae. For larvae, pooled within-group correlations between discriminating variables and standardized canonical discriminant functions showed that function 1 was associated with ligula width, antennal segment 1 length, maxillary palp segment 1 length and anal papillia length. Function 2 was associated with paraligula length, function 3 with mandible width and function 4 with maxillary palpus segment 1 length and anal papillia length. The first four functions covered 99.9% of the variance, with function 1 covering 86.2% of the variance. Function 1 and 2 showed clear separation of the Procladius species/morphospecies, with the exception of P. ‘sp. 4’ from P. paludicola (fig. 5). However, these were separated by functions 3 and 4. For pupae two variables, anal fin width and respiratory organ width, were significant for discriminating species/morphospecies. We excluded P. ‘sp. 2’ from this analysis as there was a single individual (fig. 6). These characters clearly separated pupae of P. villosimanus from P. paludicola. Procladius ‘sp. 4’ was grouped separately by the discriminant analyses in spite of its proximity to P. paludicola in fig. 6.
Discriminant analysis of larval head capsule characters of Procladius species based on DNA identification for function 1 versus function 2. Centroids are given for each species/morphospecies.

Procladius pupal measurements of anal fin width (W) versus respiratory organ width.

Discussion
Molecular methods are becoming more fully integrated with classical taxonomic techniques. The benefits of combining these approaches for discovering new species, and for understanding variability within and between species, are being increasingly recognized. Our study suggests that multiple species of Procladius exist based on both molecular and morphological evidence. We were able to link the two most common Australian Procladius species, P. villosimanus and P. paludicola, to existing descriptions. We also found strong evidence for at least four additional Procladius species in southern Australia which may include P. squamifer or P. martini. Unfortunately, definitive links to these species could not be made, due to the lack of a detailed description of immature stages of P. squamifer (Cranston, Reference Cranston2000). Moreover, our P. ‘sp. 1’, which was similar to P. martini, lacked a key morphological character used for identification (arched claws on the rear parapods) (Roback, Reference Roback1982).
PCR-RFLP of COI has proven useful for identifying a variety of chironomid species (Carew et al., Reference Carew, Pettigrove and Hoffmann2003, Reference Carew, Pettigrove and Hoffmann2005, Reference Carew, Pettigrove, Cox and Hoffmann2007a; Sharley et al., Reference Sharley, Pettigrove and Parsons2004). In this study, we found PCR-RFLP of COI was a useful means of summarising the sequence diversity in a large number of Procladius individuals and for determining a representative sample for DNA sequencing. However, we found one instance where using a panel of four restriction enzymes, applied in a previous study (Carew et al., Reference Carew, Pettigrove and Hoffmann2003), resulted in a PCR-RFLP COI haplotype containing two species. This was discovered when examining the morphological characters on individual specimens. As the cost of sequencing continues to fall, sequencing a large panel of individuals collected from many sites over a broad geographical range may offer the best approach for molecular-based species exploration (DeSalle et al., Reference DeSalle, Egan and Siddall2005) rather than relying on PCR-RFLP.
Sequence information from multiple genes was important for discriminating Procladius species. Sequence analysis, together with morphological analysis, supported the separation of Procladius into at least six genetic clusters. However, phylogenetic analyses of COI sequences indicated the presence of fewer clusters, with P. ‘sp. 3’ not clearly distinguishable from P. paludicola (assuming that this is a single species), appearing paraphyletic to the P. paludicola or positioned within this clade. This was apparent using both neighbour-joining distance-based analysis advocated by Hebert et al. (Reference Hebert, Cywinska, Ball and deWaard2003) for making species identifications using DNA barcodes based on COI, and also by maximum parsimony character-based analysis suggested by DeSalle et al. (Reference DeSalle, Egan and Siddall2005) as alternative to distance-based analyses. Meyer & Paulay (Reference Meyer and Paulay2005) describe paraphyletic species as those where intra- and inter-specific variation, for a DNA marker, overlaps and, as a result, species cannot be reliably distinguished. Meier et al. (Reference Meier, Shiyang, Vaidya and Ng2006) suggest that this may occur commonly in Diptera when using COI as a DNA barcode; misidentifications are mostly due to wide overlap between intra- and inter-specific genetic variability. These authors found <70% success in identifying Diptera using 1333 mitochondrial COI sequences from 449 species with tree-based and other distanced-based measures (i.e. best match based on sequence similarity). In chironomids from the tribe Tanytarsini, there was one case of paraphyly and no clear gap between intra- and inter-specific genetic distance variation when 47 species were compared using COI (Ekrem et al., Reference Ekrem, Willassen and Stur2007). We have also found that species within the genus Cladoplema cannot be reliably distinguished using COI sequence data when considered over broad geographical ranges (Carew et al., Reference Carew, Pettigrove and Hoffmann2005). Although we did find potential paraphyly in Procladius, geographical factors did not affect how P. paludicola and P. villosimanus clustered, despite being collected from sites >3000 km apart.
Alternatively, there is the possibility that there may be cryptic Procladius species within the taxon currently defined as P. paludicola, particularly given the strong internal clustering of some P. paludicola individuals in the phylogenetic analyses. Thus, differences in the phylogenetic trees (i.e. the placement of P. ‘sp. 3’) attributed to paraphyly may actually be the result of different placement of additional species. Ideally, a more intensive investigation of P. paludicola would be needed to confidently assign new species. This should include a larger number of individuals using more DNA markers, particularly those useful for separating closely related species, and examining multiple life stages.
When looking at genes individually, we found the average inter- and intra-specific sequence divergences were higher for Cyt b compared to COI. We found that Cyt b was better at phylogenetically separating our six Procladius species/morphospecies and also had the greatest gap between average intra- and inter-specific sequence variation (∼2.9%). Genetic clusters, indicated by Cyt b, were congruent with CAD and morphological data. Cyt b has been favoured for species identification in mammals where it typically can distinguish more species than COI (Hajibabaei et al., Reference Hajibabaei, Singer, Clare and Hebert2007). It appears that this is also the case for the Procladius we examined. Whether this applies to other chironomid or extends to other Dipteran groups is unclear, as many studies tend to focus on the success of COI for species identification.
Incorporation of nuclear genes is valuable for species identification, as they are independent of the maternal inherited mitochondrial genes and provide a test of mitochondrial introgression across species. Moulton & Wiegmann (Reference Moulton and Wiegmann2004) suggested CAD as having considerable phylogenetic utility when tested within the Eremoneura (true flies). We found CAD was useful for confirming genetic clusters in Procladius suggested by the mitochondrial genes, in particular Cyt b. We found no evidence of mitochondrial introgression which has been recorded in other closely related chironomid species (Martin et al., Reference Martin, Guryev and Blinov2002). Thus, CAD may represent a useful gene to confirm mitochondrial-based species identification among chironomids and other Diptera, especially given the availability of degenerate primers that amplify a wide range of taxa (Moulton & Wiegmann, Reference Moulton and Wiegmann2004).
Integrating morphological information where possible enables genetic clusters suggested by molecular analysis to be further tested. This can help to identify morphological characters that may have taxonomic signal (Carew et al., Reference Carew, Pettigrove and Hoffmann2005) and also test whether genetic clusters are supported by measurements which can detect subtle difference between species/morphospecies (Carew et al., Reference Carew, Pettigrove, Cox and Hoffmann2007a). We were unable to identify many new morphological characters in Procladius, which was not surprising given the taxonomic difficulty surrounding the genus. Only P. ‘sp. 3’ larvae showed a unique morphological character (large spines on the paraligula), which had not been seen before, and we also observed subtle differences in the teeth of the ligula, especially with P. ‘sp. 1’. We had more success when comparing measurements using discriminant analysis, which showed that our genetic clusters were supported by subtle differences in morphology. Even though we didn't specifically aim to examine allometry in Procladius, our study suggests that Cranston's (Reference Cranston2000) concerns with allometry in this genus may be justified. We observed substantial overlap in allometric ratios (e.g. antennal ratio) between species which were not evident in Roback's (Reference Roback1982) study. This was apparent even between the larger P. villosimanus and other smaller Procladius species. McKie & Cranston (Reference McKie and Cranston2005) suggest that allometric ‘ratios’ should be used cautiously in chironomid taxonomy, and our study suggests that ratios may not be useful for identifying Australian Procladius species. This view is further support by a study by Kobayashi (Reference Kobayashi1998) that showed seasonal induced size differences caused changes in allometry in the adult male genital structure of Procladius choreus in Japan. Unfortunately, morphological identification of many immature Procladius species is likely to be difficult, and molecular approaches may be the most reliable means of recognising species.
Our study suggests that there may be differences in the pollution sensitivities of Procladius species. We found some less common Procladius species in areas unaffected by urban pollution, but others, such as P. villosimanus and P. paludicola, at sites known to be highly polluted (Carew et al., Reference Carew, Pettigrove, Cox and Hoffmann2007b). This means caution should be applied when using species-level deformities to assess the affects of pollution, as Procladius species may respond differently to pollution. This is especially the case for studies using P. paludicola larvae that cannot be easily distinguished from other co-existing Procladius species. It is likely that Procladius species will continue to be used in deformity analysis, particularly given their dominance in macroinvertebrate surveys in lentic waterbodies in urban areas (Carew et al., Reference Carew, Pettigrove, Cox and Hoffmann2007b). Ideally, these studies should also employ molecular approaches for species identification to ensure that a single species is investigated.
A combination of both molecular and morphological techniques can provide important insight into species in taxonomically difficult groups. There is growing evidence that where traditional taxonomy is difficult, integration of molecular approaches can clarify species delineations (Packer et al., Reference Packer, Gibbs, Sheffield and Hanner2009). This has been found in groups like the nematodes (Ferri et al., Reference Ferri, Barbuto, Bain, Galimberti, Uni, Guerrero, Ferte, Bandi, Martin and Casiraghi2009), lepidopterans (Emery et al., Reference Emery, Landry and Eckert2009), fish (Ward et al., Reference Ward, Zemlak, Innes, Last and Hebert2005) and shrimp (Page et al., Reference Page, Choy and Hughes2005). Rather than simply barcoding a single gene or relying on morphological data alone, a combination of multi gene sequencing and morphological examination seems to work well for difficult chironomid groups.
Acknowledgements
We thank Renee Cox, Kallie Townsend, Matt O'Brien and Bryant Gagliardi for their assistance with field sampling and processing. We also thank Chris Madden and Vin Pettigrove for collecting interstate samples and Vin Pettigrove and Jon Martin for their assistance with species identifications and taxonomic discussion. This study was funded primarily by the Australian Research Council through their linkage and fellowship schemes, with additional support from Melbourne Water Corporation, the Victorian Government and EPA Victoria.
Appendix 1
The collection location, voucher code, life stage and Genbank accession numbers for chironomids sequenced for COI, Cyt b and/or CAD.