
I. INTRODUCTION
While the concept of the dislocation in a continuous elastic media goes back to Volterra in 1907, Reference Volterra1 it was in 1934 that the importance of atomic-scale dislocations to crystal plasticity was realised. Taylor, Reference Taylor2 Orowan, Reference Orowan3 and Polyani Reference Polanyi4 independently proposed that atomic-scale dislocations provide a mechanism and an explanation for plastic deformation under stresses orders of magnitude below the theoretical strength of solids. Not long after that, it was realised that the dislocation also introduces a length scale, the magnitude b of the Burger’s vector into the plasticity theory, thus enabling size effects. In the continuum plasticity theory, the amount of plastic deformation can be infinitesimal, and the theory predicts behavior independent of the size. By quantising or discretising the amount of plastic slip, the possibility of size effects is opened up.
Jan van der Merwe made an early key contribution during his Ph.D. in Bristol in the late 1940s. His work on crystal epitaxy led to the critical thickness theory, which predicts the stability of epitaxial strained layers. Reference Frank and van der Merwe5,Reference van der Merwe6 This theory has been fully developed and exploited within the field of semiconductor science and technology. It has been fundamental to underpin the technologies crucial to computers, later the internet, mobile phones, and indeed most of what has been termed as the fourth industrial revolution (after coal and steam, oil and steel, and computing). However, parallel developments in metallurgy and micromechanics, while perhaps less spectacular than the internet, have been just as important in enabling, for example, budget airlines. Generally, size effects in these areas have been much less well understood, with a plethora of theories, sometimes rival, sometimes complementary, but with little predictive power. Indeed, throughout the decades, a few authors have invoked aspects of critical thickness theory. Some are cited here, and we cited more in a recent article. Reference Li, Bushby and Dunstan7 But a referee of that article Reference Li, Bushby and Dunstan7 summed up what seems to be a common view, “that four classic theories do not fit well with the data and cannot be considered surprising. This is the reason we have several very good and useful models and ideas”. The problem with this view is that several theories are scarcely better or more useful than no theories, unless it can both be predicted and experimentally tested as to which theory or theories should and do apply in any given case.
In this author’s view, materials science has been held back by the failure to realise that van der Merwe’s theory and what flows from it is fully applicable to metals in general, indeed to all dislocation-mediated plasticity. There appear to be four main reasons for this failure, which are addressed here. The theory predicts a size effect in the yield or flow stress whenever plasticity is mediated by dislocations, a size effect that has a d −1 dependence on size d. It can potentially impact as much on the design of strong metals, ceramics, and composite materials, as it has done on the design of semiconductor lasers. This article summarises the published evidence for this view, together with discussion of new results and likely future developments.
II. THE EARLY YEARS
As early as 1942, Lawrence Bragg at the Cavendish Laboratory explained how the strength of polycrystalline metals depends on the crystallite size and the grain size, Reference Bragg8 what was later to become known as the Hall–Petch behavior. Reference Hall9,Reference Petch10 Bragg’s argument was precisely the quantisation of plastic deformation. If a dislocation with a Burgers vector of relevant magnitude b moves a distance d, e.g., from one side of a crystallite to the other, then the plastic deformation εpl in that region will be b/d. The elastic strain energy and stress are proportional to the elastic constants of a material, and in what follows the elastic constants are not important. It is accordingly convenient to normalise stress σ by the relevant elastic modulus M, as the dimensionless stress σ/M, which is also the elastic strain εel. Then in Bragg’s argument, the movement of the dislocation will be energetically favourable only if it relieves a dimensionless stress εel greater than or of the order of εpl. If not, it would be inducing a greater opposite elastic strain. Otherwise stated, Bragg’s criterion for deformation is that it should reduce the strain energy. Reference Kelly11 This gives a yield or flow dimensionless stress εel ∼ b/d. By 1949 Bragg had refined this to Reference Kelly11,Reference Bragg12
 $${\varepsilon _{{\rm{el}}}} \ge {b \over d}\left( {{2 \over \pi }\ln {d \over b} + 0.6} \right)\quad .$$
Also in 1949, Charles Frank and Jan van der Merwe in Bristol considered the stability of a misfitting epitaxial monolayer grown on a crystalline substrate. Reference Frank and van der Merwe5,Reference van der Merwe6 Doris Kuhlmann-Wilsdorf was at Bristol at this time. Shortly before the end of her life, she wrote, “the most important new knowledge I obtained at Bristol was the theory of epitaxy that Jan van der Merwe developed in his Ph.D. thesis under Frank. To my understanding, it ultimately made modern computers possible.” Reference Kuhlmann-Wilsdorf13 This theory predicts a critical misfit strain below which it is energetically favourable for the epitaxial monolayer to be elastically strained to perfectly register with the substrate, while at higher strains, the introduction of dislocations at the interface is favored, corresponding to plastic relaxation of the epitaxial monolayer.
In subsequent articles, van der Merwe and others extended this understanding to finite and infinite thickness bicrystals. Among them was John Matthews, who was a Ph.D. student at the University of Witwatersrand while van der Merwe was at the University of Pretoria. This led to Matthews setting out to test experimentally the theories of van der Merwe, with such success that in our understanding of epitaxy, Kuhlmann-Wilsdorf attributes to him the equivalent place in experiment to that of van der Merwe in theory. Reference Kuhlmann-Wilsdorf13 With coworkers such as the Ph.D. student Bill Jesser at the University of Virginia under Kuhlmann-Wilsdorf, Matthews studied at first strained epitaxial metal layers such as nickel on copper, Reference Matthews and Crawford14 platinum on gold, Reference Matthews and Jesser15 iron on copper, etc, and metals on alkali halides, but after moving to IBM Yorktown Heights, he concentrated on brittle ceramics under tensile strain Reference Matthews and Klokholm16 and then semiconductors. Reference Matthews and Blakeslee17 These articles led to the establishment of (Matthews) critical thickness theory (CTT) in the field of semiconductor strained layers. CTT is of great technological importance in semiconductor devices such as the high electron-mobility field-effect transistor and above all in the strained-layer laser, pioneered by Alf Adams of Surrey University—listed among the top ten greatest UK discoveries of all time, 18 for without it modern optical-fibre telecommunications (and the internet) would have scarcely been possible.
It is worth digressing slightly to indicate the key aspects of the Frank and van der Merwe theory, which led to its success in semiconductors. First, it was a rigorous thermodynamic equilibrium theory of a simple well-defined system, in a way in which the ideas of Bragg for polycrystalline metals could not be. As a thermodynamically sound calculation of the energies of the strained and relaxed epitaxial monolayer, without the complications of grain boundaries, of grain size distributions, dislocation dynamics, etc, it was indubitable, as were its extensions to thicker layers. And it agreed with the experimental evidence then available (Al on Pt, etc.).
Reference van der Merwe6
Secondly, it was experimentally testable in semiconductors. Both substrates and epitaxial growths could be of sufficiently high perfection to reveal the van der Merwe–Matthews equilibrium behavior without ambiguity. Matthews was able to postulate a mechanism (the turning-over of threading dislocations) that could be directly observed in the electron microscope—and was observed whenever it was looked for. The Matthews mechanism invoked the dislocation line tension, the curvature of a dislocation when it turns up to the free surface, and the Orowan stress corresponding to the curvature. All this is physically equivalent to the Frank and van der Merwe energy analysis but is much easier to understand. Nevertheless, it did take a while to become fully accepted. For example, in the 1980s, People and Bean
Reference People and Bean19
published data and theory supporting an h
c dependence on
 $\varepsilon _0^{ - 2}$
. Drigo et al.
Reference Drigo, Aydinli, Carnera, Genova, Rigo, Ferrari, Franzosi and Salviati20
observed that residual strain at thicknesses greater than h
c varied as the inverse square root of thickness, which they considered to be consistent with a number of theories such as that of People and Bean
Reference People and Bean19
but inconsistent with the equilibrium theory of Matthews. The inconsistencies were later seen to be due to kinetic constraints—nonequilibrium behavior in the data and to errors in the theory. In the next ten years, better control and understanding of growth and relaxation led to a clearer picture.
Reference Dunstan21
In parallel, work on the strength of metals continued at Cambridge and elsewhere. Bragg himself had transferred his interest by then to the structure of proteins and DNA. But two of his appointments at the Cavendish, at first Eric Hall in 1951 and then Nigel Petch in 1953 (by then in Leeds), established their eponymous Hall–Petch equation, according to which the strength of polycrystalline metals goes as the inverse square root of the grain size, a very clear size effect. Reference Hall9,Reference Petch10 Curiously, Hall and subsequent workers paid more attention to the theoretical predictions of Eshelby et al. Reference Eshelby, Frank and Nabarro22 for the pile-up of dislocations against grain boundaries than they did to the earlier work of Bragg so that the work on bulk polycrystalline metals ignored almost completely the insights of both Bragg and Frank and van der Merwe into the size effect. The Hall–Petch effect is discussed in more detail in Sec. III.D.
Several authors, including van der Merwe himself and Kuhlmann-Wilsdorf, Reference van der Merwe23,Reference Kuhlmann-Wilsdorf and van der Merwe24 and later Nix Reference Nix25 and Thompson, Reference Thompson26 tried to draw the attention of the metallurgy community to the ideas of van der Merwe and Matthews, yet this approach was generally (and widely) dismissed as relevant only to semiconductors. The purity and crystalline perfection of standard semiconductors were held in some way to set them apart so that the physics relevant to their behavior could not be applicable to the high dislocation densities, low purities, and polycrystallinity of bulk metals. Moreover, Matthews’ theory appeared to depend critically on the presence of an unstrained substrate and to take no account of strain gradients. This attitude was further supported, of course, by the fact that the experimental data for the grain-size effect in polycrystalline metals generally were satisfactorily fitted by the Hall–Petch inverse square-root law. So theories which predict the inverse square-root law were strongly favored over theories that predict any different dependence on size, such as the simple inverse of size that appears in Eq. (1), especially if the inverse square-root theories needed no unstrained substrate or if they took account of strain gradients. Perhaps most important was the fact that CTT appears to apply only to the yield stress and to say nothing about strain hardening and flow stress. For a very long time, metallurgists have regarded the concept of a yield stress with a degree of suspicion, compared with the directly measurable flow stress—thus in 1888 Unwin Reference Unwin27 wrote, “Materials like cast iron take a sensible though small set even with comparatively small loads, and the set increases regularly with the loads. Such materials have, strictly speaking, no elastic limit when first subjected to stress.” Proof stress (stress at, e.g., 0.2% deformation) has been the standard in engineering rather than yield stress.
Size effects were noticed elsewhere in the deformation of metals. The most dramatic was the extraordinary strength of single-crystal copper whiskers, reported by Sidney Brenner (University of Pittsburgh) in 1956. Reference Brenner28 Later, in indentation hardness testing, the hardness was found to rise for very small indentations. Initially, this was dismissed as an artifact of the measurement techniques, but by the 1990s it was becoming clear that it is a real effect. The invention of focused ion-beam milling enabled the easy manufacture of very small compressive test specimens. Together with in situ electron-microscopy imaging during micromechanical testing, it became quickly clear that small-diameter pillars became very much stronger as their diameter was reduced from 10 to 0.1 μm. A key article was that of Uchic et al. in which gold pillars were reported with strengths in the GPa range. Reference Uchic, Dimiduk, Florando and Nix29 With a wide range of metals and sizes soon reported by many labs, many data collections were made to try to establish the form of the dependence of strength on size (pillar diameter, d). Korte and Clegg, Reference Korte and Clegg30 for example, reported that FCC metals generally follow a power-law d −x with an exponent x close to 1, while BCC metals have x ∼ 1/2 and ceramics x ∼ 0.
Two other important articles in the 1990s were those of Norman Fleck and co-workers in Cambridge, Reference Fleck, Muller, Ashby and Hutchinson31 and of Tony Evans and his student James Stölken. Reference Stölken and Evans32 Thin wires in torsion and thin foils in flexion (sizes down to 10 μm) were shown to be stronger than corresponding bulk specimens (sizes greater than about 100 μm), in accordance with strain-gradient plasticity theory (SGP). This theory goes back to the classic article of Mike Ashby, Reference Ashby33 in which it was noted that a plastic strain gradient necessitates the presence of geometrically-necessary dislocations (GNDs), which are the same things as the misfit dislocations of van der Merwe and Matthews. This extra dislocation population, over and above the statistically stored dislocations normally responsible for Taylor or forest strain hardening, evidently increases the strength when small dimensions increase the strain gradient and hence the GND density.
Ashby had proposed GNDs as explaining the Hall–Petch effect, the idea being that crystal anisotropy makes it impossible for a polycrystalline metal to have simultaneously a uniform stress field and a uniform strain field. Compatibility requires both to be nonuniform—to have gradients—both in the elastic regime, where the relevant anisotropy is that of the elastic stiffness tensor, and in the plastic regime where it is the anisotropy of the Schmid factor that comes into play. In this field, it was merely one of the several theories explaining the Hall–Petch effect—Eshelby’s pile-up, Reference van der Merwe23 James Li’s emission of dislocations from grain boundaries, Reference Li34 and Conrad’s slip distance theory Reference Conrad35 being some other key theories. But the extension to micromechanical testing aroused great interest, as well as efforts to give mechanistic explanations of what, in the hands of Ashby, Fleck, and Evans and coworkers, and of other theoreticians such as Aifantis, Reference Zhang and Aifantis36 was a rather formal theory. One such mechanistic theory was the theory of Bill Nix and Huajian Gao for nanoindentation. Reference Nix and Gao37 Nevertheless, Evans and Hutchinson Reference Evans and Hutchinson38 were obliged to note that strain-gradient theories “have not been comprehensively embraced for several reasons. Most importantly, the ambiguities surrounding the length parameters that emerge upon fitting predictions from different theories to measurements are a source of confusion.” That is, the issue is the phenomenological nature, particularly the need for a characteristic length for dimensional reasons but which did not seem to have any real physical interpretation.
III. CENTRAL IDEAS
In Sec. II, a number of authors and articles of seminal importance were cited. Here, we turn to the central ideas that did trace back to van der Merwe’s work—or should have.
A. Matthews critical thickness theory
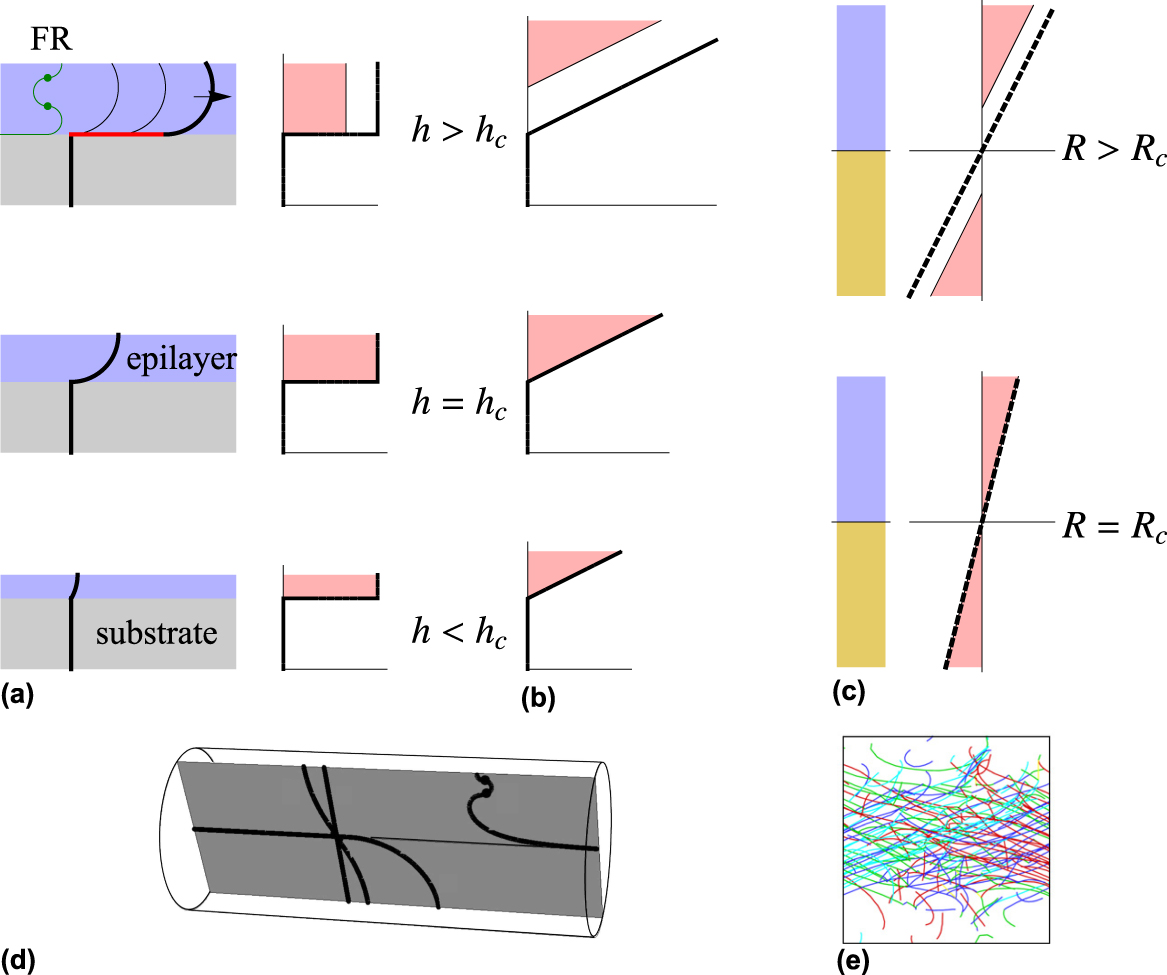
Matthews based his approach on the thermodynamic considerations of van der Merwe but also gave the equivalent force-based model. Reference Matthews and Blakeslee17 This is shown in Fig. 1(a). A pseudomorphic—strained—epitaxial overlayer is grown on a substrate with a threading dislocation. The dislocation cannot stop at the interface but must continue through the epitaxial layer to the free surface, where it must terminate at right-angles to the surface. The biaxial misfit strain ε0 pushes the threader sideways, so that it is now curved, with a radius r inversely proportional to the stress σ as noted by Orowan:
 $$r = {\Gamma \over {\sigma b}} \sim {{Gb} \over {2\sigma }} \sim {b \over {2{\varepsilon _{\rm{E}}}}}\quad ,$$
where G is the shear modulus and Γ is the line tension of the dislocation, which may be approximated by Γ = 1/2Gb 2. As the epitaxial layer increases in thickness, the curve approaches a quarter-circle [at h = h c in Fig. 1(a)], and it is when it exceeds a quarter-circle that the force on it exceeds Γ, so the quarter-circle may now glide indefinitely leaving behind a straight misfit dislocation in the substrate–epilayer interface. This constitutes plastic relaxation of the epilayer. The plastic strain, εpl, is constant through the thickness of the layer and zero in the substrate. The (infinite) plastic strain gradient at the interface necessitates the presence of the misfit dislocation, which may therefore also be termed a GND. The dimensionless stress, or elastic strain εel, is reduced, and we have ε0 = εel + εpl.
The development of the van der Merwe and Matthews theory from the simple epitaxial layer (a) to the graded layer (b), the beam or foil in bending (c, e) and the wire in torsion (d). In (a), the growth direction z is vertical and the threading dislocation is the heavy line. At h > h c successive positions are shown as glide leaves behind the misfit dislocation (red). The graphs show the strains (x-axis), misfit strain (dashed line) and the elastic strain (solid line). The strain-thickness product (equal to b for h > h c or 5b for h > h R) is the pink shaded area. In (b) the corresponding graphs are shown for graded layer growth. In (c) a beam in bending is shown, with opposite strains above and below the neutral plane, at the critical bend radius and above. In (d) the Matthews theory is shown for a wire in torsion, with a transverse edge dislocation able to lay down an axial screw dislocation at sufficient torsional strain (reproduced from Ref. Reference Dunstan, Ehrler, Bossis, Joly, P’ng and Bushby40). The image in (e) is an end-on view of a square beam in bending in 3D DDD; the neutral plane is horizontal, halfway up the image. Dislocations are colored according to their slip systems (reproduced from Ref. Reference Motz and Dunstan44).

The Matthews equation for the critical thickness h c at which the quarter-circle is achieved is quite complicated, as the full calculation of the dislocation line tension includes a logarithmic term [as in Eq. (1)] as well as trigonometric terms from the crystallography, but for practical purposes the prediction of CTT may be approximated as
 $${h_{\rm{c}}} \sim {b \over {{\varepsilon _0}}}\quad ,$$
which may be rearranged to give a critical strain-thickness product h cε0 ∼ b. Reference Dunstan21
There are several developments of the Matthews theory that are necessary for its applications in metallurgy and micromechanics. Semiconductors generally have very low (but not normally zero) dislocation densities, typically in the range 1–106 cm−2. For reliable device operation and long lifetimes, especially under the very high current densities and electric fields that result from minaturisation, it is desirable that structures are thermodynamically stable against dislocation movement and extension. Equation (3) is appropriate for this. On the other hand, significant plastic deformation of metals or semiconductors generally leads to dislocation densities in the order of 1012 cm−2. Without generation of new dislocations, this would require preexisting dislocations (typically of lengths measured in microns) to extend to lengths of meters. Generally this is not possible, whether because of grain sizes of the order of microns, or because of dislocation–dislocation interactions as the density increases. Instead, dislocation sources are required to operate. Reference Beanland39 These are dislocation configurations, typically requiring pinning points, which, under stress, can undergo cyclical motions which throw off new dislocations. Typical sources such as the Frank–Read source or the spiral source require several quarter-circles to be fitted in an epitaxial layer [Fig. 1(a) marked FR, and Fig. 1(d) shows the corresponding FR source in a wire in torsion Reference Dunstan, Ehrler, Bossis, Joly, P’ng and Bushby40 ]. The radius of curvature is accordingly several times less, and the stress therefore is several times more, and so Eq. (3) becomes
 $${h_{\rm{R}}} \sim {{5b} \over {{\varepsilon _0}}}\quad ,$$
defining a relaxation critical thickness h R with a critical strain-thickness product h Rε0 ∼ 5b. Reference Dunstan21,Reference Beanland39
The role of the substrate and of the interface to provide a site to store the misfit dislocations now becomes unimportant. We can remove the substrate with little effect on the diagram of Fig. 1(a). This is an absolutely key point in the extension of van der Merwe’s insights to metallurgy in general—it is often considered that Matthews’ theory can have no relevance to free-standing strained specimens such as pillars in compression or wires in tension. On the contrary, while Matthews’ theory depends on the observation that plastic relaxation requires the provision of the self-energy of the misfit dislocation, following van der Merwe, it is a simple extension of the theory to see that when sources are required to operate, the required energy becomes the energy stored and then dissipated by each cycle of a source. As Fig. 1(a) demonstrates, this requires the modification of Matthews’ theory merely by the factor 5 in going from Eqs. (3) and (4). We conclude that significant plastic deformation of any small structure, whether a thin film on a substrate, or a free-standing thin wire, foil or pillar, under an elastic stress εE requires a minimum stress-thickness product, hεE ∼ 5b. This is, of course, a minimum strength—it does not preclude other effects being added to increase the strength further, e.g., a size-independent Peierls stress contribution to the yield stress or a size-dependent or size-independent strain-hardening term in the flow stress or perfection as in Brenner’s whiskers Reference Brenner28 or due to escape of dislocations through free surfaces (mechanical annealing Reference Shan, Mishra, Syed Asif, Warren and Minor41 or dislocation starvation Reference Greer and Nix42 ).
It is often thought that CTT applies only to homogenous strains, as in epitaxial layers, while many mechanical situations involve stress gradients (wire torsion, bending, indentation hardness testing, etc.). This is the other principal reason why van der Merwe’s insights have been overlooked in favor of e.g., strain-gradient theory. In fact CTT was extended to strain gradients quite early. In epitaxy, it almost as easy to grow structures with complicated misfit profiles, by varying the composition of the layer, e.g., Si x Ge1−x with x varying along the growth direction z. Linear graded layers with ε0(z) = gz were analyzed by Tersoff who found that the misfit dislocations are no longer concentrated at the substrate–layer interface. Reference Tersoff43 Instead, they are distributed uniformly throughout the thickness of a fully relaxed material, in which the strain is εP(z) = gz, εE(z) = 0, and the misfit dislocations are explicitly the GNDs required by this plastic strain gradient. Near the surface, on the other hand, there is a dislocation-free region, in which the plastic strain is constant and the elastic strain rises linearly with the gradient g. The thickness of this dislocation-free zone is such that the strain-thickness integral over it is 5b [Fig. 1(b)]. Reference Tersoff43
We see at once that the graded layer also provides the solution for a beam or foil in bending [Fig. 1(c)]. A compressive graded layer on one side of the neutral plane and a tensile graded layer on the other are equivalent to a bent beam. The graded layer also provides the physics for a wire in torsion [Fig. 1(d)] although the theory is quantitatively a little different for this geometry. Motz and Dunstan showed that a discrete dislocation dynamics simulation of a beam in bending behaved just as predicted in Fig. 1(c), quantitatively obeying CTT. Reference Motz and Dunstan44 Fig. 1(e) shows very clearly the dislocation-free zones at the top and bottom of the beam, precisely where the classical plasticity theory would put the greatest plastic deformation. Interestingly, the neutral plane or line may be considered to play the role of the substrate in Matthew’s theory. Another case where strain gradients are important is indentation hardness testing. Here the size that determines the size effect is less well defined than in the previous cases, but it is clearly related to the gradient of plastic strain from the maximum under the axis of the indenter to some distance away from the axis closely related to the contact area.
B. Strain-gradient plasticity theory
SGP underlies one of the standard theories of the Hall–Petch effect (see below) and is also invoked for micromechanical experiments where strain gradients occur (indentation, foil flexure, wire torsion). In SGPs, the flow stress depends not only upon the plastic strain εP but also upon its gradient—which apparently has nothing to do with the ideas of van der Merwe. For dimensional reasons, the strain gradient has to be multiplied by a characteristic length to give a dimensionless quantity that can then be treated alike with the dimensionless εP. Strain-gradient theories have not been comprehensively embraced, both for the reasons given by Evans and Hutchinson, Reference Evans and Hutchinson38 that the values and meaning of the characteristic lengths in different theories remain ambiguous and also for reasons to do with the mechanisms. In particular, the mechanism appears to be the increased forest or Taylor hardening due to the increased dislocation density of GNDs as well statistically stored dislocations (SSDs). But gradient effects are reported in the yield points as well as in the flow stress during work hardening. At the yield point there is as yet no plastic strain gradient, no GNDs, so there should be no effect.
Yet there is a class of SGP theories with strong size effects in the yield point [Fleck and Hutchinson (FH), Reference Fleck, Muller, Ashby and Hutchinson31,Reference Fleck and Hutchinson45 Aifantis, Reference Zhang and Aifantis36,Reference Aifantis46 etc.]. In a formal way, this comes about because (in the FH theory) the dissipated energy is the integral of the stress times the plastic strain, with the upper integral limit being increased by a term in the strain gradient. However, the physical origin of this term and its associated characteristic length have been unclear. Reference Evans and Hutchinson38
Both CTT and these SGP theories describe well the situations of Fig. 1; CTT with no fitting parameters and SGPs with the characteristic length as a free fitting parameter. It is instructive to compare their solutions, indeed, to equate their solutions and solve for the characteristic length. When we do this, Reference Dunstan47,Reference Liu and Dunstan48 we find that the characteristic length, for the FH theory, is just,
 $${\ell _{{\rm{FH}}}} = {{5b} \over {c{\varepsilon _{\rm{Y}}}}}\quad ,$$
where c is a constant in the range 1–2 (depending on the shape of the strain profile). Putting in the numbers gives excellent agreement with the reported values of
 ${\ell _{{\rm{FH}}}}$
, of a few microns, obtained by directly fitting the experimental data with the SGP.
This observation permits the description of the SGPs as approximations to CTT. They are approximations in which the nonlocal nature of plasticity is replaced by a pointwise-valid constitutive equation. Then, as in CTT, the size effect is not due to the presence of the GNDs and interactions between them and other dislocations. On the contrary, the enhanced strength—the extra term in the dissipated energy—is due to the need to create the GNDs at yield, Reference Dunstan47,Reference Liu and Dunstan48 exactly as in the theory of van der Merwe and Matthews. Indeed, we can go further in this comparison. If we follow Matthew and do not consider the operation of sources, the energy is not dissipated but stored in the GND dislocation line length and the characteristic length in the SGP will be that found by equating the SGP stress prediction with the Matthews. But if we consider that the operation of sources is required, then as we have seen in the discussion of relaxation critical thickness, the bulk of the energy is dissipated in each cycle of source operation, only about one-fifth being stored in the GND line length. The stress is about five times higher and the SGP characteristic length increased accordingly. Thus the SGP is a valuable approximation both to the physics of the Matthews CTT and also to the development of CTT for source operation.
C. The principle of similitude
Kuhlmann-Wilsdorf and van der Merwe proposed the principle of similitude according to which static configurations of dislocations in a stress field would always be in equilibrium, such that if the configuration is rescaled to a larger or smaller size, the only change required is the rescaling of the stress field in proportion to the rescaled dislocation curvatures. Reference Kuhlmann-Wilsdorf and van der Merwe24 Interestingly, this is explicitly observable in three-dimensional discrete dislocation dynamics (3D DDD) simulations (but not in 2D DDD because there are no dislocation curvatures there). This principle is fully consistent with the size effect going as d −1 and may be considered to be implicit in the earlier work of van der Merwe and Matthews.
In this context, it is worth noting that 3D DDD simulations have no intrinsic length scale. The Burgers vectors of the dislocations merely determine the strength of the forces between dislocations and the forces resulting from the external stress field. The evolution of any given 3D DDD simulations, apart from numerical errors, should be identical whatever the scale of the simulation, as long as external stresses are rescaled to be proportional to 1/d and to b, where d is the size of the simulation and b is the magnitude of the specified Burgers vector. In published 3D DDD simulations in which specimens of different size are compared, this behavior is not usually observed. This is because such simulations are normally seeded or initialized with some dislocation sources, which are not themselves rescaled suitably for different d or b. Simulations can instead be seeded with some randomly-placed dislocations, which are then relaxed under no external stress or deformation. This is not commonly done because of the extra computational burden. If it were, then 3D DDD simulations of specimens of different sizes would be more often observed to obey the principle of similitude.
D. Fitting exponents and the Hall–Petch effect
With the plethora of data that rapidly followed the dramatic demonstration of Uchic et al. Reference Uchic, Dimiduk, Florando and Nix29 of very high compressive strength in micron-sized gold pillars, there was also a strong interest in finding a power-law dependence on size, i.e., a linear behavior on log–log plots of strength against size, obeying
 $$\sigma = {\sigma _0} + k{d^{ - x}}\quad ,$$
analogous to the Hall–Petch equation, and with or without a significant σ0. In the Korte and Clegg Reference Korte and Clegg30 analysis of the literature data, it appeared that for FCC metals, x ∼ 1 while for BCC metals x ∼ 1/2 and for ceramics x ∼ 0. However, we analyzed the same data, together with data from other micromechanical testing methods, and found that all the data—from FCC to ceramics—were consistent with x = 1. Reference Dunstan and Bushby49 Moreover, the value of k agreed quantitatively with Eq. (4) and with data for the relaxation of strained epitaxial InGaAs layers. This is strong evidence that CTT is responsible for the size effect observed in all these experiments. Reference Dunstan and Bushby49
Accordingly, we continued by plotting the Hall–Petch literature data on the same graphs. Remarkably, they agreed very well, despite having all been fitted by the original authors—apparently very well—with Eq. (6) with x = 1/2. In fact, this should not have been surprising. It had been pointed out as early as 1958 by Baldwin, Reference Baldwin50 who wrote, “If the experimentalist plots yield strengths against the corresponding inverses of the grain diameters and obtains a series of points falling on a straight line he becomes a partisan of Bragg’s. If he obtains a straight line by plotting yield strengths against the corresponding inverses of the square roots of the grain diameters he becomes a follower of Petch or Stroh.” His point, of course, was that one could do either and get a perfectly believable fit either way. In fact Baldwin himself plotted the literature data for copper, molybdenum, and several other metals against x = 1/3, x = 1/2 and x = 1. He observed that the straight-line fits to the x = 1/3 plots generally passed through the origin (zero intercept for σ0) and concluded on good physical grounds that this was therefore the preferred exponent. Reference Baldwin50 Few other authors made such comparisons. Aldrich and Armstrong Reference Aldrich and Armstrong51 did plot their data for silver against x = 1/3, x = 1/2, and x = 1. Without any statistical analysis, they observed that the smaller values were slightly preferable, and they rejected x = 1/3 because it gave an unphysical negative intercept for σ0. (Some other authors’ data, for iron, gold, and aluminum, do the same for x = 1/2! Reference Li, Bushby and Dunstan7 ) But we have confirmed Baldwin’s central point that simple plots of the data over the typical ranges of the grain size and with the typical scatter in the data cannot distinguish between values of x from as little as 1/4 to as much as 1. Reference Li, Bushby and Dunstan7,Reference Dunstan and Bushby52
While many theories predict x = 1/2, it is generally never clear when any particular theory may apply. Consequently, the Hall–Petch equation, Eq. (6) with x = 1/2, has been described by many authors as an empirical equation. If it is empirical, it has the status (perhaps unique) of being an empirical equation without any experimental support.
We have made two meta-analyses of much of the literature data considered to support x = 1/2, that on different grounds give strong support to the true exponent of the Hall–Petch effect being x = 1. One is a Bayesian analysis of the probability that the data is found where it is (on a log–log plot of strength against grain size) with particular attention to the minimum strength. Reference Dunstan and Bushby52 The other is a simple analysis of what factors reported by the original authors show any correlation with the values of the Hall–Petch parameter, k HP as the k in Eq. (6) with x = 1/2. Remarkably, the clearest dependence of k HP is found to be a dependence on the average of the inverse square roots of the grain sizes in each experimental dataset. Reference Li, Bushby and Dunstan53 Since the dependence of the strength on this parameter is supposed to be in the equation already, with k HP as a constant, this is a very clear indication that Eq. (6) with x = 1/2 is not the correct equation to fit the data with.
Meta-analysis and Bayesian methods and the consequent lack of attention to individual articles that appear to support one or another theory do tend to rub some referees up the wrong way. Reference Li, Bushby and Dunstan53 This is discussed in the Sec. IV.
IV. META-ANALYSIS, THE FILE-DRAWER PROBLEM AND ITS INVERSE
A well-recognised problem with meta-analysis is that only published research is available for analysis, and these are likely to be the studies with exciting positive results. An unknown number of equally relevant studies may have given only disappointing negative results, considered to be unpublishable, and filed away. This is the file-drawer problem, that their unavailability biases the result of the meta-analysis.
It is less well recognised that the same problem can affect conventional science as badly. Data or fits to data that do not correspond to the accepted wisdom may be considered to be in error by the authors and therefore are not published. Or they may have a lot of trouble getting past critical peer reviewers. Equally dangerous is the inverse problem, in which data that support accepted wisdom get an easy ride to publication. Reviewers who would give a very critical review and make stringent demands on articles that challenge accepted wisdom may be less critical of a article that supports accepted ideas. This will be especially so if the article provides improved data or supports a theoretical refinement within the existing paradigm. If the article then gets widely cited (and perhaps little read) because of the support it gives to some aspects or refinement of accepted wisdom, it becomes what has been termed, canonised. Reference Nissen, Magidson, Gross and Bergstrom54
The report by Narutani and Takamura Reference Narutani and Takamura55 is an example of a article on the Hall–Petch effect that undoubtedly satisfies all three criteria to be justly described as canonised. This afticle gives conventional Hall–Petch data from stress–strain curves of a nickel wire under tension. It also presents very high-quality electrical data, of resistivity as a function of plastic strain and grain size, data which are related to the dislocation density. The authors conclude that their data support the Ashby equation, a modification of the standard Hall–Petch equation in which at a high plastic strain, the inverse square root of the grain size becomes the simple inverse. The article has since been widely cited, and is relied on by, e.g., Brown Reference Brown56 and Argon Reference Argon57 as evidence for the Ashby equation. Many of the authors who have cited the article are impressed by the precision of the electrical measurements and by the insight these measurements give into the dislocation dynamics. A referee of Ref. Reference Li, Bushby and Dunstan7 was not impressed by our failure to consider it in detail in our meta-analysis reported there. Consequently, it is worth some attention here.
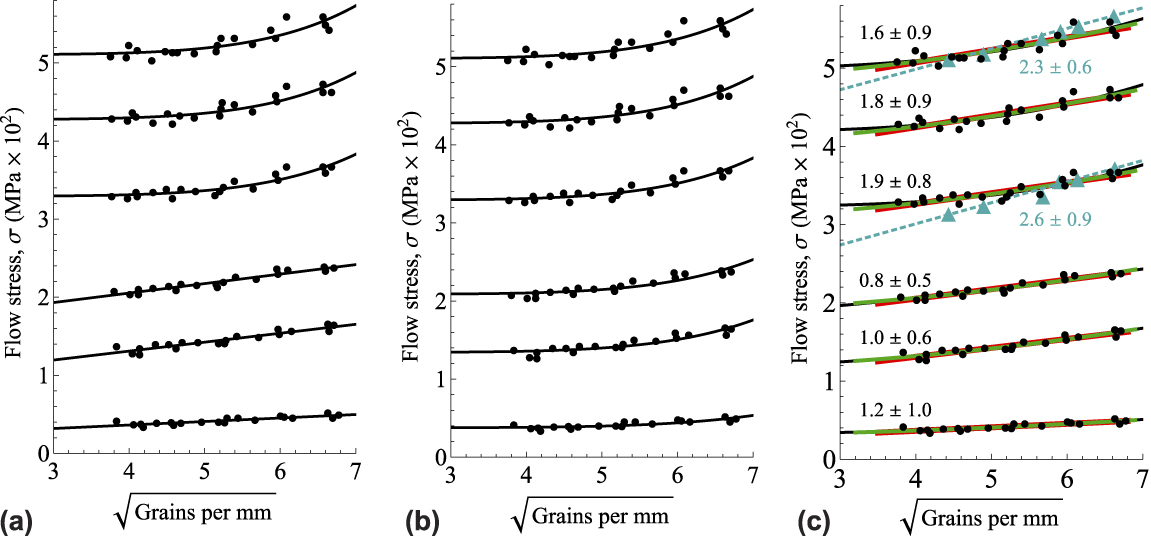
The data Narutani and Takamura give to support the Ashby equation is actually not the data from their electrical measurements but the standard stress–strain data of their Fig. 12. Reference Narutani and Takamura55 We reproduce this data in Fig. 2(a). Values of the flow stress are plotted against the inverse square root of the grain size for six values of plastic strain, from 0.2 to 20%. For the three lower strains, a linear “guide to the eye” is drawn through the data, corresponding to the accepted Hall–Petch equation. For the three higher strains, however, a concave curve is drawn, such as would be expected if the Hall–Petch exponent is increased above x = 1/2 as predicted by the Ashby equation. Narutani and Takamura Reference Narutani and Takamura55 do not give the equations or parameter values of these guides to the eye; it is sufficient for their subsequent discussion that the eye has been guided to see concavity for the three larger εpl datasets, but linearity for the three lower εpl. It is clear that if stress goes as 1/d, the function on this plot will be a parabola, y = σ0 + k(d −1/2). Reference Taylor2 To transcribe their curve onto our Fig. 2(a), however, we needed to find a function closely approximating to their guide curve, and it turned out to be y = σ0 + k(d −1/2) n with n ∼ 6. We have used n = 6 (i.e., d −3) in Fig. 2(a). That is, the authors chose not a guide to the eye reflecting the theory they propose to support but rather a guide to the eye emphasising—even exaggerating—the feature and the concavity, to which they wished the eye to be guided.
The data and fits in (a) are taken from Fig. 12 of Narutani and Takamura Reference Narutani and Takamura55 as described in the text. They show the flow stress of nickel wire at 77 K and different plastic strains from 20% (top), 15, 10, 5, 2.5, and 0.2% (bottom). The fits replicate the guides to the eye provided by the original authors and showing linearity for the lower three plastic strains and concavity for the higher three. In (b), the same data is plotted with the concave function (x = 3) fitted as a guide to the eye for all six strains. In (c), compared with the best fits with the exponent x = 1/2 (red), with x = 1 (green), and with n (equals 2x) as a free fitting parameter (black). The fitted values of x are marked. The cyan triangles show the stresses deduced from the electrical data (see text) for the 20 and 10% strain at 77 K. The dotted lines show the x = 1/2 fits to these data and the best-fit values of n are marked in cyan.
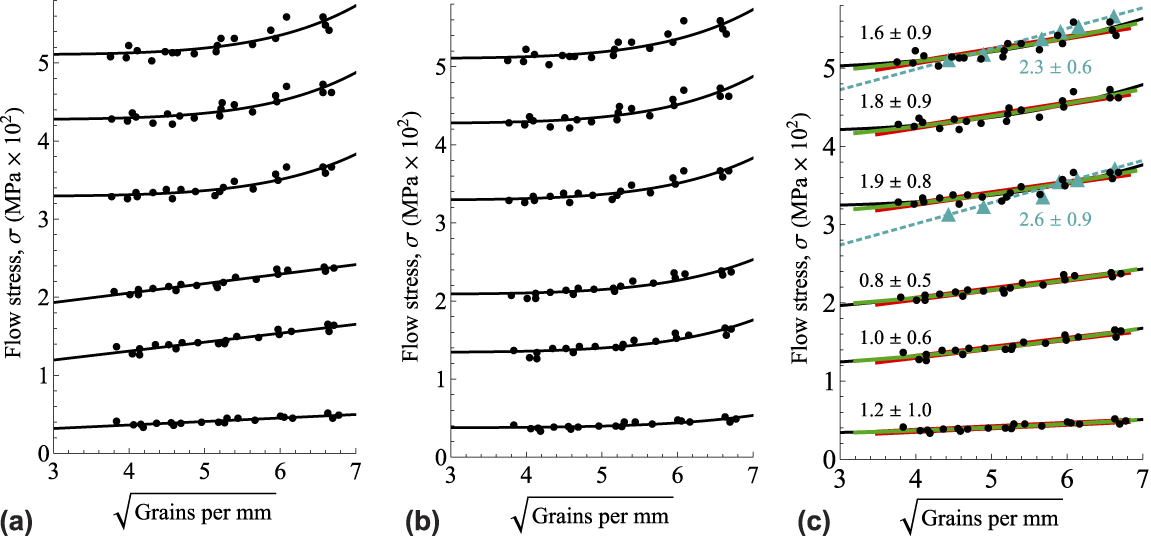
One may suspect that perhaps the same is true of the linear fits to the lower three strains. Perhaps the straight lines exaggerate the absence of concavity in these data. Indeed, that turns out to be so. In Fig. 2(b), we have used the same function, y = σ0 + kd −3 to fit the low-strain data too. The fits are not obviously worse than those of Fig. 2(a), but now the eye is drawn to the concavity also of the low-strain data.
Of course, no theory expects that the stress should go as σ0 + kd −3. Quite possibly, if the authors had written that this is what they observe, it would have attracted critical attention from reviewers. The simple claim that concavity is observed at the higher strains and not at the lower strains is in accordance with the Ashby equation, and a refinement rather than a refutation of the established paradigm, and therefore would be accepted more readily by the reviewers and the readers.
The guides to the eye are not best fits to the data. We fit the data with σ0 + k(d −1/2) n and show the results in Fig. 2(c), together with fits with x = 1/2 (linear fit on these axes) and with x = 1 (parabolic fit on these axes). The key point is that although the exponent is higher for the higher three strains and lower for the lower three strains, the error in the exponent returned by the fit is huge. Correspondingly, the fits are almost indistinguishable in the regions of the data, in accordance with Baldwin. Reference Baldwin50 Simply looking at these fits in comparison with the scatter of the data, it is clear that the data cannot determine which fit is correct.
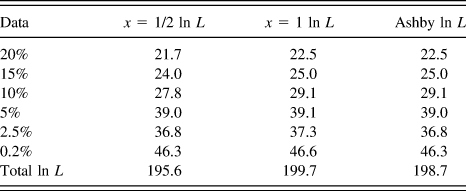
This conclusion can be quantified by comparing the likelihoods L of the data according to the three competing models. These are the products of the values of the probability density functions of the residuals of the data-points. Reference Edwards58 It is more convenient to use the log-likelihoods, ln L. These are given in Table I. We see that no individual dataset can be said to be better fitted by one exponent than by the other. The combined data mildly favor the 1/d model and the Ashby model over the traditional Hall–Petch model. There is nothing to choose between the Ashby model and the 1/d model. (It should be noted that the absolute values of ln L are of no significance. Differences in ln L between models of 2 or less are of no significance. A ln L greater by much more than 2 is sufficient to support a choice between models. Reference Edwards58 )
The log-likelihoods of the three models, the Hall–Petch equation with x = 1/2, the critical thickness equation with x = 1, and the Ashby equation, which takes the x = 1 values of ln L for the three higher strains and the x = 1/2, values for the three lower strains.

We should also consider the electrical data reported in this article. Raw data is given for deformation at 295 K (authors’ Fig. 1), plotted as the increase of resistivity against strain for several grain sizes. The data are corrected for point defect densities and replotted as increases in resistivity against 1/d for several strains at 295 K and for two strains (20 and 10%) at 77 K (authors’ Figs. 4 and 5). The 77 K data is given only in this form. A linear relationship between the flow stress and the square root of the resistivity increment is found (their Fig. 8). From this, we can evaluate the stresses corresponding to the resistivities, and in Fig. 2(c) these are plotted in the Hall–Petch form for comparison with the actual stress–strain data.
What is abundantly clear from Fig. 2 is that no reliance can be placed on any of the exponents deduced from these datasets. There is substantial disagreement between the stress–strain data and the resistivity data in Fig. 2(c). Accepting that the resistivity data are the more precise, there is no evidence whatsoever for a change of exponent from x = 1/2 at low strains to 1 at high strains. Indeed, if anything can be deduced from the data, it is that an exponent of 1 is favored over the traditional exponent of 1/2 for all strains. It is clear that the data presented in their article does not support the interpretation put on it by subsequent authors but, rather, is fully consistent with the ideas of van der Merwe and Matthews.
V. STRAIN HARDENING AND OTHER OPEN PROBLEMS
The distinction between the yield stress and the flow stress of a metal during plastic deformation has often been blurred. Indeed, Tony Evans once remarked to me that there is no such thing as a yield point; there is only the point below which plastic strain is undetectable—and that depends on the sensitivity of the strain gauge. This comment is consistent with Unwin’s remark cited earlier Reference Unwin27 and with the Ramberg–Osgood equation which is often used to describe the stress–strain relationship of metals,
 $$\varepsilon = {\sigma \over Y} + k{{{\sigma ^n}} \over {{Y^n}}}\quad ,$$
and according to which the plastic strain, the departure from elastic behavior (Hooke’s law), starts at zero stress. In this view, any stress that is called the yield stress is only the flow stress at some small plastic strain value. Possibly this view has contributed to an emphasis on explaining size effects in the flow stress and therefore ignoring the van der Merwe–Matthews approach, which is explicitly about the onset of the yield.
It is necessary to distinguish carefully what is meant by these terms, especially if as observed, by Evans and Hutchinson, Reference Evans and Hutchinson38 that one effect may affect the yield stress but not the flow stress while another effect may affect the flow stress but not the yield stress. Certainly, dislocations can move or elongate at a very low stress—such motion may be important in fatigue and creep and the Bauschinger effects. It is explicit in the Matthews model [Fig. 1(a)] below critical thickness when the threading dislocations already bow under stress. Above Matthew’s critical thickness, existing dislocations can extend indefinitely. However, if we are interested in significant plastic deformation, accompanied by a large increase in dislocation density and perhaps Taylor or forest strain hardening due to the increased dislocation density, then we are interested in the stress at which dislocation sources first become able to operate. Reference Beanland39 It may be expected that if the high-strain behavior determined by source operation follows, for example, Eq. (7), the fit to the data will have a nonzero stress intercept at zero strain, and that is what we here call the yield point. This point, in the context of the foregoing discussion, is the relaxation critical thickness or critical elastic strain, plus any additional strengthening that may act. Moreover, this point may be measurable—we have reported torsion experiments in which strains as small as 10−6 are readily measured and in which this yield point appears (subject to further analysis) to be unambiguously detectable. Reference Dunstan, Ehrler, Bossis, Joly, P’ng and Bushby40,Reference Dong, Dunstan and Bushby59
Regarding strain hardening in bulk materials, the reader is referred to Kuhlmann-Wilsdorf, who in 2009 suggested that since the collapse of pile-up as a generic model, there is now no coherent explanation of strain hardening with any predictive power (“solid state plasticity is right now without a paradigm, as pile-up theories have no adherents left”). Reference Kuhlmann-Wilsdorf13 She advocated equilibrium theories, such as Matthews, in contrast to the previous paradigm of highly nonequilibrium theories such as pile-up. Certainly, given the diversity of models in the literature that fit more or less well different datasets (e.g., Stage I, II, III, even IV and V strain hardening, square root hardening, Ramberg–Osgood hardening, etc.), there seems to be no over-arching theory that predicts which theory should fit which data. What is noteworthy here is that in micromechanical experiments, the flow stress as a function of strain seems generally simpler yet highly sensitive to the experimental configuration and the presence of free surfaces. Thus in torsion, the flow stress of thin wires appears to be close to power-law work-hardening or Eq. (7) and to increase in rate as the diameter is reduced. Reference Fleck, Muller, Ashby and Hutchinson31,Reference Dunstan, Ehrler, Bossis, Joly, P’ng and Bushby40,Reference Dong, Dunstan and Bushby59–Reference Liu, He, Dunstan, Zhang, Gan, Hu and Ding61 In the flexion of thin foils, on the other hand, linear strain work hardening is reported, with again an increase in rate as the thickness is reduced. Reference Stölken and Evans32,Reference Ehrler, Hou, Zhu, P’ng, Walker, Bushby and Dunstan62 In the Hall–Petch effect, many authors have considered that the Hall–Petch coefficient k HP increases with plastic strain, in agreement with some of the theories of the effect. For example, the data of Narutani and Takamura Reference Narutani and Takamura55 discussed in Sec. IV shows an increase in the Hall–Petch parameter k HP as strains increase to 20%. On the other hand, many other articles do not, e.g., Douthwaite for brass and steel. Reference Douthwaite63 In our metastudy of fitted values of k HP, we tested for a dependence of the values of k HP on strain. Reference Li, Bushby and Dunstan53 That was one factor that turned out to have no significant influence, within statistical errors.
At very small grain sizes, (nanocrystalline metals) the inverse Hall–Petch effect is well known. This is outside the scope of the CTT theory, as it can give strengths less than the CTT minimum strength through mechanisms such as grain-boudary sliding.
In micropillar compression, as the diameter is reduced, strain bursts become more dominant. Reference Uchic, Dimiduk, Florando and Nix29 This, in fact, should be attributed not to size but to number or perfection. The number of defects in a specimen, particularly dislocations, can approach zero by decreasing the size Reference Uchic, Dimiduk, Florando and Nix29 or increasing the perfection Reference Brenner28 or by ejecting the defects out of the free surface (mechanical annealing, Reference Shan, Mishra, Syed Asif, Warren and Minor41 or dislocation starvation Reference Greer and Nix42 ). A detailed analysis of the strength of Mo alloy pillars has been given by Bei et al. Reference Bei, Shim, Pharr and George64 when the number of dislocations is varied by various amounts of prestrain. These effects, it must be emphasised, are not effects of size but of number. Here, we should not overlook the distinction drawn by Jerome Weiss and co-workers, between ‘mild’ and ‘wild’ plasticity, where there is a clear rationale for expecting ‘wild’ plasticity in small volumes. Reference Weiss, Ben Rhouma, Richeton, Dechanel, Louchet and Truskinovsky65 Weinberger and Cai Reference Weinberger and Cai66 observe the effect of perfection very clearly in simulations (molecular dynamics and dislocation dynamics) of very thin (5–10 nm), dislocation-free wires in torsion. They see no significant departure from the elastic line until about 0.1 surface shear strain, presumably theoretical strength. Then dislocations appear, the stress drops by an order of magnitude, and the subsequent stress–strain curves, both twisting and untwisting, are wild, with no evidence of strain hardening. Clearly, this is outside the scope of van der Merwe–Matthew equilibrium theory and, along with the inverse Hall–Petch effect, is another way in which strengths less that the CTT minimum strength may occur.
Under mild plasticity conditions, whether size effects do affect or should affect rates of strain hardening has been a moot point for decades. Be that as it may, the insights of van der Merwe and Matthews can make some predictions; whether they are borne out by the experiment mostly remains to be seen. First, inspection of Fig. 1 suggests that in many cases the flow stress should be determined by the conditions for operation of dislocation sources. In the examples of Fig. 1, this generally means sources operating in the dislocation-free zone, while dislocations accumulate at the interface for simple layers, and below the dislocation-free zone for situations with a strain gradient. In these cases, one would predict no strain hardening for epilayers (apart from any accumulation of SSDs in the dislocation-free zone) but strain hardening for the beam in bending or the wire in torsion, with the flow stress requirement to make sources operate increasing inversely to the decreasing thickness of the dislocation-free zone with increasing strain. In fact, as mentioned above, what appears to be observed in the torsion or bending of soft metals (Cu, Ni) is linear strain hardening in bending Reference Stölken and Evans32,Reference Ehrler, Hou, Zhu, P’ng, Walker, Bushby and Dunstan62 contrasting with power-law hardening in torsion. Reference Fleck, Muller, Ashby and Hutchinson31,Reference Dunstan, Ehrler, Bossis, Joly, P’ng and Bushby40,Reference Dong, Dunstan and Bushby59–Reference Liu, He, Dunstan, Zhang, Gan, Hu and Ding61 In contrast, in pillars or wires under tension or compression, Taylor or forest strain hardening should occur. There is no dislocation-free zone for the sources, and it is source operation that then requires increasing stress as dislocations accumulate—whatever stress is capable of operating sources is more than sufficient to move new dislocations through the forest.
In many theories of plastic deformation, dislocations hinder the dislocation motion, and small sizes give rise to a size effect through an increased dislocation density. Brown’s slip-circle constructions for the plastic flow under an indenter are an example, Reference Brown56 and Conrad’s slip distance theory is another. Reference Uchic, Dimiduk, Florando and Nix29 Because the density of dislocations at the yield point may be approximated to zero, it might be thought that there will be no size effect in the yield point. In fact, there is a size effect in the yield point as well as in the flow stress because of the increased rate of creation of dislocations, which is nonzero at the yield point. This is the same argument as in the last paragraph of Sec. III.B for a yield point effect in SGPs and again follows directly from the van der Merwe–Matthews approach.
Another open question is the theory for mechanical properties of metal multilayers, made by, e.g., accumulative roll-bonding or other methods. We established that semiconductor superlattices with alternating strains showed enhanced mechanical properties consistent with the critical thickness theory. Reference Brenchley, Hopkinson, Kelly, Kidd and Dunstan67 However, that is a long way from understanding superlattices in which the layers are distinguished, for example, by the grain size. Reference Kümmel, Kreuz, Hausöl, Höppel and Göken68 According to CTT, much of the interest may be expected at superlattice periods of the order of one micron, with size-effect strengths from Eq. (4) of the order of dimensionless yield stresses of 10−3.
Ductility, of course, is what is generally lost when yield or flow strengths are increased Reference Ritchie69 ; it is an open question whether CTT could contribute toward achieving high ductility at a high strength. High strength at high temperatures is another such unsolved problem. Because temperature does not enter into the van der Merwe theory, it offers a possible solution. Indeed, strained layers of InGaAs have been shown to support more than 10−2 dimensionless stress at temperatures of 1000 °C (well over 80% of their melting point), for times limited only by the solid-state interdiffusion of the structures. Reference Gillin, Dunstan, Homewood, Howard and Sealy70
VI. CONCLUSIONS
The aim of this article is to demonstrate that the theory initiated by van der Merwe in his Ph.D. at Bristol nearly seventy years ago, that has had massive impact in the field of semiconductors, should have had (but has not had) a similar impact throughout materials science and metallurgy whenever plasticity is mediated by dislocations.
The logical sequence of ideas that appear to this author to flow ineluctably from Frank and van der Merwe’s 1949 article is as follows:
-
(1) The limit of the thermodynamic equilibrium stability of a fully strained misfitting epitaxial monolayer defines a critical strain.
-
(2) Extending this idea to thicker layers is completely rigorous.
-
(3) The Matthews model of the turned-over threader illuminates without changing the van der Merwe insight.
-
(4) The extension of the Matthews model to dislocation source operation fully explains the size effect in the yield point and the flow stress during subsequent plastic deformation, providing that strain hardening is not an issue.
-
(5) These points (CTT) account for the size effect in dislocation-mediated plasticity, predicting a minimum strength as a function of size.
-
(6) Strain-gradient plasticity theories account very satisfactorily for the same data as does CTT; it follows that they must be expressing the same physics behind their formalism—and indeed that turns out to be the case.
As discussed above, there are effects to be considered as well as these points—the effect of number—of perfection, the effect of small grain size, etc. However, I hope to have shown here that the ideas flowing from van der Merwe’s work do lead to a coherent view of such diverse phenomena as the Hall–Petch effect, the compressive strength of small pillars, and strain-gradient effects in the flexion of thin foils and the torsion of thin wires.
ACKNOWLEDGMENTS
I am indebted to too many collaborators, co-authors and colleagues to acknowledge them all by name, but particular mention must be made of Andy Bushby and the late Tony Kelly, responsible for shifting my interest from semiconductors to include metals, and of Ron Armstrong, Mick Brown, Bill Nix, and the late Tony Evans, whose friendly interest and knowledge of the field has been indispensable whether or not they agree with my conclusions.