1 Introduction
Jets and long-lived eddies are prominent features of planetary oceans and atmospheres, and their existence is linked to the tendency of geophysical flows to concentrate potential vorticity (PV) gradients in narrow bands, or fronts, around regions of well-mixed PV (McIntyre Reference McIntyre1982; Dritschel & McIntyre Reference Dritschel and McIntyre2008; Dunkerton & Scott Reference Dunkerton and Scott2008; Dritschel & Scott Reference Dritschel and Scott2011; Scott & Dritschel Reference Scott, Dritschel, Galperin and Read2018). In this paper we study how the interlinked dynamics of PV fronts and inhomogeneous mixing shape the late-time scaling behaviour of freely evolving turbulence in a rapidly rotating shallow fluid layer with a deformable free surface. The system is alternately known as equivalent barotropic or quasi-geostrophic shallow water flow, and is governed by the Charney–Hasegawa–Mima equation (Pedlosky Reference Pedlosky1987)
 $$\begin{eqnarray}\frac{\unicode[STIX]{x2202}q}{\unicode[STIX]{x2202}t}+\text{J}(\unicode[STIX]{x1D713},q)=0,\end{eqnarray}$$
which describes material advection of PV
 $q=(\unicode[STIX]{x0394}-\unicode[STIX]{x1D706}^{2})\unicode[STIX]{x1D713}$
, where
 $\unicode[STIX]{x0394}$
is the two-dimensional (2D) Laplacian,
 $\unicode[STIX]{x1D713}$
is the streamfunction,
 $\unicode[STIX]{x0394}\unicode[STIX]{x1D713}$
is the vorticity, and
 $\text{J}(\cdot ,\cdot )$
is the 2D Jacobian. The deformation wavenumber
 $\unicode[STIX]{x1D706}=L_{D}^{-1}$
is the inverse of the Rossby deformation length
 $L_{D}=\sqrt{gH}/f$
, where
 $g$
is the gravitational acceleration,
 $H$
is the mean layer depth, and
 $f$
is the Coriolis parameter;
 $L_{D}$
measures the relative tendencies of gravity to relax the free surface and of background planetary rotation to maintain free surface height anomalies. Equation (1.1) also governs quasi-2D fluctuations of the electrostatic potential
 $\unicode[STIX]{x1D713}$
for a plasma in a uniform strong magnetic field, where
 $\unicode[STIX]{x1D706}^{-1}$
is the ion Larmor radius (Hasegawa & Mima Reference Hasegawa and Mima1978).
The inviscid quadratic invariants of (1.1) are the total energy
 $$\begin{eqnarray}E\equiv {\textstyle \frac{1}{2}}\langle -\unicode[STIX]{x1D713}q\rangle ={\textstyle \frac{1}{2}}[\langle |\unicode[STIX]{x1D735}\unicode[STIX]{x1D713}|^{2}\rangle +\unicode[STIX]{x1D706}^{2}\langle \unicode[STIX]{x1D713}^{2}\rangle ],\end{eqnarray}$$
where
 $K\equiv \langle |\unicode[STIX]{x1D735}\unicode[STIX]{x1D713}|^{2}\rangle /2$
is the kinetic energy and
 $P\equiv \unicode[STIX]{x1D706}^{2}\langle \unicode[STIX]{x1D713}^{2}\rangle /2$
is the potential energy, and the potential enstrophy
 $$\begin{eqnarray}Q\equiv {\textstyle \frac{1}{2}}\langle \unicode[STIX]{x0394}\unicode[STIX]{x1D713}q\rangle ={\textstyle \frac{1}{2}}[\langle |\unicode[STIX]{x0394}\unicode[STIX]{x1D713}|^{2}\rangle +\unicode[STIX]{x1D706}^{2}\langle |\unicode[STIX]{x1D735}\unicode[STIX]{x1D713}|^{2}\rangle ],\end{eqnarray}$$
which is the sum of the barotropic enstrophy
 $Z\equiv \langle |\unicode[STIX]{x0394}\unicode[STIX]{x1D713}|^{2}\rangle /2$
and the rescaled kinetic energy
 $\unicode[STIX]{x1D706}^{2}K\equiv \unicode[STIX]{x1D706}^{2}\langle |\unicode[STIX]{x1D735}\unicode[STIX]{x1D713}|^{2}\rangle /2$
. Here the angle brackets
 $\langle \cdot \rangle$
denote an average over the domain. The inviscid dynamics also conserve an infinite hierarchy of PV norms, including the
 $L^{2}$
norm
 $C\equiv \langle q^{2}\rangle /2$
.
The dynamics of (1.1) have been extensively studied in both the limits
 $L\ll L_{D}$
and
 $L\gg L_{D}$
, where
 $L$
is the characteristic length scale of the flow. In the first limit,
 $\unicode[STIX]{x1D706}L\ll 1$
, deformations of the free surface are negligible and the turbulence is effectively governed by the 2D Euler equation for material advection of vorticity
 $\unicode[STIX]{x0394}\unicode[STIX]{x1D713}$
. In this case the quadratic invariants are kinetic energy
 $K$
, which undergoes an inverse cascade, and enstrophy
 $Z$
, which cascades to small scales.
Conversely, when
 $\unicode[STIX]{x1D706}L\gg 1$
and the characteristic length scale of the flow is much larger than
 $L_{D}$
, the streamfunction dominates the PV and the turbulent evolution slows down (Larichev & McWilliams Reference Larichev and McWilliams1991; Iwayama, Shepherd & Watanabe Reference Iwayama, Shepherd and Watanabe2002). The limit
 $\unicode[STIX]{x1D706}L\rightarrow \infty$
yields the asymptotic model (AM),
 $$\begin{eqnarray}\frac{\unicode[STIX]{x2202}\unicode[STIX]{x1D713}}{\unicode[STIX]{x2202}\unicode[STIX]{x1D70F}}+\text{J}(\unicode[STIX]{x0394}\unicode[STIX]{x1D713},\unicode[STIX]{x1D713})=0,\end{eqnarray}$$
which describes material advection of the streamfunction
 $\unicode[STIX]{x1D713}$
by the vorticity
 $\unicode[STIX]{x0394}\unicode[STIX]{x1D713}$
on a rescaled slow time
 $\unicode[STIX]{x1D70F}=t/\unicode[STIX]{x1D706}^{2}$
(Larichev & McWilliams Reference Larichev and McWilliams1991). The quadratic invariants in this regime are the kinetic energy
 $K$
and the rescaled potential energy
 $P/\unicode[STIX]{x1D706}^{2}$
, which are expected to undergo forward and inverse cascades, respectively. As
 $\unicode[STIX]{x1D706}L\rightarrow \infty$
the slow time
 $\unicode[STIX]{x1D70F}\rightarrow 0$
, consistent with the frozen vortical quasi-crystals observed in simulations of smooth PV fields with length scale
 $L\gg L_{D}$
(Larichev & McWilliams Reference Larichev and McWilliams1991; Boffetta, De Lillo & Musacchio Reference Boffetta, De Lillo and Musacchio2002; Iwayama et al.
Reference Iwayama, Shepherd and Watanabe2002), and with the analytical results of Tran & Dritschel (Reference Tran and Dritschel2006), which indicate that smooth vortices much larger than
 $L_{D}$
are inactive, prevented from merging, and thus from transferring potential energy to larger scales. The AM regime may not be self-consistent, however, since forward cascades of kinetic energy may generate flow features with scales
 $O(L_{D})$
(Larichev & McWilliams Reference Larichev and McWilliams1991).
Large-scale geophysical flows generically form steep PV gradients, or fronts, separating regions in which PV is well-mixed (McIntyre Reference McIntyre1982; Dritschel & McIntyre Reference Dritschel and McIntyre2008; Dunkerton & Scott Reference Dunkerton and Scott2008; Dritschel & Scott Reference Dritschel and Scott2011; Scott & Dritschel Reference Scott, Dritschel, Galperin and Read2018), so theories for perfectly smooth PV distributions are of limited relevance to the dynamics observed in real oceanic and atmospheric flows. For equivalent barotropic turbulence in particular, the above numerical and analytical results pertaining to smooth PV distributions cannot be generalised to flows containing steep gradients, even if
 $L\gg L_{D}$
and the flow is dominated by potential energy. With these observations in mind, this paper presents a combined numerical and analytical study of freely evolving equivalent barotropic turbulence in a flow regime dominated by potential energy, but with small length scales
 $O(L_{D})$
present in the form of PV fronts. The flow is initialised with a PV field whose length scale is
 $O(L_{D})$
, so we are not addressing the self-consistency of the AM regime, which requires
 $L\gg L_{D}$
initially, but rather studying the effect PV fronts have on the evolution of an otherwise large-scale flow. We focus in particular on how these fronts facilitate the inverse transfer of potential energy and decay of kinetic energy, inhibiting the formation of a vortical quasi-crystal.
In the flow studied here the longest fronts form the outer boundaries of large vortices inside of which PV is well-mixed and arranged in a staircase structure, with each step bounded by a shorter subsidiary front. As a consequence of the inversion relationship providing
 $\unicode[STIX]{x1D713}$
from
 $q$
, the flow’s kinetic energy is strongly concentrated in thin jets collocated with the fronts. These jets support long waves having fast time scales not present in flows with smooth PV fields, and play a crucial role in facilitating collisions and mergers between the vortices, resulting in an inverse cascade of potential energy to large scales. Mergers also create small disturbances on the jets, which subsequently shed kinetic energy and smooth out. We assume self-similar growth in time, i.e. dynamic scaling, and use the dispersion relation for long frontal waves (Nycander, Dritschel & Sutyrin Reference Nycander, Dritschel and Sutyrin1993) to successfully predict the kinetic energy decay rate and the growth rate of the staircase vortices, which are the potential-energy-containing structures in the flow.
The paper proceeds as follows. In § 2 we describe our numerical method and set the context for our study by characterising the flow regime. Section 3 describes the flow evolution and the scaling theory linking the long frontal wave frequency to the observed decay rates. In § 4 we discuss our findings and outlook for future research.
2 Model set-up
2.1 Numerical method and flow initialisation
We solve (1.1) using contour advection performed by the combined Lagrangian advection method (Dritschel & Fontane Reference Dritschel and Fontane2010) on a
 $1024^{2}$
basic inversion grid with effective resolution
 $(16\cdot 1024)^{2}=16\,384^{2}$
and 80 contour levels used to represent PV. The domain side length is
 $2\unicode[STIX]{x03C0}$
and the deformation wavenumber is set to
 $\unicode[STIX]{x1D706}=40$
, corresponding to
 $L_{D}=1/40$
, or
 $65/16\,384$
th the domain width. Contour surgery removes PV filaments at
 $1/16\,384$
th the domain width, but preserves sharp gradients indefinitely, so is ideally suited to investigating dynamics associated with PV fronts.
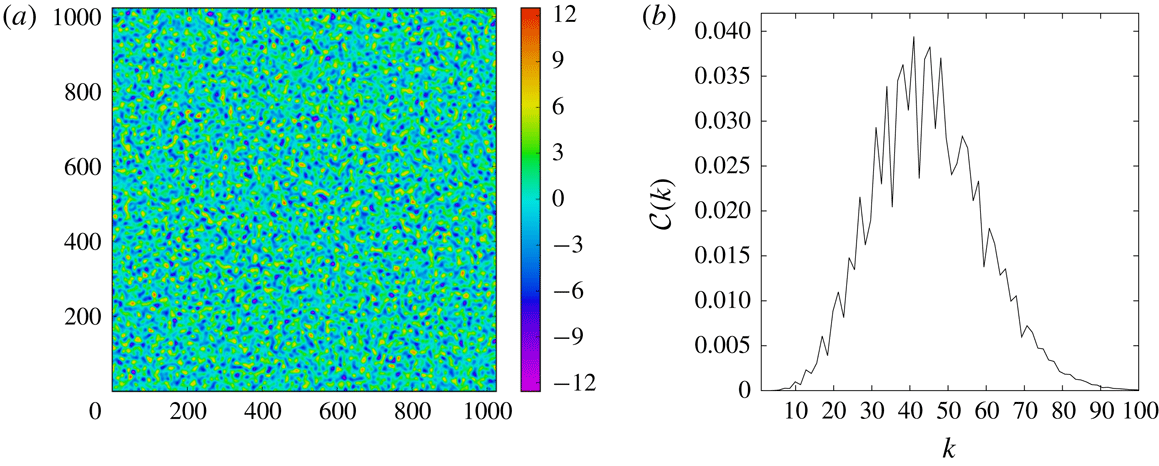
We initialise the simulation with the spatially random smooth PV field pictured in figure 1(a). Concentrations of PV are present in this initial field: positive maxima are red and negative minima are blue. These concentrations merge and evolve into small vortices, much as coherent vortices evolve from extrema of the initial vorticity field in freely evolving barotropic turbulence (see Burgess, Dritschel & Scott Reference Burgess, Dritschel and Scott2017, and references therein).
(a) Initial PV field and (b) spectrum
 ${\mathcal{C}}(k)$
as defined in (2.1).

We denote the power spectrum of
 $C\equiv \langle q^{2}\rangle /2$
as
 ${\mathcal{C}}(k)$
. The initial spectrum, shown in figure 1(b), takes the form
 $$\begin{eqnarray}{\mathcal{C}}(k)=c(k_{d}^{2}+k^{2})k^{2p-3}\text{e}^{-(p-1)(k/k_{0})^{2}},\end{eqnarray}$$
where we choose
 $p=3$
and
 $k_{0}=40$
, so that the initial spectrum is peaked at
 $k_{0}=\unicode[STIX]{x1D706}$
, and the characteristic length scale of the initial PV field is the deformation length
 $L_{D}=1/40$
. The constant
 $c$
is chosen so that
 $|q|_{max}=4\unicode[STIX]{x03C0}$
, giving a unit rotation period for a circular vortex of size
 $L\ll L_{D}$
. Note that while this is the relevant time scale for vortices much smaller than
 $L_{D}$
, it is not the relevant time scale for flow features much larger than
 $L_{D}$
, such as the large mixed PV patches and bounding jets we study below. The simulation was carried out until
 $t=640\,000$
, though PV gradient sharpening and the emergence of fronts occurs relatively early, by
 $t\sim 10\,000$
.
2.2 Flow regime
Figure 2 shows how the quadratic invariants energy
 $E=K+P$
and potential enstrophy
 $Q=Z+\unicode[STIX]{x1D706}^{2}K$
are each partitioned between their two terms. In panel (a) are plotted the potential enstrophy
 $Q$
(dash-dot line), which decays in time, and the energy
 $E$
(solid line), which is conserved. As shown in panel (b), at
 $t=100$
,
 $K/P\approx 0.3$
and decreases steadily thereafter (solid line), while
 $P/E$
approaches 1 at late times (dash-dot line), showing the dominance of the potential energy in the flow. Panel (c) shows that the rescaled kinetic energy
 $\unicode[STIX]{x1D706}^{2}K$
makes the dominant contribution to the potential enstrophy, with
 $\unicode[STIX]{x1D706}^{2}K/Q\approx 0.75$
at late times (dash-dot line). The ratio between the two terms
 $Z$
and
 $\unicode[STIX]{x1D706}^{2}K$
in the potential enstrophy
 $Q$
show no systematic growth or decay, with
 $Z/\unicode[STIX]{x1D706}^{2}K\approx 0.3$
at late times (solid line) – this is because the two terms decay roughly the same way, as will be discussed below.
(a) Potential enstrophy
 $Q$
and energy
 $E$
as functions of
 $t$
, (b) ratios
 $P/E$
of potential to total energy and
 $K/P$
of kinetic to potential energy, and (c) ratios
 $\unicode[STIX]{x1D706}^{2}K/Q$
of rescaled kinetic energy to potential enstrophy and
 $Z/\unicode[STIX]{x1D706}^{2}K$
of enstrophy to rescaled kinetic energy.

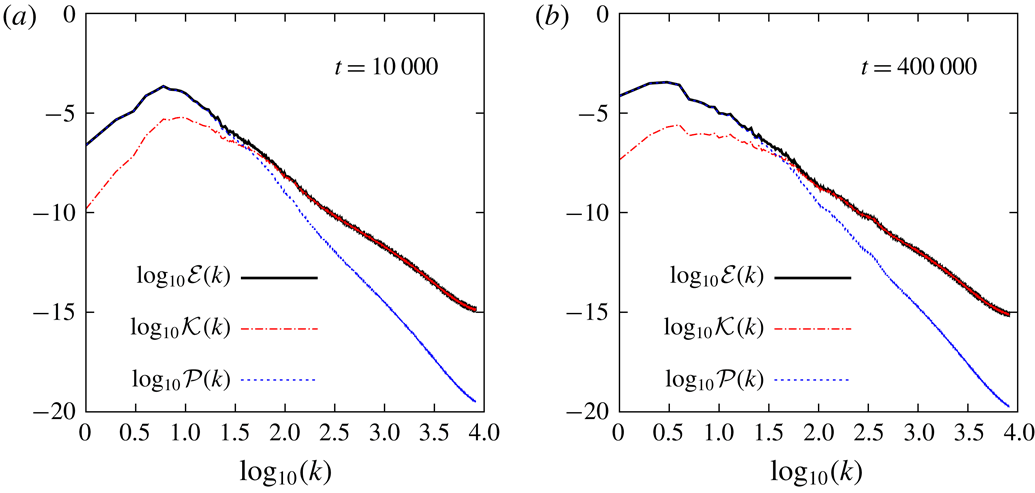
The spectra of total, kinetic, and potential energy are, respectively,
 $$\begin{eqnarray}{\mathcal{E}}(k)=\frac{{\mathcal{C}}(k)}{k^{2}+\unicode[STIX]{x1D706}^{2}},\quad {\mathcal{K}}(k)=\frac{k^{2}{\mathcal{C}}(k)}{(k^{2}+\unicode[STIX]{x1D706}^{2})^{2}},\quad {\mathcal{P}}(k)=\frac{\unicode[STIX]{x1D706}^{2}{\mathcal{C}}(k)}{(k^{2}+\unicode[STIX]{x1D706}^{2})^{2}},\end{eqnarray}$$
and are shown in figure 3 at (a)
 $t=10\,000$
and (b)
 $t=400\,000$
. For
 $k>\unicode[STIX]{x1D706}$
,
 ${\mathcal{E}}(k)\approx {\mathcal{K}}(k)$
, while for
 $k<\unicode[STIX]{x1D706}$
,
 ${\mathcal{E}}(k)\approx {\mathcal{P}}(k)$
. The large-scale flow is thus strongly dominated by potential energy. As can be seen by comparing panels (a) and (b), the peak of the potential energy spectrum moves to larger scales as time proceeds, indicating an inverse cascade of potential energy. Meanwhile the kinetic energy is depleted at scales
 $L>L_{D}$
, evident from comparing
 $\log _{10}[{\mathcal{K}}(k)]$
(red dash-dot curve) at large scales in panels (a) and (b). Hence, though the flow is in the potential energy regime it remains dynamically active, with an ongoing inverse cascade of potential energy and dissipation of kinetic energy.
Spectra
 ${\mathcal{E}}(k)$
,
 ${\mathcal{K}}(k)$
, and
 ${\mathcal{P}}(k)$
at (a)
 $t=10\,000$
and (b)
 $t=400\,000$
.

3 Flow evolution
3.1 Emergence of PV jumps and mixed regions
As early as
 $t=10\,000$
the PV field begins to develop sharp jumps, which emerge along with regions in which PV is nearly homogenised, while the length scale of the flow increases. Figure 4 shows the PV field at three times in panels (a–c), with the corresponding kinetic energy fields directly below in panels (d–f). The times are equally spaced in
 $t^{1/3}$
for reasons that will become clear below. As is evident, the spatially random initial PV field evolves into a collection of vortices, the largest having a wedding cake structure, with layers formed by plateaus of mixed PV whose value increases in a step-like fashion towards the central core. This structure is consistent with that observed in previous simulations of freely evolving equivalent barotropic flow (Arbic & Flierl Reference Arbic and Flierl2003). The well-mixed regions are visible in figure 4(a–c) as green and yellow (positive) and light-dark blue (negative) patches around the more intense vortex cores. The sharp PV jumps bounding the plateaus of the staircase vortices are collocated with strong jets, visible as cyan and dark blue ‘ropes’ in figure 4(d–f), which become more well defined as time proceeds.
(a–c) PV fields and (d–f) corresponding kinetic energy density fields. (a) PV field at
 $t=27\,000$
, (b) PV field at
 $t=125\,000$
, (c) PV field at
 $t=343\,000$
, (d) KE field at
 $t=27\,000$
, (e) KE field at
 $t=125\,000$
, (f) KE field at
 $t=343\,000$
.

The movies in the supplementary materials, available at https://doi.org/10.1017/jfm.2019.133, show the flow in motion: Movie 1 shows the kinetic energy field, while Movie 2 shows the PV field over the same range of times. The flow actually consists of two subpopulations of vortices, which are dynamically distinct: there are large active vortices with wavy boundaries, which drift slowly, interacting with each other and occasionally colliding. During these collisions their surrounding jets split and reconnect, ejecting tendrils of kinetic energy and forming disturbances with radius of curvature
 $O(L_{D})$
, which then propagate along the jets, continuing to shed kinetic energy as they smooth out and the jets regain their integrity. There are also relatively small, circular vortices whose boundaries do not support waves, and which display AM-regime-type behaviour, sitting in one location for extended periods of time, until a large active vortex sweeps them up or propels them into another vortex. These small dynamically inactive vortices resemble a remnant of the vortical quasi-crystal observed in prior studies.
Figure 5 shows the development of the staircase structure. We plot the total area
 $A(q\geqslant q_{thr})$
of the regions on which the PV exceeds a threshold
 $q_{thr}$
at times
 $t=1000$
, 27 000, 125 000, and 664 000. The value of
 $q_{thr}$
is not fixed, but rather is varied as indicated on the horizontal axis to generate the staircase plot. By
 $t=27\,000$
(dotted blue line) a clear staircase structure has already developed, indicating the emergence of sharp fronts. There are two primary non-zero values of mixed PV for both
 $q<0$
and
 $q>0$
. A similar plot for the streamfunction (not shown) has the same primary steps, reflecting the dominance of the streamfunction in the large-scale PV distribution. The PV staircase is sharper than the
 $\unicode[STIX]{x1D713}$
staircase due to small-scale structure (the non-negligible vorticity field in the shear layers on the jet flanks) in the vicinity of the fronts and the effect of PV inversion in
 $\unicode[STIX]{x1D713}=(\unicode[STIX]{x0394}-\unicode[STIX]{x1D706}^{2})^{-1}q$
.
Area
 $A(q\geqslant q_{thr})$
on which
 $q\geqslant q_{thr}$
.

In the absence of contour surgery the
 $A(q\geqslant q_{thr})$
curve would be invariant: the emergence of the staircase depends crucially on filament shedding and coarse-graining of PV through surgery. We note that if a small viscous term were used instead of contour surgery, dissipation would occur evenly along the fronts. In contrast, surgery only occurs when there are events such as reconnections that disrupt the integrity of the jets and generate small-scale features that actually lead to filament shedding. These disruptive events and the resulting small-scale structures should be distinguished from the
 $O(L_{D})$
cross-section of the front itself, which is a long-lived coherent structure resistant to filamentation. In other words, contour surgery dissipates the correct small-scale structures, allowing us to represent destructive events while simulating the inviscid dynamics of the fronts as faithfully as possible.
In figure 6, we plot the total circulation of regions with a given value of PV. In this plot the PV intervals reflect the contour levels used, and the well-mixed regions show up as large spikes at
 $q\approx \pm 3$
and
 $q\approx \pm 5.5$
. These spikes grow in time, while the area at adjacent values of
 $q$
is depleted, reflecting the net growth of mixed regions through entrainment and mixing of surrounding PV. The spikes at
 $q\approx \pm 3$
are the largest, so these values of mixed PV, which lie in the lowest levels of the staircase vortices, i.e. the green and light blue regions in figure 4(a–c), are associated with the largest total circulation. The tertiary spikes at
 $q\approx \pm 5.5$
correspond to the second mixed levels within the vortices, i.e. the dark blue and yellow regions in figure 4(a–c).
Total circulation
 $\unicode[STIX]{x1D6E4}(q)$
of regions on which PV takes the value
 $q$
. Times
 $t=10\,000$
,
 $t=200\,000$
and
 $t=600\,000$
are indicated for reference.

3.2 Scaling theory
PV gradient sharpening, mixing, and vortex merger occur through the interaction of the wavy, undulating vortex boundaries. These interlinked dynamical processes drive the growth of the flow’s characteristic length scale and the decay of quantities supported on and in the vicinity of the PV fronts, which occurs when frontal length is lost as a result of vortex mergers. Potential enstrophy
 $Q$
, rescaled kinetic energy
 $\unicode[STIX]{x1D706}^{2}K$
, and enstrophy
 $Z$
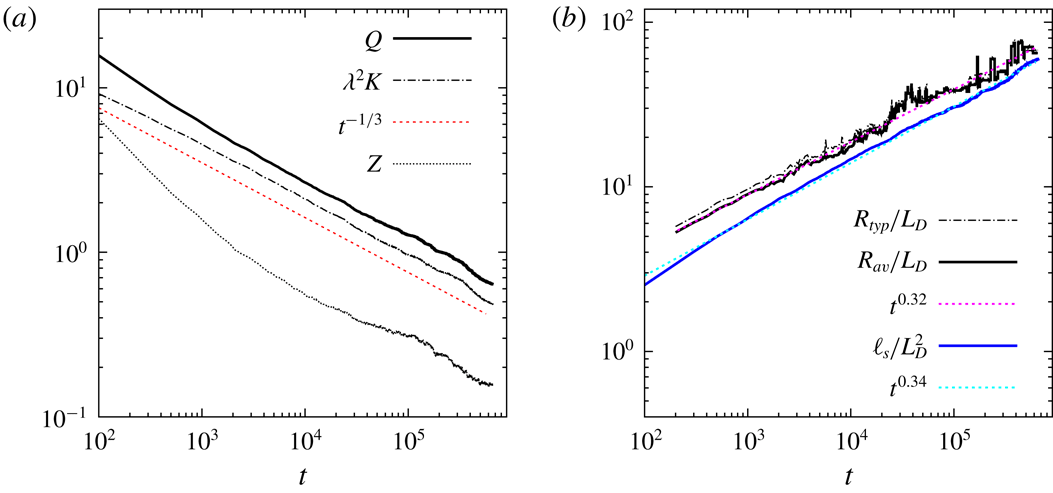
are plotted as functions of time in figure 7(a). Both
 $\unicode[STIX]{x1D706}^{2}K$
and
 $Q$
decay as
 $t^{-1/3}$
, as does
 $Z$
, though more roughly and at comparatively later times.
(a) Decays of the potential enstrophy
 $Q$
, rescaled kinetic energy
 $\unicode[STIX]{x1D706}^{2}K$
, and enstrophy
 $Z$
, with a
 $t^{-1/3}$
line for comparison, and (b) growth in time of the non-dimensionalised typical vortex radius
 $R_{typ}/L_{D}$
, average vortex radius
 $R_{av}/L_{D}$
with best-fit line
 $t^{0.32}$
, and characteristic area
 $(l_{s}/L_{D})^{2}$
with best-fit line
 $t^{0.34}$
.

We now show that the decay rates of these quantities can be deduced using a scaling argument. We consider
 $N$
vortices with characteristic radius
 $R$
supporting long frontal waves of wavelength
 $\unicode[STIX]{x1D6EC}$
on their boundaries. We identify the frequency
 $\unicode[STIX]{x1D714}$
of the long waves with an inverse time,
 $\unicode[STIX]{x1D714}\sim 1/t$
. In essence we are assuming that the long-wave period is the relevant time scale for the large-scale dynamics. We also require
 $\unicode[STIX]{x1D6EC}\sim R$
, which amounts to assuming self-similar growth in time: if the vortex radius
 $R$
is rescaled by some factor, then so is the wavelength
 $\unicode[STIX]{x1D6EC}$
of the long waves. This assumption is also consistent with previous work, which has found that both steady and unsteady evolving vortex patches exhibit boundary waves with length scales comparable to the vortex perimeter, and therefore
 $R$
(Płotka & Dritschel Reference Płotka and Dritschel2012). Using the relationship
 $\unicode[STIX]{x1D714}\sim (L_{D}/\unicode[STIX]{x1D6EC})^{3}$
for long waves in the thin-jet limit (Nycander et al.
Reference Nycander, Dritschel and Sutyrin1993) together with
 $\unicode[STIX]{x1D6EC}\sim R$
then yields
 $$\begin{eqnarray}R\sim t^{1/3}.\end{eqnarray}$$
Since PV is materially conserved, we expect the total area enclosed within the vortices to be constant,
 $NA\sim NR^{2}=\text{const.}$
; this implies
 $$\begin{eqnarray}N\sim R^{-2}\sim t^{-2/3}.\end{eqnarray}$$
Finally, the total perimeter of the vortices scales as
 $L_{F}\sim NR$
, so
 $$\begin{eqnarray}L_{F}\sim t^{-1/3}.\end{eqnarray}$$
Kinetic energy
 $K$
is concentrated in the jets, while potential enstrophy
 $Q$
and enstrophy
 $Z$
are concentrated in shear layers of width
 $O(L_{D})$
on the jet flanks, so it follows that
 $$\begin{eqnarray}K\sim t^{-1/3},\quad Q\sim t^{-1/3},\quad Z\sim t^{-1/3}.\end{eqnarray}$$
These are indeed the decay laws observed in figure 7(a).
The scaling theory also predicts in (3.1) above that the typical staircase vortex radius
 $R$
grows like
 $R\sim t^{1/3}$
and that the number of vortices decays like
 $N(t)\sim t^{-2/3}$
. To check these predictions we first identify vortices using a threshold of
 $q_{rms}$
on PV, which due to the staircase structure extracts vortices cleanly and with no ambiguity. As discussed above in § 3.1, the flow consists of two subpopulations of vortices: large drifting vortices with wavy boundaries, and small circular vortices that remain almost stationary for long periods of time and whose boundaries do not support waves. Since our theoretical considerations above apply to the active vortices with wavy boundaries, we must exclude the relatively inactive circular vortices from the average. It is easy to exclude the relatively inactive circular vortices because they are comparatively small, not having undergone as many mergers as the large vortices. Note that using a cutoff of
 $O(L_{D})$
would contaminate the scaling behaviour with
 $O(L_{D})$
effects. One would only expect structures sufficiently large compared to the characteristic scale
 $L_{D}$
to exhibit self-similarity. We thus impose a lower bound of half a typical vortex area
 $A_{typ}$
on vortices included in the average, where
 $A_{typ}$
is defined as
 $$\begin{eqnarray}A_{typ}\equiv \frac{\displaystyle \mathop{\sum }_{i=1}^{N_{\text{tot}}(t)}A_{i}^{2}q_{i}^{2}}{\displaystyle \mathop{\sum }_{i=1}^{N_{\text{tot}}(t)}A_{i}q_{i}^{2}}.\end{eqnarray}$$
Here
 $A_{i}$
is the area of vortex
 $i$
,
 $q_{i}$
is the PV averaged over vortex
 $i$
and
 $N_{\text{tot}}(t)$
is the total number of vortices, with small vortices included in this initial sum. The choice of this definition for
 $A_{typ}$
is motivated by the findings of Burgess et al. (Reference Burgess, Dritschel and Scott2017). We also tried a lower bound of half the average vortex area (where the initial average includes the small vortices): both choices of lower bound yield equivalent results. The average vortex area
 $A_{av}$
is then defined as the sum of all vortex areas having
 $A_{i}>A_{typ}$
divided by the number of such vortices.
Figure 7(b) shows
 $R_{typ}/L_{D}$
, where
 $R_{typ}=\sqrt{A_{typ}}$
, and
 $R_{av}/L_{D}$
, which grows like
 $t^{0.32}$
(dotted magenta least squares best-fit line), very close to the predicted
 $t^{1/3}$
. Moreover
 $R_{typ}$
almost coincides with
 $R_{av}$
. The difference is greatest at earlier times, and decreases as the active vortices with undulating boundaries grow ever larger and increasingly dominate both quantities. Also shown is
 $(\ell _{s}/L_{D})^{2}$
, where
 $$\begin{eqnarray}\ell _{s}=\sqrt{E/Q}\end{eqnarray}$$
is a characteristic length scale that was identified with the potential enstrophy centroid by Tran & Dritschel (Reference Tran and Dritschel2006), who assumed it to be conserved for flows with smooth PV fields. Figure 7(b) shows that when sharp gradients and small length scales are present in the PV field,
 $\ell _{s}$
is not conserved; rather
 $(\ell _{s}/L_{D})^{2}\sim t^{0.34}$
as indicated by the dotted cyan least squares best-fit line.
Figure 8 shows the number of vortices
 $N(t)$
(solid black line) with areas exceeding the cutoff area
 $A_{typ}/2$
as a function of time. At late times the curve becomes noisy because the flow is dominated by a few large vortices. As shown by the least squares best-fit line (dotted magenta) the number of vortices
 $N(t)$
decays as
 $t^{-0.64}$
, close to the predicted
 $t^{-2/3}$
.
Number of vortices
 $N(t)$
exceeding the cutoff
 $A_{typ}/2$
as a function of time, with best-fit line
 $t^{-0.64}$
.

To gain more physical insight into the area
 $\ell _{s}^{2}$
, we rewrite
 $\ell _{s}$
as
 $$\begin{eqnarray}\ell _{s}=\sqrt{\frac{\langle -\unicode[STIX]{x1D713}q\rangle }{\langle \unicode[STIX]{x0394}\unicode[STIX]{x1D713}q\rangle }}=\sqrt{\frac{\langle |\unicode[STIX]{x1D735}\unicode[STIX]{x1D713}|^{2}\rangle +\unicode[STIX]{x1D706}^{2}\langle \unicode[STIX]{x1D713}^{2}\rangle }{\langle |\unicode[STIX]{x0394}\unicode[STIX]{x1D713}|^{2}\rangle +\unicode[STIX]{x1D706}^{2}\langle |\unicode[STIX]{x1D735}\unicode[STIX]{x1D713}|^{2}\rangle }}\end{eqnarray}$$
and then make approximations appropriate to the potential-energy-dominated regime, neglecting kinetic energy in the numerator and enstrophy in the denominator, such that
 $$\begin{eqnarray}\ell _{s}\approx \sqrt{\frac{\langle \unicode[STIX]{x1D713}^{2}\rangle }{\langle |\unicode[STIX]{x1D735}\unicode[STIX]{x1D713}|^{2}\rangle }}.\end{eqnarray}$$
We again consider
 $N$
vortex patches with typical radius
 $R$
and values of mixed PV
 $q\approx \pm \unicode[STIX]{x1D706}^{2}\unicode[STIX]{x1D6F9}_{0}$
, where the vortices can be positive or negative and
 $\unicode[STIX]{x1D6F9}_{0}$
is the typical magnitude of the streamfunction on the patches. (Note that inside the vortices away from the boundaries, PV is dominated by the streamfunction,
 $q\approx -\unicode[STIX]{x1D706}^{2}\unicode[STIX]{x1D713}$
). This is actually a very good approximation, as can be seen by examining figure 6, which shows that most of the flow’s circulation is concentrated at
 $q\approx \pm 3$
. The support of the potential energy is then proportional to
 $NR^{2}$
, while that of the kinetic energy, which is concentrated in jets of width
 $L_{D}$
and typical length
 $R$
on the boundaries, is proportional to
 $NRL_{D}$
. Hence
 $$\begin{eqnarray}\ell _{s}^{2}\approx \frac{\langle \unicode[STIX]{x1D713}^{2}\rangle }{\langle |\unicode[STIX]{x1D735}\unicode[STIX]{x1D713}|^{2}\rangle }\sim \frac{NR^{2}\cdot \unicode[STIX]{x1D6F9}_{0}^{2}}{NRL_{D}\cdot L_{D}^{-2}\unicode[STIX]{x1D6F9}_{0}^{2}}=RL_{D}.\end{eqnarray}$$
This shows that
 $\ell _{s}^{2}$
is proportional to the area
 $RL_{D}$
to be consistent with equation (3.9) occupied by a typical PV front.
4 Conclusions
In this paper, we have investigated the late-time dynamics of a quasi-geostrophic shallow water turbulent flow having an initial characteristic length scale equal to the Rossby deformation length
 $L_{D}$
. As the flow evolves, vortices with a staircase structure and characteristic radius
 $R\gg L_{D}$
grow in a self-similar way through vortex mergers and filament shedding from their boundaries. These processes lead to inhomogeneous PV mixing, whereby ever sharper PV gradients develop between expanding regions of well-mixed PV, similar to what occurs in the presence of a large-scale background gradient of PV (see Scott & Dritschel Reference Scott, Dritschel, Galperin and Read2018, and references therein). These sharp gradients or fronts coincide with relatively fast currents (jets) which maintain a characteristic width of
 $O(L_{D})$
throughout the evolution, and contain nearly all of the kinetic energy.
Further, we developed a scaling theory that explains the observed decay rates of kinetic energy and potential enstrophy,
 $K,Q\sim t^{-1/3}$
, and predicts the growth rate of the typical vortex radius
 $R\sim t^{1/3}$
, which is the length scale of the potential-energy-containing flow structures. This theory assumes self-similar growth in time, i.e. dynamic scaling, and uses the known frequency of long frontal waves
 $\unicode[STIX]{x1D714}\sim (L_{D}/R)^{3}\ll 1$
(Nycander et al.
Reference Nycander, Dritschel and Sutyrin1993) together with conservation of total vortex area. Remarkably, potential enstrophy
 $Q\sim t^{-1/3}$
decays at the same rate as enstrophy
 $Z\sim t^{-1/3}$
in the very different system of freely evolving barotropic turbulence for which
 $L_{D}/R\rightarrow \infty$
(Dritschel et al.
Reference Dritschel, Scott, Macaskill, Gottwald and Tran2008; Burgess et al.
Reference Burgess, Dritschel and Scott2017). Moreover, a characteristic area
 $\ell _{s}^{2}=E/Q\sim t^{1/3}$
also grows in the same way in the two systems, though it corresponds to different physical objects: in the quasi-geostrophic shallow water system,
 $\ell _{s}^{2}$
is the region of width
 $O(L_{D})$
around a front bounding a vortex with
 $R\gg L_{D}$
; in the barotropic system,
 $\ell _{s}^{2}$
is a typical vortex area.
These results have been deduced from a high-resolution numerical simulation using contour advection, capable of preserving sharp PV gradients indefinitely. The simulation was carried out over a particularly long integration time (during which a fluid particle on a front would have travelled across the entire domain roughly 16 000 times), enabling accurate statistical estimates of temporal scaling exponents.
The present work emphasises the key role played by fronts in the evolution of quasi-geostrophic shallow water turbulence. We have focused on the case when the flow is initially characterised by a length scale of
 $O(L_{D})$
. In this case, fronts readily emerge and vortices grow in size, leading to the self-similar evolution at late times. The question remains, however – what happens when the flow starts at a scale
 $\gg L_{D}$
? Previous work suggests a frozen-in state, a ‘quasi-crystal’ (Larichev & McWilliams Reference Larichev and McWilliams1991; Boffetta et al.
Reference Boffetta, De Lillo and Musacchio2002; Iwayama et al.
Reference Iwayama, Shepherd and Watanabe2002; Tran & Dritschel Reference Tran and Dritschel2006), with no front formation. However, one cannot rule out the eventual emergence of fronts on exceedingly long time scales based on asymptotic theories or moderate-duration numerical simulations alone. This is a challenging problem, and we hope to report on our findings in the near future.
Acknowledgement
B.H.B. was supported during this work by a Leverhulme Trust Early Career Fellowship.
Supplementary movies
Supplementary movies are available at https://doi.org/10.1017/jfm.2019.133.