

Introduction
Lithium, being the lightest natural metal element, when added to aluminum as an alloying element, can reduce the density, increases the stiffness, tensile strength, elastic modulus, corrosion resistance, fatigue resistance, and ductility of the alloy. Each 1 wt% Li added to Al will reduce density by 3% and increase elastic modulus by about 6% [Reference Araullo-Peters, Gault, Geuser, Deschamps and Cairney1]. When 2 wt% Li is added, the density of alloy will decrease by 10% and the elastic modulus will increase by 25–35%. While the conventional high strength aluminum alloy is substituted for Al–Li alloy, the weight of structure reduces by 10–20% and the stiffness increases by 25–35%, which shows a drastic reduction in the cost of weight, if compared with a variety of other advanced composite materials. So, Al–Li alloy, as a new type of aluminum alloy, is one of the most ideal structural materials for aerospace vehicles in the 21st century, which can significantly improve the carrying capacity and create huge economic benefits.
First Al–Li alloy was successfully developed by German scientists in 1924 by adding a small amount of Li into Al, which unveiled that Li could improve the mechanical properties of Al [Reference Huang and Wang2]. However, it did not draw enough attention at that point. The Al–Li alloy entered a stage of development after nearly 50 years. Since the aerospace industry developed at a fairly high speed in 1970s, the development of Al–Li alloy was endorsed by the requirements for lightweight materials in aerospace industry [Reference Rioja3, Reference Wang, Shi, Jia and Zeng4]. After about 10 years, the second generation of Al–Li alloys were developed, containing about 1.9–2.7 wt% Li, more than the first generation. However, they did not get widely used in industry on account of the low toughness, the anisotropy, the poor welding performance, and etc. [Reference Zhang, Zeng, Yang, Shi and Wang5, Reference Dursun and Soutis6, Reference Heinz, Haszler, Keidel, Moldenhauer, Benedictus and Miller7]. Compared with the second generation Al–Li alloys, concentration of Cu in the third generation is increased and Li is reduced to 0.75–1.8 wt%. Some new alloy elements such as Ag, Mn, and Zn are added [Reference Giummarra, Rioja, Bray, Magnusen and Moran8]. The third generation alloys have higher toughness and strength, lower anisotropy, and perform better in corrosion resistance and welding performance. In the 2000s, a new type of aluminum–lithium alloy called 2198 Al–Li alloy was developed by American scientists. Among the third generation Al–Li alloys, 2198 Al–Li alloy shows a good combination of toughness, corrosion resistance, and ductility [Reference Ahmed and Wu9, Reference Gamboni, Moreto, Bonazzi, Ruchert and Bose Filho10].
In Al–Li alloy, metastable phases and nonequilibrium phases can both occur, but they do not necessarily coexist. The metastable phases appear in the supersaturated solid solution obtained after quenching and after aging treatment, such as δ′(Al3Li), β′(Mg2Al3), Al3Zr, θ′(Al2Cu), and other binary metastable states. Besides the fore-mentioned phases, there are equilibrium phases, including binary equilibrium phases such as δ(Al3Li), β(Mg2Al3), Al3Zr, and θ(Al2Cu), and ternary equilibrium phases such as T1(Al2CuLi), T2(Al6CuLi3), TB(Al7Cu4Li), R(Al5CuLi3), and T(Al2MgLi) [Reference Tsao, Lin and Yu11, Reference Chen and Huang12, Reference Xin-Yu, Guo, Rometsch and Wang13, Reference Decreus, Deschamps and Donnadieu14].
2198 Al–Li alloy can be hardened by aging treatment. It is acknowledged that the main reason for strengthening of the alloy is the dispersion of precipitates especially T1. The 2198 Al–Li alloy has been shown to have a desirable combination of tensile property, form ability, and damage tolerance [Reference Gamboni, Moreto, Bonazzi, Ruchert and Bose Filho10, Reference Gao, Zhu, Han and Li15]. These alloys can be produced with high yield strength, which is attributed to the precipitation of the T1(Al2LiCu) phase. This phase forms as thin plates lying on the matrix planes [Reference Shen, Oh and Lee16, Reference Pardoen, Marchal and Delannay17].
On the microstructure of precipitates during aging treatment in atomic scale, few researches were conducted making an observation of the whole process of aging treatment. Therefore, this article focuses on the evolution procedure of T1 phase by atomic-resolution high-angle annular dark field-scanning transmission electron microscopy (HAADF-STEM) imaging and geometric phase analysis (GPA), which aims to measure the displacement of the atomic position with respect to the normal lattice. Also, some new structures were found and the interactions between precipitate phases were discussed.
Discussion and results
Age-hardening curve of 2198 Al–Li alloy
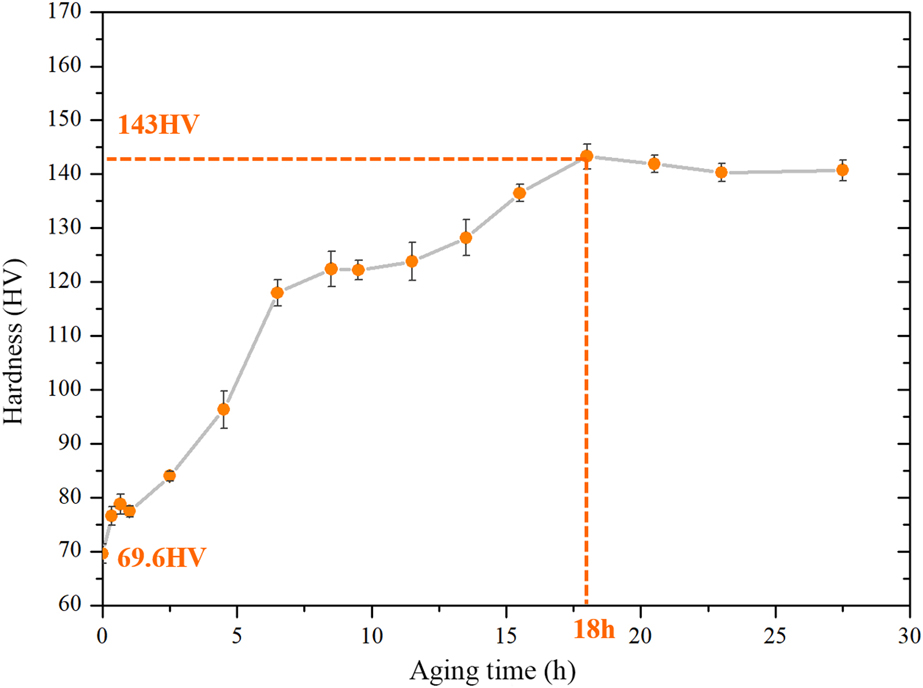
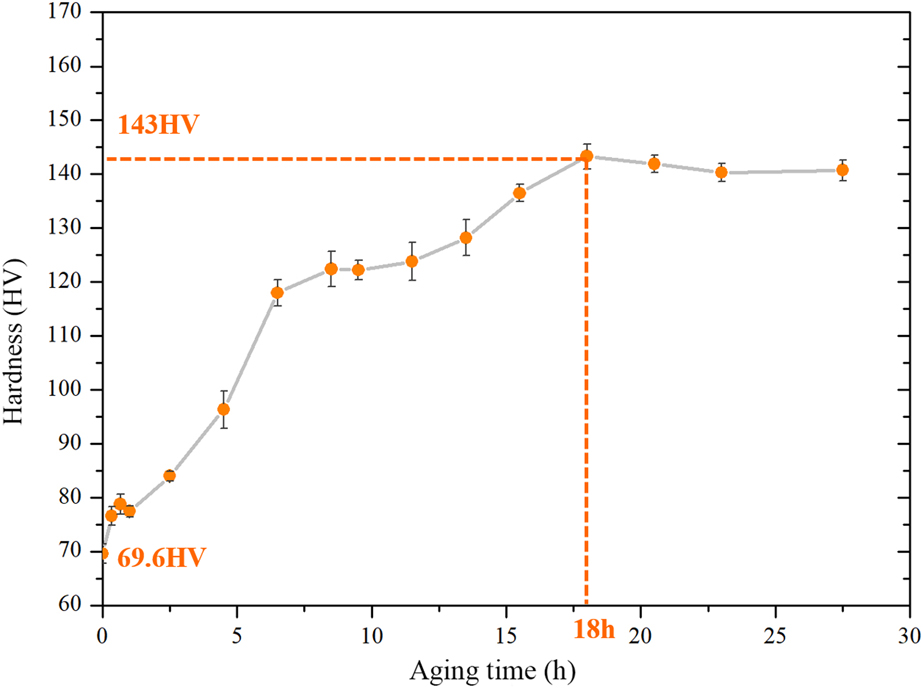
Figure 1 shows the age-hardening curve of 2198 Al–Li alloy. The hardness of 2198 Al–Li alloy aged for different lengths of time at 175 °C is shown in this curve. As can be seen, the effect of aging time on hardness of 2198 Al–Li alloy is noteworthy. Compared with the hardness before aging treatment, hardness of alloy gets significantly increased after the aging treatment that lasts for several hours, indicating a strong aging response of this alloy. It also illustrates that the hardness reaches a peak at 18-h aging, after which the hardness change tends to be gentle. So, it can be concluded that the peak aging time of 2198 Al–Li alloy is about 18 h and the corresponding peak hardness is about 143 HV when aging temperature is 175 °C.
Age-hardening curve of 2198 Al–Li alloy.
Precipitates of 2198 Al–Li alloy
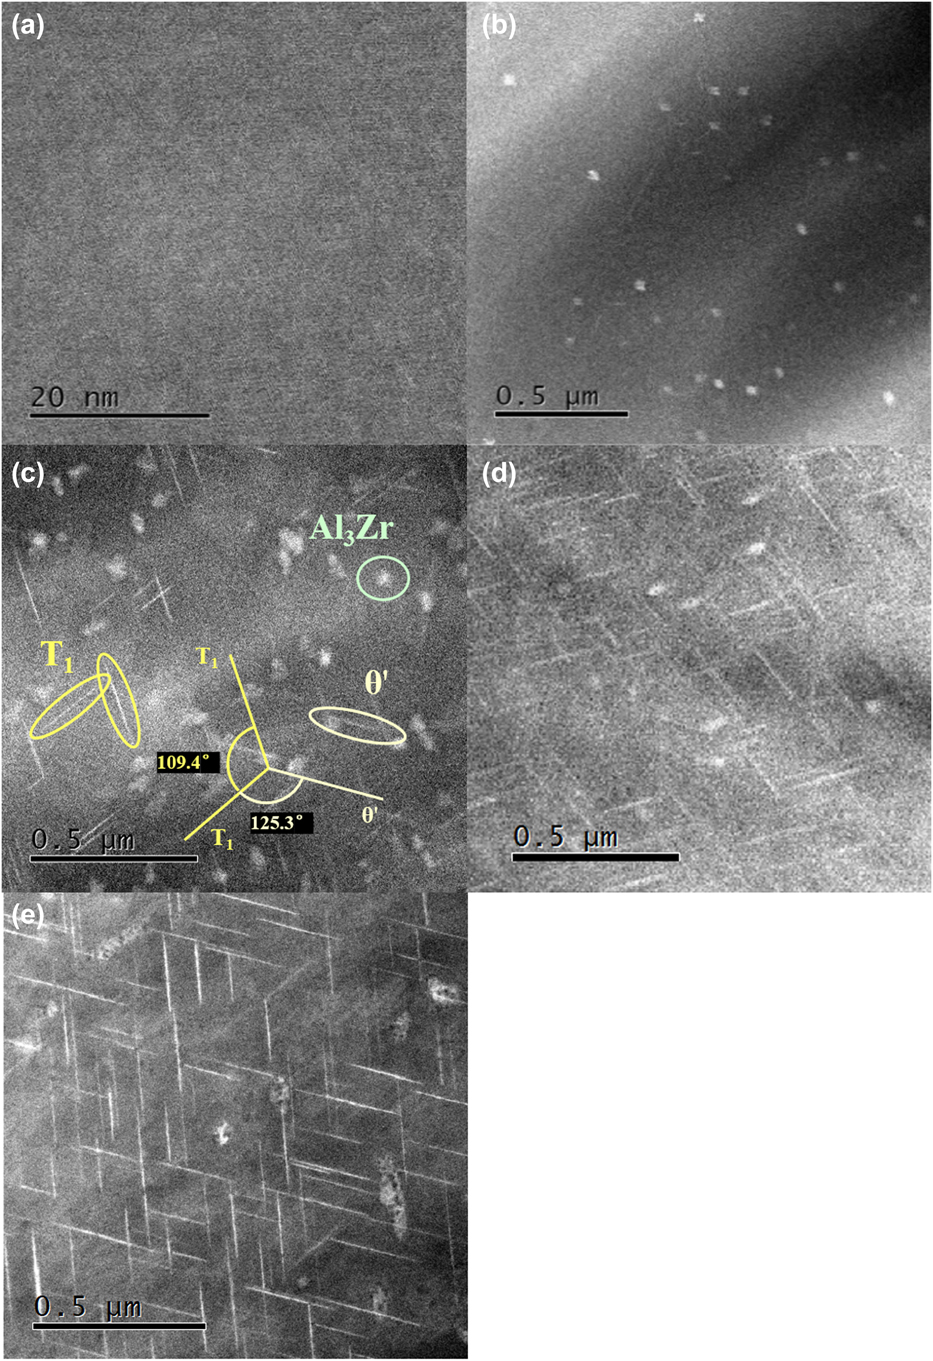
Microstructures of 2198 Al–Li alloy for different aging times were examined using HAADF-STEM and shown in Fig. 2. The precipitates showed in images are T1, Al3Zr, and θ′, which were denoted by different colors in Fig. 2(c). The θ′ has a shape like a plate lying on the (100)matrix planes and is semi-coherent with the matrix [Reference Kaufman, Morrone and Lewis18, Reference Alekseev, Lukina, Zaytsev and Fridlyander19]. Al3Zr phase is coherent with Al matrix with spherical shape, which is mainly dispersed in grain boundaries and subgrain boundaries. The crystal structure of T1 is hexagon and it has an orientation relationship of  ${\left( {0001} \right)_{{{\rm{T}}_1}}}//{\left\{ {111} \right\}_{{\rm{matrix}}}}$ and
 ${\left\langle {1010} \right\rangle _{{{\rm{T}}_{\rm{1}}}}}//{\left\langle {110} \right\rangle _{{\rm{matrix}}}}$. The orientation relationship of T1 and θ′ is shown in Fig. 2(c) [Reference Mao, Yan and Shen20].
STEM microstructures of 2198 Al–Li alloy with [110]matrix zone axis: (a) aged after 20 min; (b) aged after 2.5 h; (c) aged after 4.5 h; (d) aged after 18 h (peak aging time); (e) aged after 25 h.
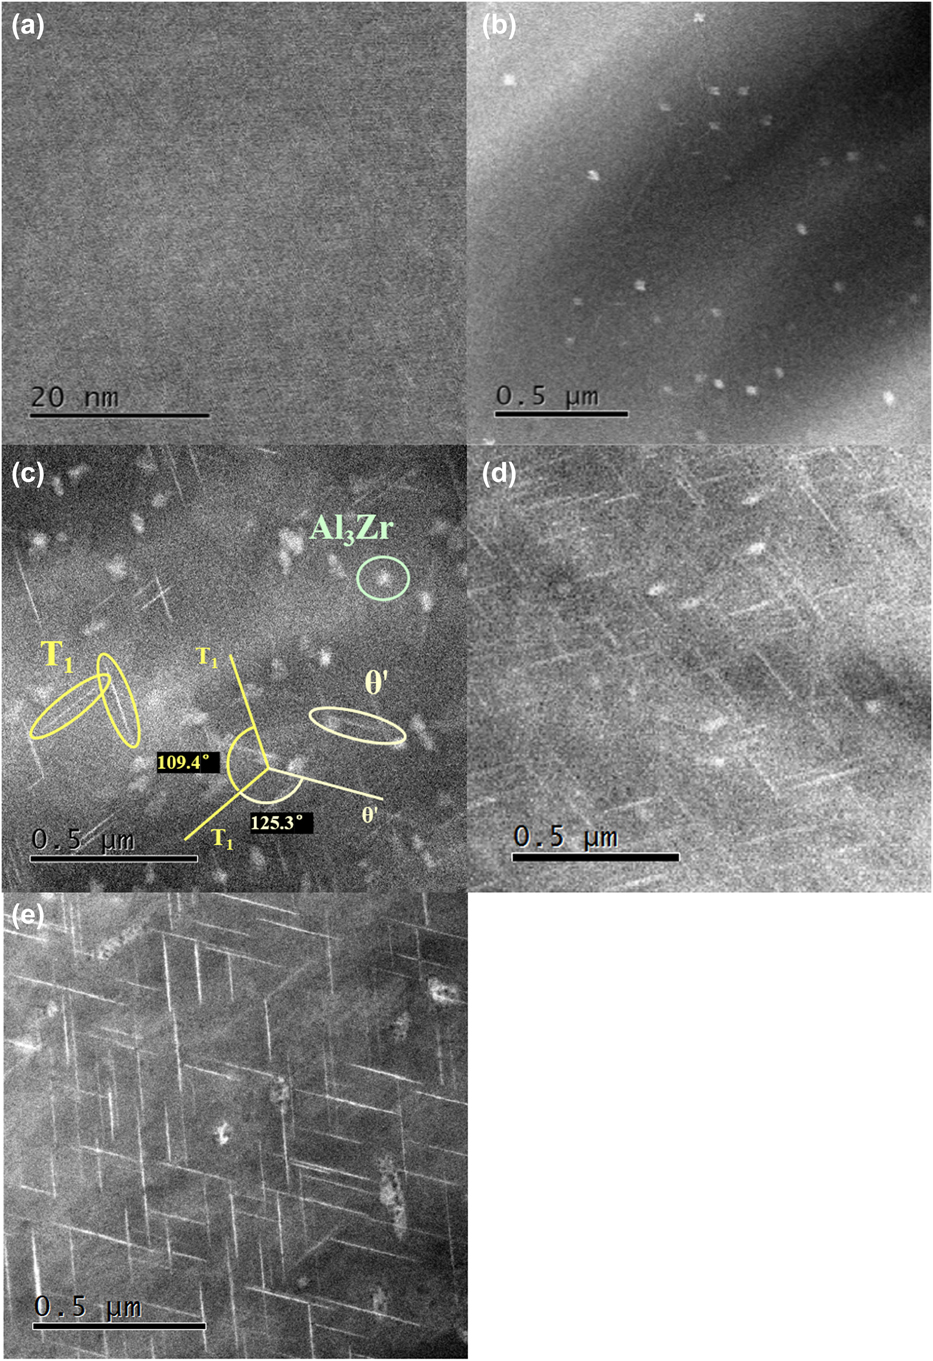
T1 phase is usually regarded as the major strengthening phase in Al–Cu–Li system. Comparing the four figures in Fig. 2, it is shown that the amount, density, and size of T1 phases will increase before 18 h, which was measured as the peak aging time at 175 °C in this experiment. While reaching the peak aging state, the size of T1 is about 200 nm. While aging time exceeds 18 h, the density and size of T1 tend to be stable. It is obvious that the increasing of precipitates contributes significantly to the strengthening of alloy, while the variation trend of the density and size of T1 coincides with the aging curve measured.
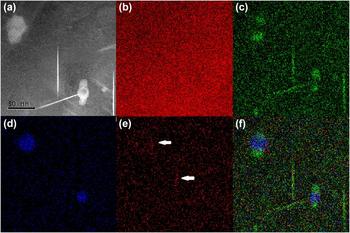
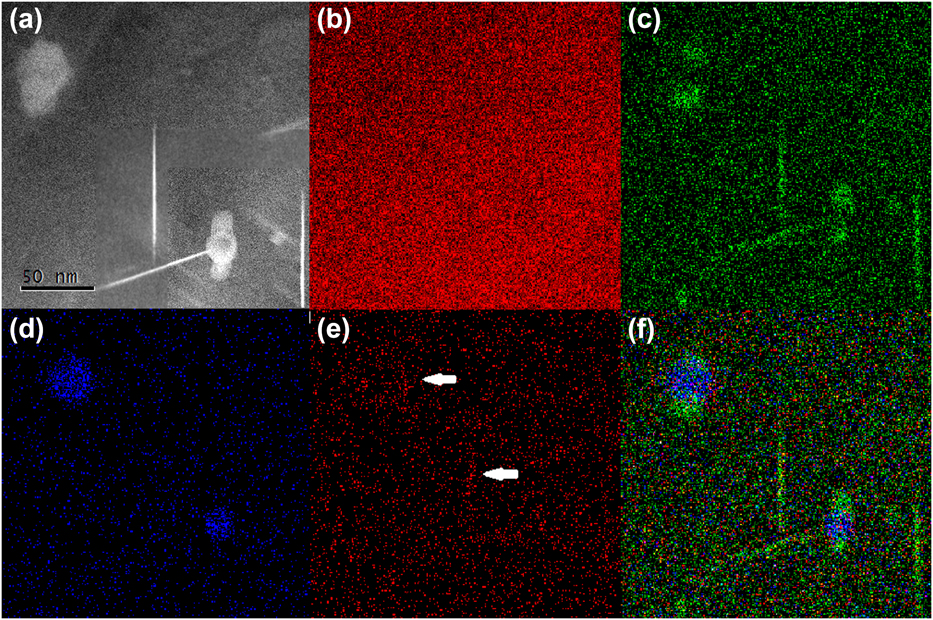
The EDS mapping analysis was performed to determine the elemental composition of analyzed phases. Figure 3 shows the HAADF images of the 2198 Al–Li alloy aged for 4.5 h and the simultaneously recorded elemental maps. As is shown in Fig. 3(a), it is apparent that the three phases can be clearly identified. Figures 3(b)–3(e) show the EDS maps of Al, Cu, Zr, and Ag, respectively. Unfortunately, the Li (Z = 3) K X-rays are of too low energy to be detected by EDS. The Al distributes evenly throughout the matrix, as is shown in the EDS maps. It was observed that Cu is presented in plate-like phase, while Zr has a relatively high content in spherical phase. It is notable that Ag appears in some phases, as is marked by arrows in Fig. 3(e).
(a) STEM microstructures of 2198 Al–Li alloy aged after 4.5 h and the corresponding EDS mapping images of the alloy: (b) Al; (c) Cu; (d) Zr; (e) Ag; and (f) overlay of images (c)–(e).
Single-lath nucleation and horizontal growing mechanism of T1
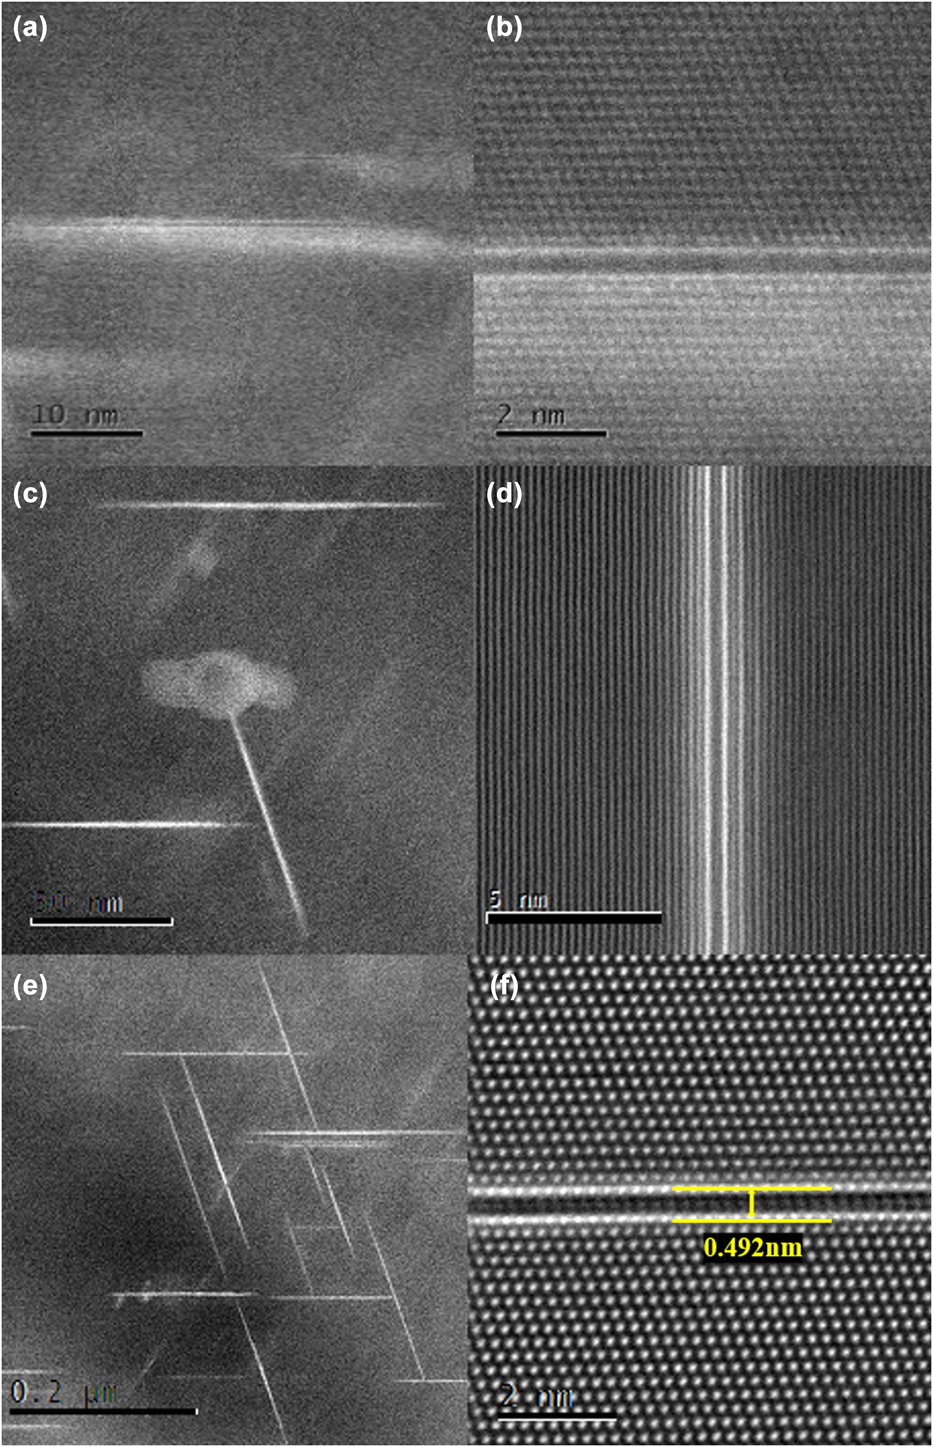
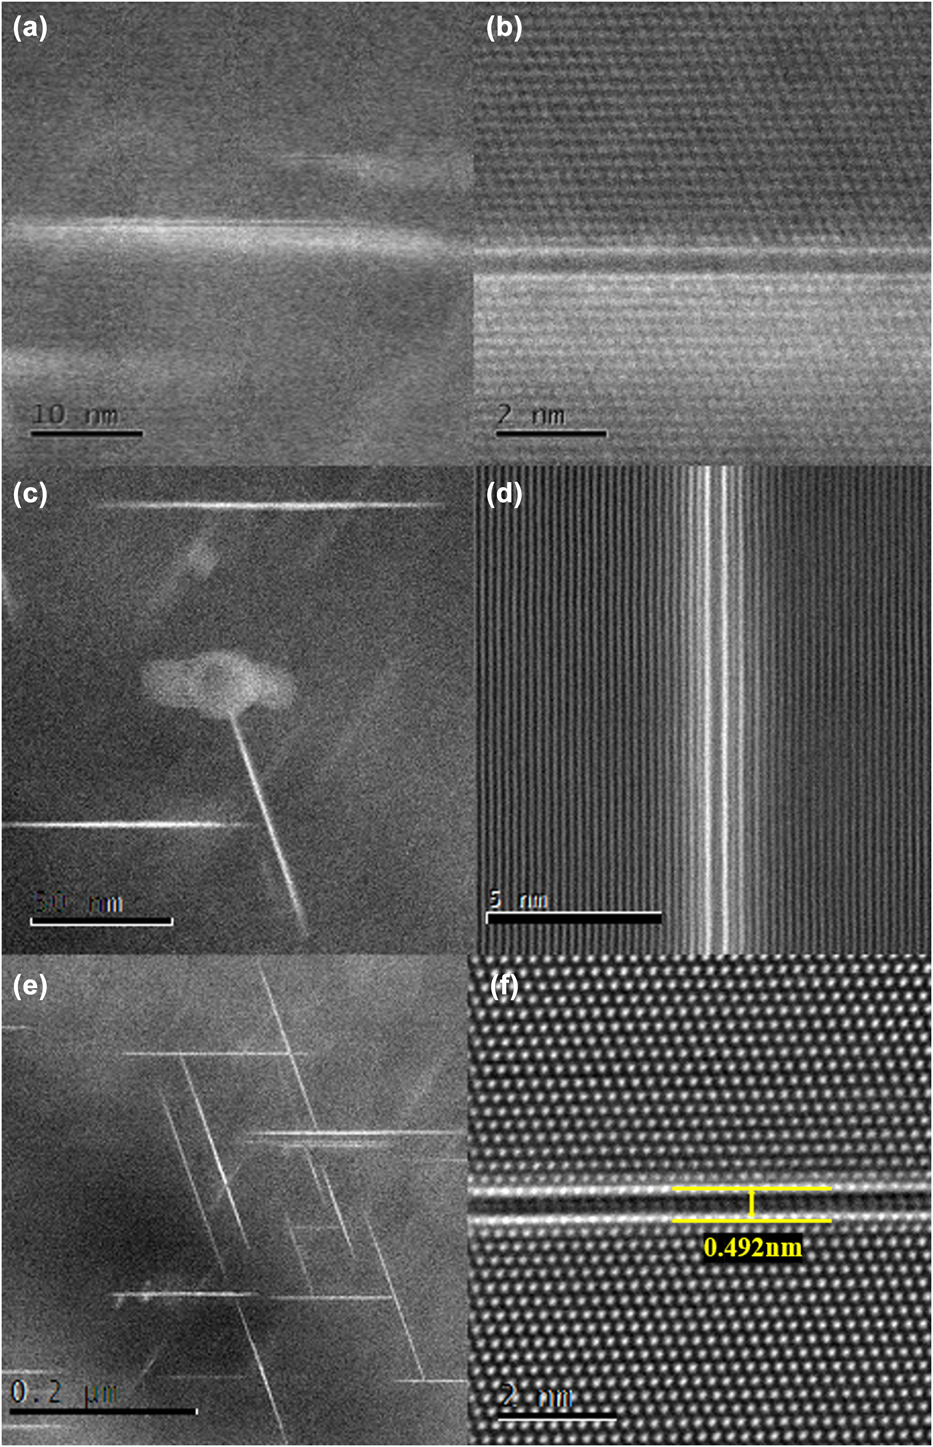
T1 is the most important precipitate that contributes to the strengthening of 2198 Al–Li alloy. While observing in atomic scale, more details were disclosed, which may not be observed at low magnification. According to previous reports, T1 phase forms as plate with extremely thin hexagonal structure [Reference Araullo-Peters, Gault, Geuser, Deschamps and Cairney1]. According to the large amount of images of T1 observed by STEM, the growing process of T1 phase can be inferred. The Z-contrast STEM image has been known to be sensitive to atomic number (Z), of which brighter spots corresponding to higher atomic number. In Fig. 4, the brightest parts are Cu-rich atomic laths and the darkest parts are Li-rich laths. While observing the both sides of a single-layered T1 phase, layers of atoms that were darker than Cu-rich laths but brighter than Al atoms can be seen. They are the transition laths between Cu-rich laths and Al matrix. It can be seen clearly that the more complete ordering of T1 phase, the less transition laths. However, the number of transition laths on the two sides of a T1 phase can be obviously different, as shown in Figs. 4(b) and 4(d). But when the aging peak achieved, most of the T1 phases have only one layer of transition beside the two sides. That means the ordering of T1 phases has been very complete, and at this extent, the diameter size of them can be about 200 nm. The situation above was seen throughout the STEM observation, so these are not isolated phenomena. Therefore, it can be deduced that the formation of T1 phase is the process of atomic ordering and the longer the aging time, the higher the degree of ordering and the larger the diameter size. Furthermore, the speed of ordering on two sides may be different. However, the vertical size of a single-layered T1 phase keeps constant (about 0.492 nm) and the change in diameter size turns out to be not obvious after peak aging time.
STEM microstructures of T1 with [110]matrix zone axis: (a) aged after 2.5 h under low magnification; (b) aged after 2.5 h under high magnification; (c) aged after 4.5 h under low magnification; (d) aged after 4.5 h under high magnification; (e) aged after 18 h under low magnification; (f) aged after 18 h under high magnification.
Multilayered structure of T1 phase
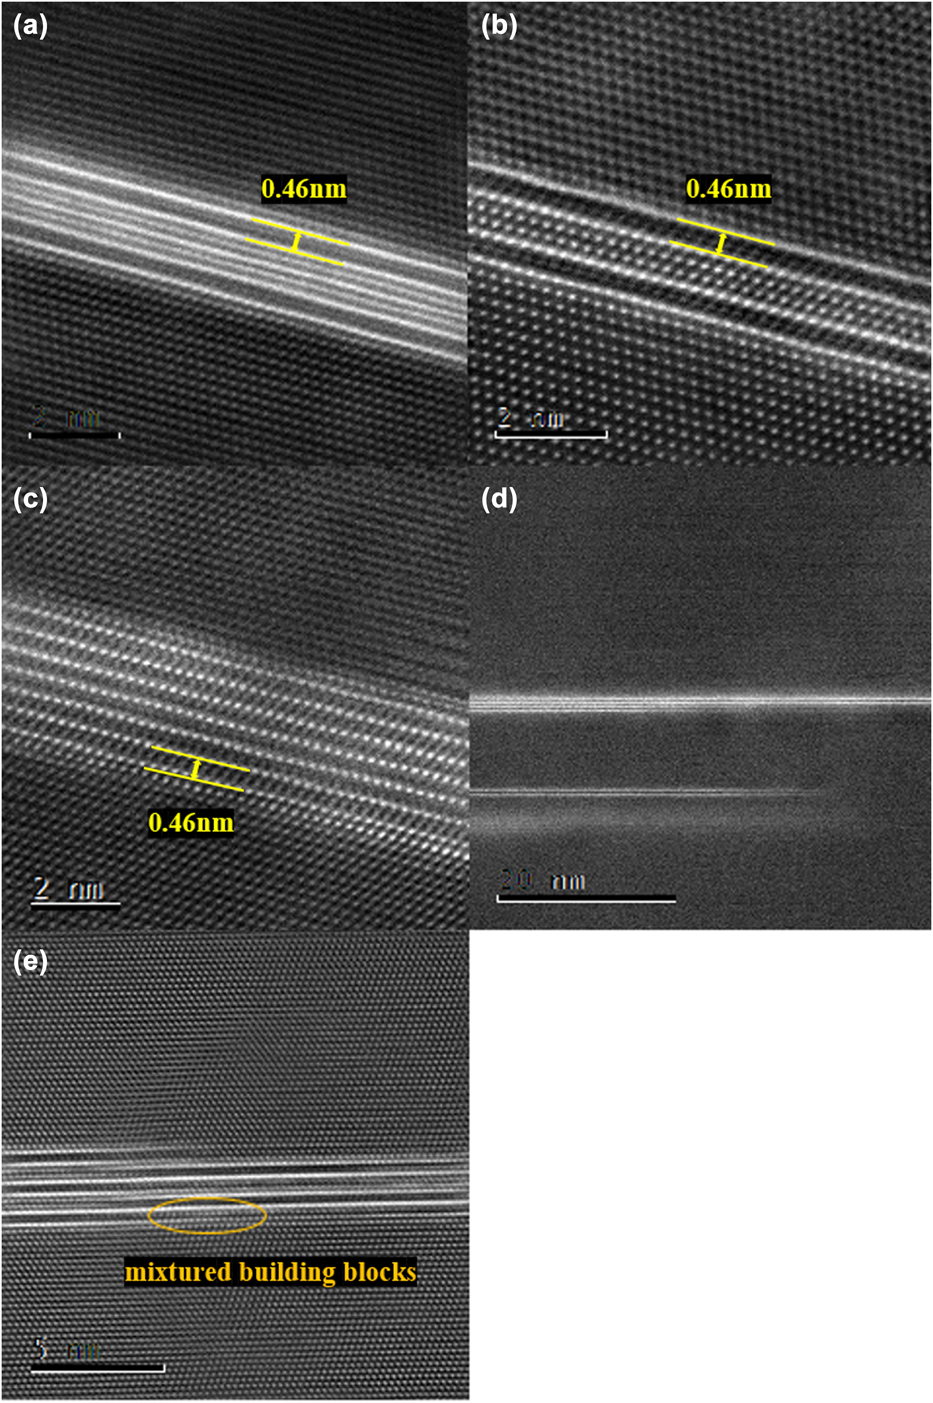
While observing Fig. 4(d) carefully, a two-layer structure can be seen vaguely, this phenomenon deserves to be focused on because it seems widely accepted that this plate-shaped T1 phase has only one layer. (Note: a layer means a typical T1 phase with two laths and a lath means one side of a T1 phase.) In order to carry out a more in-depth study on this structure, more observations were made. In this process, while observing T1 phase under very high magnification, some multilayered structure can be found at different aging times. Figure 5 exhibits this multilayered structure with more clarity than in Fig. 4. While observing the different samples at different aging times clearly, this kind of multilayered structures can be found thoroughly. Thus, it is reasonable to suppose that this is not an accidental phenomenon but can appear in the progress of aging or at peak aging time. The multilayered T1 phases have a variation of structures, which are shown in Fig. 5.
Multilayered structures of T1 phases with [110]matrix zone axis: (a) multilayered T1 phase with single copper transition lath inside; (b) multilayered T1 phase with two copper transition laths inside; (c) multilayered T1 phase with six stacking of single-layered T1 structure; (d) stair-stacking of multilayered T1 phase; (e) multilayered T1 phase with mixtured building blocks.
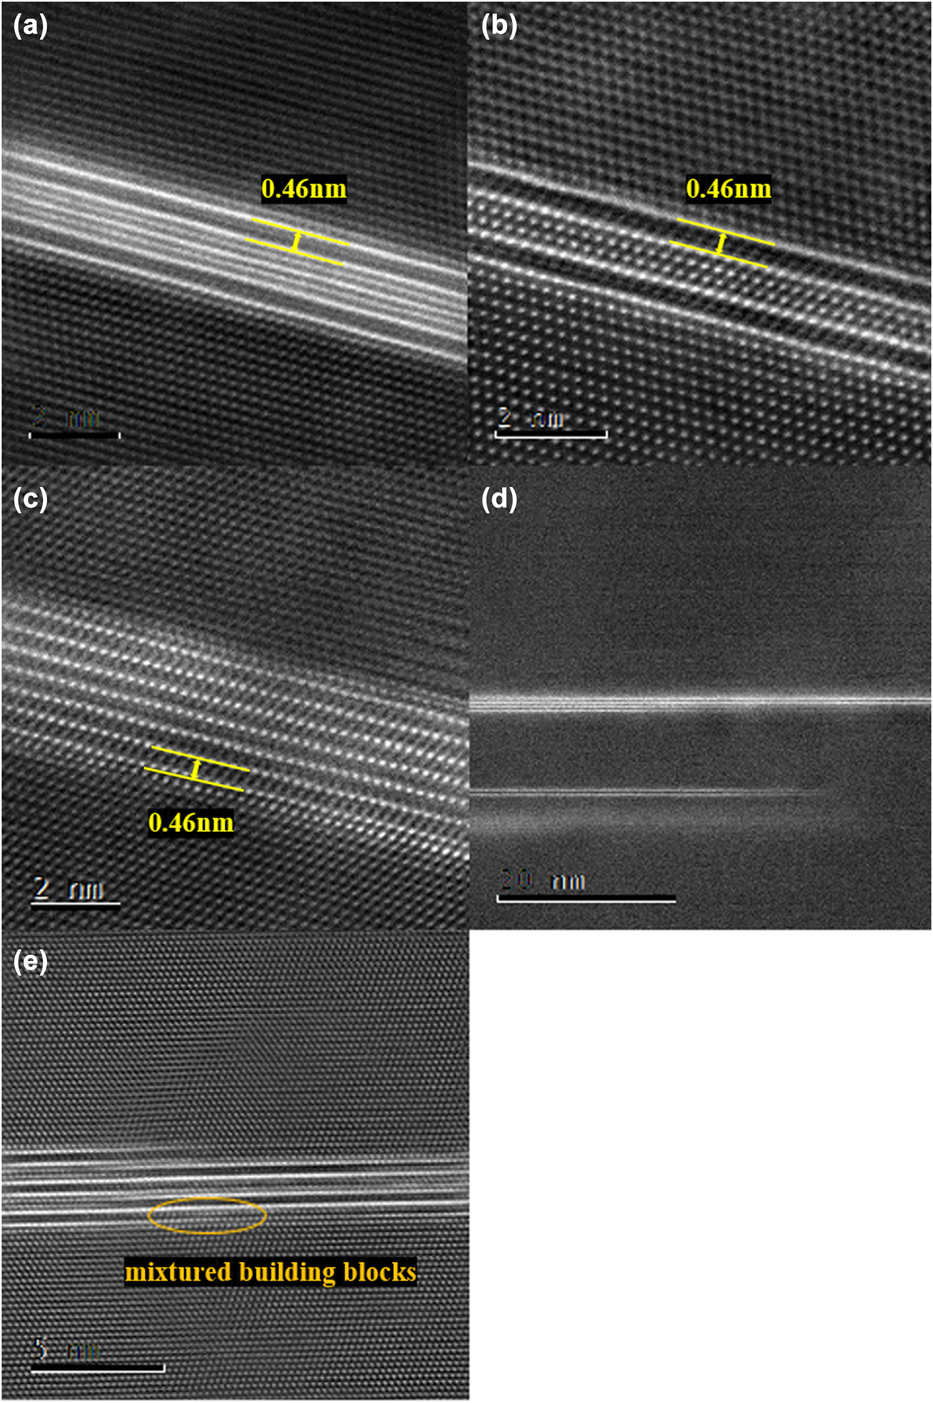
As is mentioned in the former section, there are copper–aluminum transition layers beside T1 phase and they are coherent with Al matrix. These transition laths may serve as a base of formation upon which another T1 phase grows, and therefore, some kinds of multilayered T1 phases are presented, which are shown in Figs. 5(a) and 5(b), which show one or two transition laths sandwiched between two Cu-rich laths. Throughout the whole experiment, multilayered T1 phases with three or more transition laths between two Cu-rich laths have not been found.
A single Cu-rich lath of T1 phase can also serve as a base of another T1 layer, as is shown in Figs. 5(c) and 5(d). Under such condition, there are no transition laths in a multilayered T1 phase. Within this experimental observation, the number of stacking can be up to six. The two building blocks referred above may become the mixture in one multilayered T1 phase, as is shown in Fig. 5(e). While observing images like Figs. 5(d) and 5(e) and the other similar ones, some stair-shaped structures can be found. It indicates that the multilayered T1 phases are formed lath by lath. That is, the speed of growth of different laths is different. The closer the original layer is, the more complete the laths can form. Furthermore, the fascination we found was that the distance between two adjacent copper-rich laths in multilayered T1 phase was about 0.46 nm, which was thinner than 0.492 nm. To get more proof for this finding, we have done massive measurements on the T1 phases observed and a conclusion was drawn as follows: Among the measured samples, the distance of two adjacent Cu-rich laths in single-layered T1 hovered very closely around 0.49 nm, and that in most multilayered ones was around 0.46 nm. So, it can be conjectured that the “single-layer T1 structure” in a multilayered T1 phase is different from a traditional single-layer T1 and the microstructure of T1 phase might change in the process of developing from single-layered structure to multilayered structure.
Interactions between phases
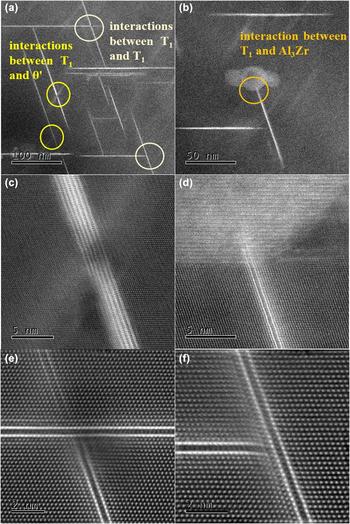
When the density and size of precipitates reach to a certain capacity, the interactions between the precipitates can be frequent. Interactions of both T1/T1 and T1/others can occur. Here are some typical examples. Figure 6(b) shows the interactions between T1 and Al3Zr and Fig. 6(c) shows the interactions between T1 and θ′. Self-interactions between T1 phases were exhibited in Figs. 6(e) and 6(f). The similarity of these interactions mentioned turns out to be that there are stress fields near the junction points. The stress field may lead to stacking faults and dislocations as a result, seen in Figs. 6(c) and 6(d). In most cases, T1 laths will cut off the growth of another T1, which is in a different orientation. The case in Fig. 6(e) is the exact representation when a T1 phase cuts off another T1 phase, instead of crossing one T1 phase. In addition to the growth of the size and density of T1 phases, these stress fields and faults will facilitate the strengthening of 2198 Al–Li alloy.
Interactions between main precipitates of 2198 Al–Li alloy at peak aging time, dark field image and HADDF images with [110]matrix zone axis: (a)–(b) low magnification showing interactions between precipitates; (c) interactions between T1 and θ′; (d) interactions between T1 and Al3Zr; (e) interactions between T1 and T1; (f) interactions between T1 and T1.

Strain field analysis
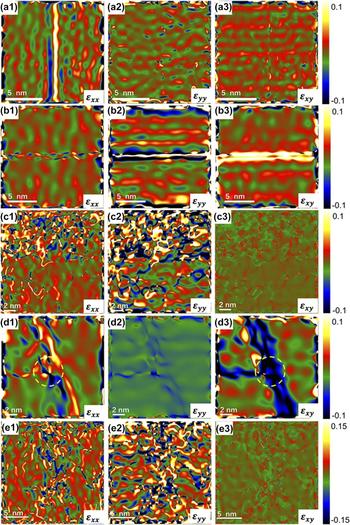
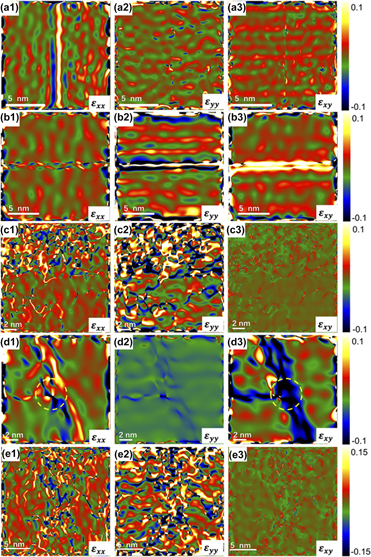
As is indicated in the previous chapters, the strengthening and hardening of Al–Li alloy is owing to the precipitates and their interactions. In the report, GPA was conducted to obtain the strain topographies of the precipitates and their interactions in Al–Li alloy. In regard of T1 phase with single-lath structure, the mappings of strain field are exhibited by Fig. 7(a). The highest strain within T1 phase was right at the lath, which is over 10% and is perpendicular to the lath surface. As for the vertical growth of the T1 phase, the strain field increases along with the thickness of the phase. The strain mappings of T1 phase with bilateral growth [Fig. 4(d)] are manifested in Fig. 7(b), in which the local maximum strain is over 40%. In terms of the interactions between T1 and other metastable phases, strain mappings for T1-Al3Zr interaction are illustrated in Fig. 7(c). Large strain field was induced into Al3Zr phase region, which might have played an important role in the hardening process. As for T1 self-interaction, the horizontal growth of one T1 phase tends to be impeded by the other one. According to the strain mappings of two T1 phase self-interactions [Fig. 7(d)], a large strain field was introduced to both the laths. In addition, the region in the yellow circle indicates that the interactions between two T1 laths may introduce large strain field into the adjacent region of the intersection. The interaction between T1 and θ′ phases introduces relatively larger strain field as Fig. 7(e) illustrate, in which the highest strain is near the intersection of the two phases. All these regions with high strain field will anchor the dislocation motion as well as slipping, which contributes to the strengthening and hardening of the material. Hence, GPA investigation further supports the precipitates and their interactions as an important factor in strengthening of 2198 Al–Li alloy.
Strain field measurement result from GPA: (a) single lath T1 from Fig. 4(d); (b) double side growing T1 from Fig. 5(d); (c) interaction between T1 phase and β′ phase from Fig. 6(d); (d) interaction between T1 phase and T1 phase from Fig. 6(f); (e) interaction between T1 phase and θ′ phase from Fig. 6(c). The suffixal numbers 1–3 for each subfigure indicate the strain along xx, yy, and xy directions, respectively.

Conclusions
Based on analysis above, the following conclusions can be made:
(1) 2198 Al–Li alloy exhibits strong aging response at 175 °C. The aging process can significantly improve the hardness of 2198 Al–Li alloy. The Vickers hardness value of the alloy increased from 39.60 HV to about 143.3 HV after aging 18 h. So, the peak aging time of 2198 Al–Li alloy is about 18 h when aging temperature is 175 °C.
(2) The reason of strengthening of this alloy is mainly the increasing of the density and size of T1. Along with the aging time, the higher the degree of ordering, the larger the diameter size of T1. The stress field, stacking faults, and dislocations are also caused by it.
(3) The formation of T1 phase is the process of atomic ordering and the ordering speed of two sides may be different. During the process of ordering, the horizontal size will continue to increase while the vertical size of single lath keeps as a constant of 0.492 nm.
(4) T1 phases may have different kinds of multilayered structures. The transition laths and copper-rich laths both can serve as a base of stacking building block in vertical direction. In most of the multilayered structures, distance between two adjacent copper-rich laths is only about 0.46 nm, which is less than that in classical single-layered phases. So, it can be deduced that the microstructure of T1 phase might change in the process of developing from single-layered structure to multilayered structure.
(5) While the density and size of precipitates reach to a content, interactions between T1 phases or T1 and other phases can both occur and there are stress fields near the junction points. GPA further testifies that growth and interactions will introduce large strain fields. These stress fields and faults will further contribute to the strengthening of 2198 Al–Li alloy.
Experimental
The material used in this study is the commercial 2198 Al–Li alloy sheets. The nominal composition of this material is given in Table I. The device for the solution treatment was a high-temperature furnace. The sample was held for 1 h at the temperature of 500 °C, followed by quenching in water. The device for the aging treatment was a constant temperature incubator and the temperature was set about 175 °C.
Chemical composition of 2198 Al–Li alloy (wt%).

In hardness testing, the loading was 5 kg, and the application time was 15 s. JEM-ARM200F(JEOL Japan Electronics Co., Ltd., Japan) with a cold field emission gun and a spherical aberration corrector was used to observe the microstructure of 2198 Al–Li alloy, of which the operating voltage was 200 kV. The HAADF-STEM images were acquired with a collection semi-angle of 68–280 mrad. Samples for STEM observation were ground to the thickness of about 40–50 μm by sandwiches of 280 #, 1000 #, and 3000 #. After grinding, the sample was punched into several wafers with a diameter of 3 mm. The small wafer samples were sprayed and punctured on a Struers TenuPol-5 automatic twin-jet electropolisher. The twin-jet electrolyte contained nitric acid (25 wt%) and methanol (75 wt%). Each time before the twin jet, liquid nitrogen was used to ensure that the double spray temperature were below −25 °C. The voltage was set between 18 and 20 V and the current was between 70 and 100 mA. Precision ion polishing system (PIPS) was used to further reduce the thickness before STEM observation.