Migration is often perceived as a challenge to welfare states. When people work and reside in different states, the national borders of the welfare state are disturbed (Ferrera Reference Ferrera2005). States have tried to manage this challenge in different ways, for instance by restricting residence rights for foreigners or limiting access to welfare benefits for those on the move. The European Union (EU) is exceptional in this regard Geddes and Hadj-Abdou Reference Geddes, Hadj-Abdou, Freeman and Mirilovic2016; Maas Reference Maas2013). Not only can EU citizens and their family members move freely and work in other member states; under certain conditions they are even entitled to the welfare benefits of the hosting state on equal terms with its native population.
Yet, this path-breaking approach has come under increasing strain. After the EU enlargements in 2004 and 2007, internal migration has increased substantially, primarily through movement from poorer to richer member states (Blauberger et al. Reference Blauberger2018; Cappelen and Peters Reference Cappelen and Peters2018). In the wake of this increase, EU free movement and cross-border welfare have become increasingly contested and politicized in the receiving states (Blauberger et al. Reference Blauberger2018; Roos Reference Roos2018; Roos and Westerveen Reference Roos and Westerveen2019). Welfare chauvinist attitudes, according to which immigrants' access to the welfare system should be restricted, inform political positions and electoral considerations within several member states (Hjorth Reference Hjorth2015; Ruhs and Palme Reference Ruhs and Palme2016; Cappelen and Peters Reference Cappelen and Peters2018), as was epitomized by the 2016 Brexit vote (Hobolt Reference Hobolt2016).
The EU legislation created to ensure social protection for those on the move was the result of delicate compromises between the member states, and is rife with potential distributive conflicts. The crux of the matter is access to national labour markets and national welfare protection. The EU legislation was designed to ensure a level playing field in relation to internal mobility, while at the same time clarifying who pays for services such as healthcare, pensions, unemployment benefits, social assistance and schools. The legislation details which of these benefits follow the beneficiary across borders (that is, through the principle of exportability), and how benefits or eligibility requirements can be aggregated between member states. The EU rules are detailed but also complex, allowing for further interpretation of key concepts and the various conditions attached to their rights.
Crucially, member states are responsible for implementing the rules and rights pertaining to social benefits for EU migrants. This decentralized implementation system offers manifold opportunities for decentral shirking and strategically reinterpreting the rules. National implementation is thus an attractive ‘safety valve’ for governments presented with increased contestation of European migrants’ access to welfare states. Indeed, a recent analysis has shown the ways in which receiving member states have tried to ‘regain control’ over access to welfare systems during implementation (Sampson Thierry Reference Sampson Thierry2019). In addition, given the contentious and incremental setting in which EU welfare regulation is developed, problems associated with interpretation are bound to materialize during national implementation processes.
How do the administrations of advanced welfare states co-operate to settle problems with national implementation and address issues that supranational compromises have left unclear? As in other domains of global governance, they resort to transgovernmental networks. An Administrative Commission for the Coordination of Social Security Systems (AC) was established in 1958 to help the European Commission implement rules and rights. The AC is an EU transgovernmental network that consists of civil servants from EU member states who are supposed to interact to share information about – and solve problems concerning – the practical application of EU regulation. The policy theory behind the AC would require learning, capacity building and the peaceful resolution of conflicts. Ideally, a fully integrated network should develop in which welfare state representatives interact and solve joint problems despite their institutional differences. This is desirable, because administrative capacities and welfare approaches differ greatly between EU member states. Capacity building and learning would require interactions between dissimilar network members in order to be effective.
The AC has good cards for organizing into a fully developed network. It is likely to develop interactions across the board, as it scores positively on a number of necessary contextual and network-level conditions for network impact, as developed in the literatures on transgovernmental networks and policy networks more generally. First, interactions within a network take time to materialize. Yet the AC is an old and established network, with an extensive history of collaboration – a key contextual requirement for network interactions (Turrini et al. Reference Turrini2010). Secondly, there is a great degree of interdependence between member states, which is a second condition for network interactions occurring (Van Boetzelaer and Princen Reference Van Boetzelaer and Princen2012). There is a high level of interdependence because intra-EU migration necessitates administrative interactions between sending and receiving states; the latter are primarily responsible for providing social security to migrants. Thirdly, the AC has a number of characteristics that are conducive to developing interactions throughout a network: it has been explicitly constituted and has formalized mechanisms of network functioning (Isett et al. Reference Isett2011). Fourthly, it has a secretariat, which ensures that the necessary resources are in place to sustain network interactions (Turrini et al. Reference Turrini2010) and makes for a more effective network than those that are shared only between the members (Provan and Kenis Reference Provan and Kenis2007). Indeed, the AC is a very active network in terms of tasks, meeting frequencies and development of competences: it takes administrative decisions, it has an audit board, and in 2004 it established a conciliation board to solve disputes between members.
In sum, based on its governance structure and background, the AC seems a highly likely case for full network interactions. Yet given the highly politicized nature of the policy area, this expectation can be questioned. This insight first flows from the work by Vantaggiato (Reference Vantaggiato2018) and Efrat and Newman (Reference Efrat and Newman2018), who argue that domestic political and institutional factors may condition the interactions within a transgovernmental network. Similarly, Beyers and Kerremans (Reference Beyers and Kerremans2004) have pointed out that political cleavages help structure interactions within networks, and Bach and Newman (Reference Bach and Newman2014) note that political factors count when explaining who interacts with whom in network governance. In addition, Ruhs and Palme (Reference Ruhs and Palme2018) argued that national institutional differences in regulating labour markets and welfare states contribute to divergent political responses to free movement and cross-border welfare. That is, political conflicts around EU free movement relate to national institutional factors, such as welfare states. Welfare institutions affect political and administrative positions on the deservingness of migrants, the appropriateness of sharing social responsibility between jurisdictions, and how reciprocity should be the guiding principle in the provision of welfare benefits for migrants (Ruhs and Palme Reference Ruhs and Palme2018). These insights inform our understanding of domestic factors, which brings national welfare institutions and political factors into focus.
This article takes these conflicting expectations on network interactions in the AC as its basis. It investigates the extent to which domestic factors related to social security drive member state interactions within the AC. To this end, we present three hypotheses on what explains network interactions, which follow the recent call for more fine-grained analysis of institutional and political factors as structuring premises for network interaction (Efrat and Newman Reference Efrat and Newman2018; Ruhs and Palme Reference Ruhs and Palme2018; Vantaggiato Reference Vantaggiato2018). Our first hypothesis uses welfare state types to explain who interacts with whom. Intra-EU migration has different – real or perceived – impacts on welfare systems, which leads to different implementation problems. Thus our first hypothesis relates to homogeneity: welfare states interact with other welfare states that provide social security in similar ways. Our second hypothesis holds that migration patterns explain interaction. We expect that member states that encounter higher levels of intra-EU migration interact more in the network, and that this effect is stronger for receiving states.
As such, we expect that interactions mirror the current political cleavage in EU politics between receiving and sending states. The issue at hand – cross-border welfare – is increasingly politicized at the national level. This politicization may impede or condition interactions, establishing more frequent exchanges within a subset of peers while leaving others at the periphery of the network. Finally, we hypothesize that some members are more capable of participating in the network than others. We expect that members from countries with a high administrative capacity tend to interact more in the network than those from low-capacity countries.
We base our analysis on new and unique survey data on the interactions among national representatives in the AC. Using these data, gathered for this article, we analyse who interacts with whom in the network. To identify patterns of institutional similarity among EU member states, we perform a cluster analysis based on three key fiscal welfare state attributes: quantity of welfare provided, type of financing and investment in welfare services. We identify four European welfare clusters: continental, Nordic–Atlantic, Eastern European and Southern-mixed. Social network analysis allows us to analyse the institutional dynamics underlying network governance. We use exponential random graph models (Handcock et al. Reference Handcock2008) to test what drives interactions in the AC.
Our findings provide support for the institutional and political image of network interactions. Networked welfare governance indeed takes place, but it is not a level playing field: interactions are not spread evenly between all peers. They occur more regularly among countries belonging to similar welfare types and between member states that receive large numbers of migrants from the EU. Co-operation in networked welfare governance thus tends to be homophilous, primarily taking place between similar types of welfare states. Furthermore, we find that the political cleavage between sending and receiving member states is mirrored in network interactions. This finding suggests that the network foremost serves as a platform for addressing the problems and challenges associated with incoming EU mobility among receiving member states, instead of a more general resource for learning and building capacities related to social security in the EU.
Eu Cross-Border Welfare: Political Contestation and Network Governance
Before describing our theoretical argument, this section sketches the regulatory and institutional context within which the AC operates. The rules governing cross-border welfare in the European Community date back to one of the oldest EU regulations, regulation no. 3/58 adopted in 1958. It became regulation 1408/71, and is currently titled regulation 883/2004. It details EU citizens' rights to social security in other member states, specifying which benefits can be exported to other member states and how these benefits can be aggregated between jurisdictions. Furthermore, the AC deals with the social security aspects of the posting of workers directive 96/71 and the interplay between the residence directive 2004/38 and regulation 883/2004.
The EU rules have had far-ranging consequences for the provision of social welfare and hence the functioning of national welfare states (Ferrera Reference Ferrera2003; Ferrera Reference Ferrera2005; Hemerijck Reference Hemerijck2013; Leibfried Reference Leibfried, Wallace, Pollack, Wallace and Young2015). Today, all EU workers, self-employed persons, and citizens who can provide for themselves and their family members have the right to move to and reside in the EU member state of their choice. In addition, they become eligible for welfare benefits in a hosting state under certain conditions. A wide range of welfare benefits are covered, including healthcare, pensions, maternity and paternity benefits, unemployment benefits and family benefits. Thus member states can no longer limit social benefits to their own citizens, but must treat citizens from other member states equally to their own (Leibfried Reference Leibfried, Wallace, Pollack, Wallace and Young2015, 280). Furthermore, an EU state can no longer insist that some of its benefits are provided only within its own territory (Leibfried Reference Leibfried, Wallace, Pollack, Wallace and Young2015, 280).
The political importance of EU welfare regulation has increased over time, as evidenced by the UK Brexit debate, in which ‘welfare tourism’ featured prominently (Blauberger et al. Reference Blauberger2018). The topic has also become increasingly politicized in several member states (Blauberger et al. Reference Blauberger2018; Cappelen and Peters Reference Cappelen and Peters2018; Roos Reference Roos2018; Roos and Westerveen Reference Roos and Westerveen2019). A new political cleavage has been identified in Europe, juxtaposing support for welfare state ‘closure’ – primarily expressed by receiving member states – against support for the free movement of labour, a position primarily held by sending member states (Dancygier and Walter Reference Dancygier, Walter, Beramendi, Häusermann, Kitschelt and Kriesi2015; Ferrera and Pellegata Reference Ferrera and Pellegata2018; Hemerijck Reference Hemerijck2013; Teney, Lacewell, and De Wilde Reference Teney, Lacewell and De Wilde2014; Walter Reference Walter2017). This cleavage also manifests itself in EU legislative politics (Roos and Westerveen Reference Roos and Westerveen2019). In December 2016, the European Commission proposed a revision of the Social Security Coordination regulation.Footnote 1 After intense discussion in both the Council of Ministers and the European Parliament, the proposal was rejected in a Council meeting on 29 March 2019. That day, Austria, Belgium, Denmark, Germany, Luxembourg, the Netherlands and Sweden formed a blocking minority to oppose increasing rights to cross-border welfare, particularly those concerning the facilitated access to and exportability of unemployment benefits.Footnote 2 The Czech Republic also voted against the proposal, but on the grounds that it did not sufficiently facilitate free movement.
Behind the political scene, bureaucrat experts join one another in the AC to address and solve problems related to the practical application of the cross-border welfare rules.Footnote 3 Civil servants from each member state are sent to participate in Brussels meetings by their competent national ministry or agency, and to interact with their EU counterparts. The AC and its subgroups meet very frequently – more than ninety times per year (European Commission, SWD (2018) 68, 19).
The network has four main functions. First, the AC shall facilitate uniform application of Community law, in particular by promoting the exchange of experiences and best practices between member states. Secondly, the AC can issue recommendations and make decisions on how the articles of the EU regulation shall be interpreted and applied. Over time, the AC has issued 243 decisions and 15 recommendations.Footnote 4 Thirdly, the AC provides a forum for dispute settlement. In 2004, a conciliation board was set up as part of the AC.Footnote 5 If two member states disagree about who is responsible for the social security of a migrant worker or how to interpret or apply the rules of the EU regulation, the national authorities concerned may call on the AC to intervene. The AC conciliation board will then interpret the dispute and decide on the case. Meeting minutes testify that disputes brought to the conciliation board typically involve a receiving and a sending member state.Footnote 6 Furthermore, the AC has an audit board that deals with the financial and cost-related aspects of the regulation.Footnote 7 Fourthly, the AC has a quasi-legislative function when the Commission prepares legislative proposals for reforming cross-border welfare.
AC committee members interact on a wide range of issues to fulfil these four functions. Some issues are regulatory in nature, while others concern how to improve co-operation and trust between competent national authorities. Still other issues are distributive, relating to benefit costs and reimbursement between member states. Through the many meetings in the committee and its ad hoc groups, representatives from member states will discuss and decide on key concerns of transnational welfare governance, such as which documents can member states exchange to certify an EU migrant's right to reside or eligibility for social benefits, and which portable documents fulfil the necessary authentication requirements. Ad hoc groups are established to decide which data can be exchanged electronically between national authorities and to promote co-operation between member states to avoid fraud and errors. AC members interact to prevent or solve distributive conflicts. For example, family benefits are a topical issue. As a result of migration, EU families may live in different member states and may draw rights to family benefits from different countries. Such situations can lead to disputes between member states in determining which national institution is responsible for what type of family benefit. The AC is the forum in which disagreements are addressed and conflicts prevented or solved by decisions of the conciliation board. Another example is healthcare. If an EU citizen is insured in Sweden but treated in Poland, Sweden is obliged to reimburse the cost of care to Poland, but what is the right level of reimbursement? Or if an EU citizen has a car accident and has to be hospitalized in Sweden, but has no healthcare insurance in his state of origin, who must pay? In cases involving ambiguity or disagreement, the AC will step in and decide.
With its administrative decisions, the AC takes on a quasi-legislative role. It also does so when the European Commission prepares a legislative proposal. In preparing the proposal to reform regulation 883/2004, the AC was the forum in which different political scenarios and reform options were discussed, data provided and member state positions presented beforehand. For example, the export of child benefits is a topical issue in EU cross-border welfare. In council negotiations, Germany, Ireland, Austria and Denmark worked firmly to have the Commission propose an indexation of child benefit so that benefits paid to children living in another member state would reflect the cost of living in the child's state of residence.Footnote 8 In preparing its proposal, the commission presented different options to the AC on how to reform the exportability of child benefits, including the status quo option, an indexation option and a no exportability option (SWD (2016) 460, part 1/6). National opinions on the different options were submitted by AC members and discussed in the committee. The commission concluded that the majority of member states preferred the status quo option; it discarded the indexation option (SWD (2016) 460, part 4/6, pp. 139–140).
It is important to note that the issues addressed in the AC are equally relevant to receiving and sending member states: they concern co-operation and trust between national authorities, they involve mutual decisions on which state has social responsibility for individual EU migrants, they decide on reimbursement levels and which documents will be certified and exchanged between receiving and sending member states, and they are quasi-legislative, helping the European Commission prepare legislative proposals.
Theory
Transnational co-operation in transgovernmental networks is commonly explained as a functional necessity flowing from the interdependencies created by complex governance challenges (Eberlein and Newman Reference Eberlein and Newman2008; Hartlapp and Heidbreder Reference Hartlapp and Heidbreder2018; Keohane and Nye Reference Keohane and Nye1974; Raustiala Reference Raustiala2002; Slaughter Reference Slaughter2004). The idea is that networks expand the capacity to address transnational policy challenges, allowing for the technocratic responses that only specialized domestic officials can provide. This flexible governance mode lowers transaction costs by focusing on the exchange of information, best practices, advice and problem solving (Slaugther and Hale Reference Slaughter, Hale and Bevir2010). In short, networked interaction is presented as a recipe for solving complex governance problems effectively and efficiently.
However, this ‘technocratic’ understanding of transgovernmental networks may run into limits in the case of politicized policy areas. Our thesis is that institutional differences and political cleavages will be important drivers of networked governance, in line with recent scholarly work by Vantaggiato (Reference Vantaggiato2018) and Efrat and Newman (Reference Efrat and Newman2018), among others. Interactions are found to be influenced by domestic factors (Bach and Newman Reference Bach and Newman2014), strategic action (Danielsen and Yesilkagit Reference Danielsen and Yesilkagit2014; Ruffing Reference Ruffing2015), political cleavages (Beyers and Kerremans Reference Beyers and Kerremans2004), and capacity (Beyers and Donas Reference Beyers and Donas2014). Furthermore, interactions are more likely among members that are perceived as similar or more influential (Efrat and Newman Reference Efrat and Newman2018; Vantaggiato Reference Vantaggiato2018). Therefore, we assume that network members are strategic actors that choose with whom to interact based on domestic considerations. In line with this assumption, we hypothesize that member states will interact mainly with other member states that are institutionally similar, and that those interactions depend on the level (high/low) or kind (incoming/outgoing) of migration, as well as the country's administrative capacity. Below we discuss these three hypothesized drivers of interactions.
First, institutional similarity is likely to drive interactions. Seeking out similar and like-minded partners for exchange, a type of homophily, is a pattern found in many studies on social networks (Cranmer and Desmarais Reference Cranmer and Desmarais2011; McPherson, Smith-Lovin and Cook Reference McPherson, Smith-Lovin and Cook2001). Indeed, recent contributions on European regulatory networks have found that networking is most extensive among national representatives from countries with similar types of capitalism (Lazega, Quintane and Casenaz Reference Lazega, Quintane and Casenaz2017; Vantaggiato Reference Vantaggiato2018), and that learning most often occurs among like-minded peers who are perceived to face similar institutional challenges (Papadopoulos Reference Papadopoulos2018). Efrat and Newman (Reference Efrat and Newman2018) call for a more fine-grained examination of national institutional characteristics to explain network interaction. Willingness to share information is a critical component of network interaction, but as Efrat and Newman (Reference Efrat and Newman2018) show, network members consider their domestic institutional context when assessing the reliability of their peers, and thus who they are willing to share information with. Coming from similar institutions fosters a shared understanding of relevant and trustworthy information – and thus who among network members one should interact with (Newman Reference Efrat and Newman2018). The same reasoning is likely to apply to a network such as the AC that has extensive tasks of information sharing, rule clarification and dispute resolution. When dealing with the application of European rules on social security, representatives from welfare states that are more similar are expected to experience comparable implementation challenges and draw from more equivalent practices. We thus expect that interactions concerning the co-ordination of social security systems and the uniform application of Community law are primarily driven by institutional similarity by means of welfare state types. Prior studies on welfare typologies have found that three main characteristics distinguish welfare states from each other: welfare quantity, the type of financing and investment in welfare services (Bambra Reference Bambra2007; Bonoli Reference Bonoli1997; Kautto Reference Kautto2002; Wendt Reference Wendt2009). These national institutional factors and divergences are likely to inform political and administrative positions on free movement and cross-border welfare (Ruhs and Palme Reference Ruhs and Palme2018).
The first relevant welfare state characteristic is the quantity of welfare being provided (Bonoli Reference Bonoli1997). Member states with more generous welfare benefits are likely to favour more conditional implementation of EU rules in order to maintain national control over the uptake of national benefits (Hjorth Reference Hjorth2015; Ruhs and Palme Reference Ruhs and Palme2018; Sampson Thierry Reference Sampson Thierry2019).
The type of financing is a second welfare state characteristic that is likely to affect the implementation of EU social security legislation (Bonoli Reference Bonoli1997). A widespread view among member states is that reciprocity should guide EU migrants' welfare entitlements (Ruhs and Palme Reference Ruhs and Palme2018, 1,490). Welfare states with a high degree of contribution-based rather than tax-financed welfare are better able to ensure that migrants' welfare entitlements mirror what they have contributed to the welfare budget.
Thirdly and finally, member states' investment in welfare services is likely to affect implementation. For example, access to (and reimbursement of) healthcare is a key element of EU rules. Whereas the redistribution strategy for some welfare states is mainly a transfer approach, which emphasizes cash benefits, others make more extensive social service investments (Bambra Reference Bambra2007; Kautto Reference Kautto2002; Wendt Reference Wendt2009). The latter are likely to favour a more conditional implementation of the rules on welfare services, in order to maintain national control (Sampson Thierry Reference Sampson Thierry2019).
On the basis of these three aspects, member states can be clustered into distinct welfare state types, which we use to formulate the following hypothesis:
Hypothesis 1: Members of the AC are more likely to interact with members that belong to the same type of welfare state as they do.
Secondly, interactions within the AC are likely to be contingent on the level of migration that network members experience. The more EU migrants a country is hosting, the more likely it is to encounter administrative questions regarding welfare regulations across borders. The same applies to sending member states: the more outgoing migrant workers a member state sends, the more likely administrative challenges are to arise concerning access to (and the exportability of) welfare benefits for their citizens residing in other member states. We therefore expect the network to be more relevant for member states with higher levels of migration.
Hypothesis 2a: The higher EU migration AC members encounter, the more likely they are to engage in network interactions
However, receiving and sending member states may not engage in network interactions in an equal fashion. Political interests may define how actively a member engages in a network. Networks can be conceptualized as patterns of interactions and exchanges specific to dealing with a certain policy problem (Kenis and Schneider Reference Kenis, Schneider, Marin and Mayntz1991; Scharpf Reference Scharpf1997). These patterns of interaction comprise the network structure, determining who is at the core and at the periphery; the structure is therefore expected to reflect the purpose of the network and how the policy problem is defined – which is in turn determined by politics. While horizontal networks of bureaucrats representing their member states may be presented as a way of depoliticizing sensitive issues (Eberlein and Newman Reference Eberlein and Newman2008), it is questionable whether political cleavages are in fact overcome in real network interactions. The reason is in the political structure underpinning network establishment: this is an attractive alternative to supranational oversight for national governments wanting to co-operate on sensitive issues, while wishing to maximize national sovereignty (Eberlein and Newman Reference Eberlein and Newman2008, 35; Kelemen and Tarrant Reference Kelemen and Tarrant2011). Particularly in the case of distributive conflict, such a network is unlikely to overcome existing cleavages. In their study of a governance network with bureaucrats, politicians and societal interest, Beyers and Kerremans (Reference Beyers and Kerremans2004) demonstrate that network interactions tend to reflect political cleavages between member states instead of overcoming them.Footnote 9 In other words, the political incentives leading to network establishment may also drive interactions within that network – and, ultimately, its impact.
This dynamic is highly likely to occur in the field of social security for EU migrants. The heated political debate on EU free movement and access to welfare has portrayed receiving member states as paying the price of EU migration, as a result of ‘welfare tourism’ and ‘social dumping’ (Blauberger et al. Reference Blauberger2018). Additionally, in European Council negotiations, a political cleavage has manifested depending on the kind (incoming/outgoing) of mobility a member state encounters, dividing members before and after the 2004 enlargement, that is, between ‘old’ and ‘new’ member states (Roos and Westerveen Reference Roos and Westerveen2019). We thus anticipate that the kind of mobility a member state encounters also drives interactions within the network: we expect receiving member states to be more active in the network than sending states.
Hypothesis 2b: AC members that are on the receiving end of migration are more likely to engage in interactions than sending members.
In addition to their readiness to interact, some members are expected to be more capable of participating in the network than others. Although governance networks stimulate coordination and reduce the transaction costs of exchanging valuable information and practices to solve common problems associated with high interdependence (Jones, Hesterly and Borgatti Reference Jones, Hesterly and Borgatti1997), active participation requires a certain level of administrative capacity for two reasons. First, administrative capacity is found to significantly improve the legal implementation and application of EU law in domestic practices (Zhelyazkova, Kaya and Schrama Reference Zhelyazkova, Kaya and Schrama2016), which makes national representatives of more effective governments more attractive to gain information, advice and best practices from. Secondly, establishing and maintaining ties with peers and actively participating in networks requires time and resources (Leifeld and Schneider Reference Leifeld and Schneider2012). Accordingly, staff size has been identified as a significant driver of interaction in networks (Beyers and Donas Reference Beyers and Donas2014). The degree to which network members can spare the time and resources to engage in activities related to the AC is likely to drive engagement in the network.
Hypothesis 3: The higher a member state's administrative capacity, the greater its likelihood of interacting in the AC.
Methodology and Data Collection
Social Network Analysis and Exponential Random Graph Models
To describe interactions, we use social network analysis. To take into account the relational character of EU welfare governance, our unit of analysis is the bilateral interaction among members of the European administrative network regulating welfare across EU borders. Social network analysis enables us to study what drives these network interactions.
We develop exponential random graph models (ERGMs) to test our hypotheses regarding the driving forces of network interaction (see Handcock et al. Reference Handcock2008). The underlying assumption of ERGMs is that networks self-organize through continuing processes of forming ties over time, influenced by both attributes of the actors involved as well as network dependency structures (Robins et al. Reference Robins, Lusher, Koskinen and Robins2012; Schrama Reference Schrama2018; Vantaggiato Reference Vantaggiato2018). Simply put, network ties depend on one another by definition, as one tie influences the likelihood of the existence of another tie. In this sense, they self-organize, and this process is influenced by network structures. To ascertain the effect of actor attributes on the likelihood of a certain tie, these dependencies need to be taken into account. Modelling the effects of interest and taking network structural tendencies into account allows us to estimate the significance of institutional similarity, EU mobility, administrative capacity and multiplex relations with regard to interactions in EU welfare governance.
Data Collection
Dependent variables
We collected our data on network interactions using an online survey distributed to all national representatives of the AC in 2018. The survey asked respondents with which other national representatives they most frequently (1) exchanged best practices, (2) provided and received advice, (3) exchanged information and (4) resolved a problem related to the co-ordination of social security. They were free to list as few or as many as they saw fit. The survey had a 100 per cent response rate and resulted in four distinct adjacency matrices for each type of bilateral interaction. These matrices represent four different networks in which different kinds of resources are mutually exchanged and were each used as dependent variables in our models.
Explanatory variables
To test whether network interaction is driven by institutional similarity of welfare states, we group all EU member states according to the three key indicators of welfare models introduced above.Footnote 10 First, we measured total social protection expenditures as a percentage of GDP. Secondly, we measured social contributions as a percentage of total social protection receipts. Thirdly, we measured welfare services as the share of the total social protection benefits. All three indicators were compiled from Eurostat.Footnote 11 To establish distinct welfare clusters, we ran a Ward's hierarchical cluster analysisFootnote 12 (Murtagh and Legendre Reference Murtagh and Legendre2014), grouping countries according to similarity on these indicators. In our model, institutional similarity is treated as a dyadic attribute, which takes into account whether two network members belong to the same welfare cluster.
Next, we operationalized EU mobility by taking into account both the number of EU migrants that EU member states are hosting, as well as the number of EU migrants EU member states are sending. The data on EU mobility were taken from Eurostat.Footnote 13
Furthermore, we operationalized administrative capacity both at the level of the national government and the level of the administrative unit represented in the network. The former was operationalized as the level of government effectiveness. This indicator was taken from the Worldwide Governance Indicators (World Bank 2017) and captures the quality of public, civil service as well as policy implementation more generally. Staff represents the level of staff employed in the administrative unit who are involved in the network. The data on staff levels were collected in our survey and are categorized as less than 1, 1–2, 2–3, or at least 4 full-time (or equivalent) employees.
We control for the interdependency related to geographic proximity, which has been identified as a driver of interaction in other transgovernmental networks (Vantaggiato Reference Vantaggiato2018). Geographic proximity is a matrix of countries that share a border (1) or not (0). Countries are considered to share a border if they are separated by a land or river border or no more than 24 miles of water. We alo consider transitivity, which is the network structural tendency of actors to close triads. This is a common social pattern of being more open to interactions with individuals you already know indirectly through others (Goodreau, Kitts and Morris Reference Goodreau, Kitts and Morris2009). We include a geometrically weighted edgewise shared partners statistic in our model to take this tendency into account (Snijders et al. Reference Snijders2006).
Results
Cluster Analysis on Welfare Indicators
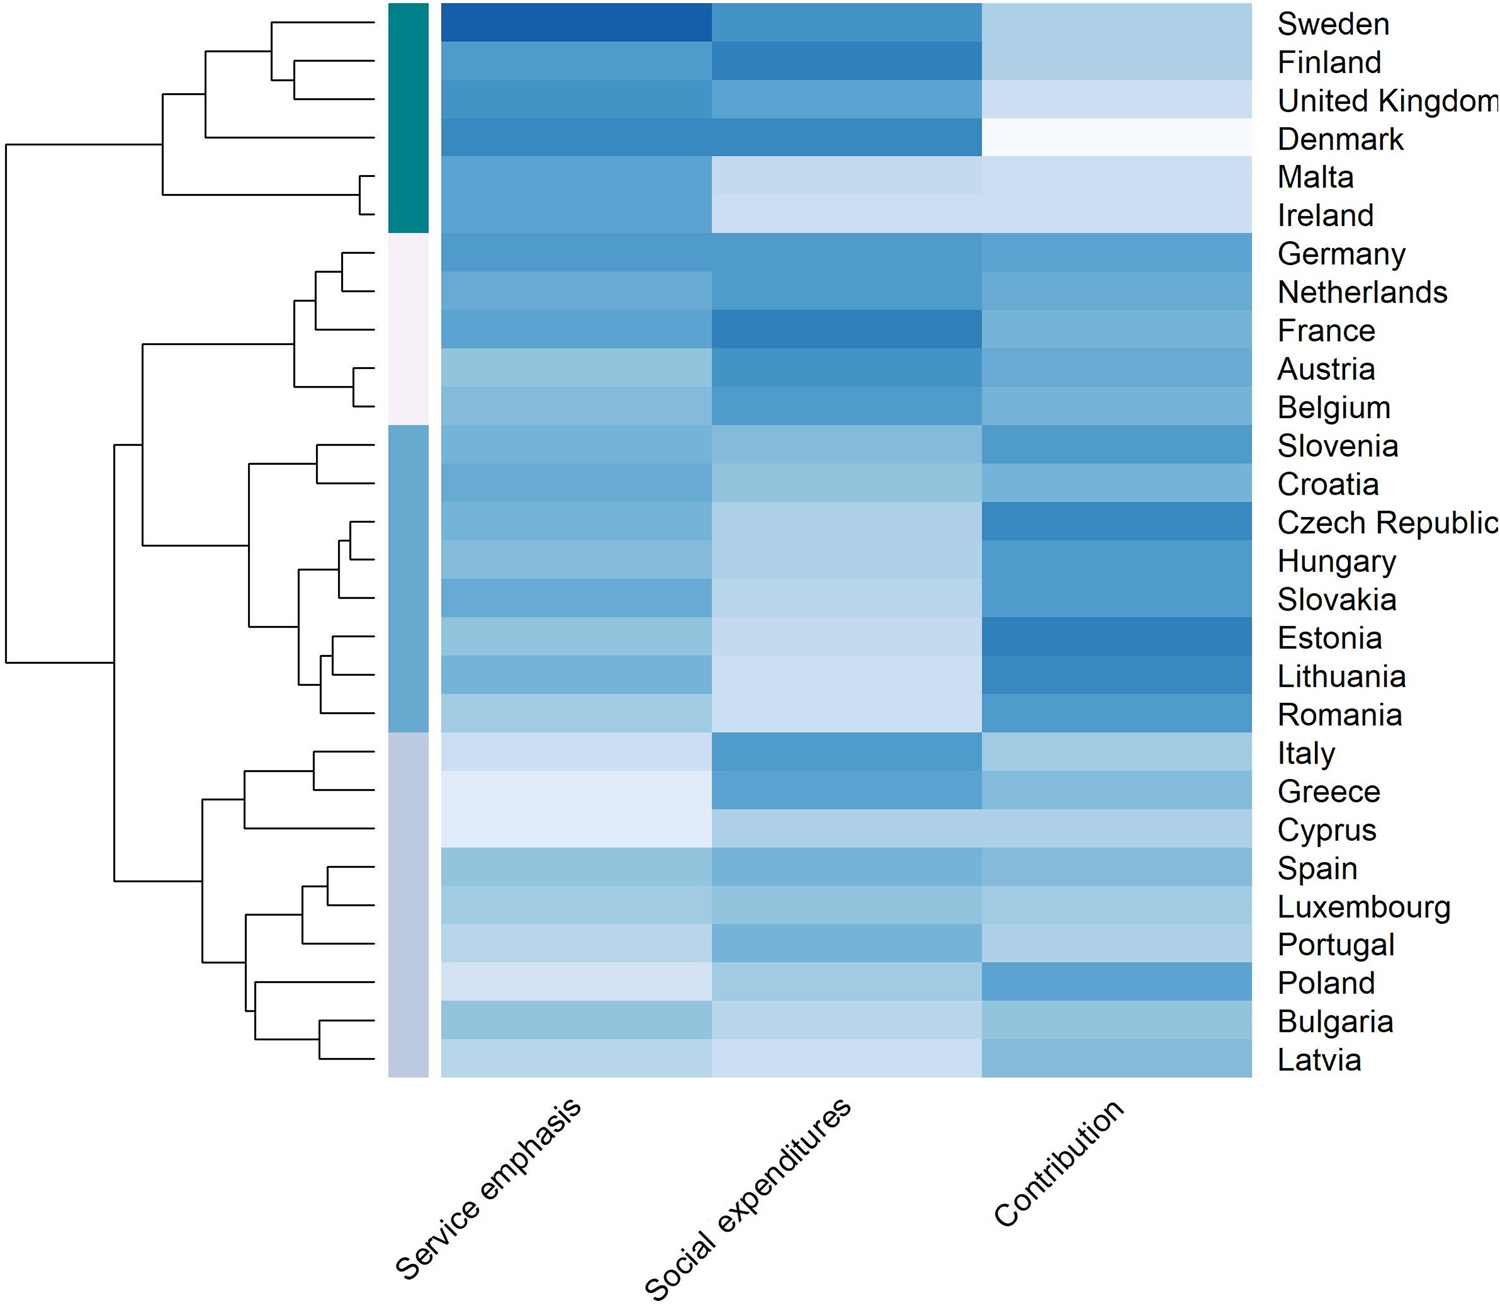
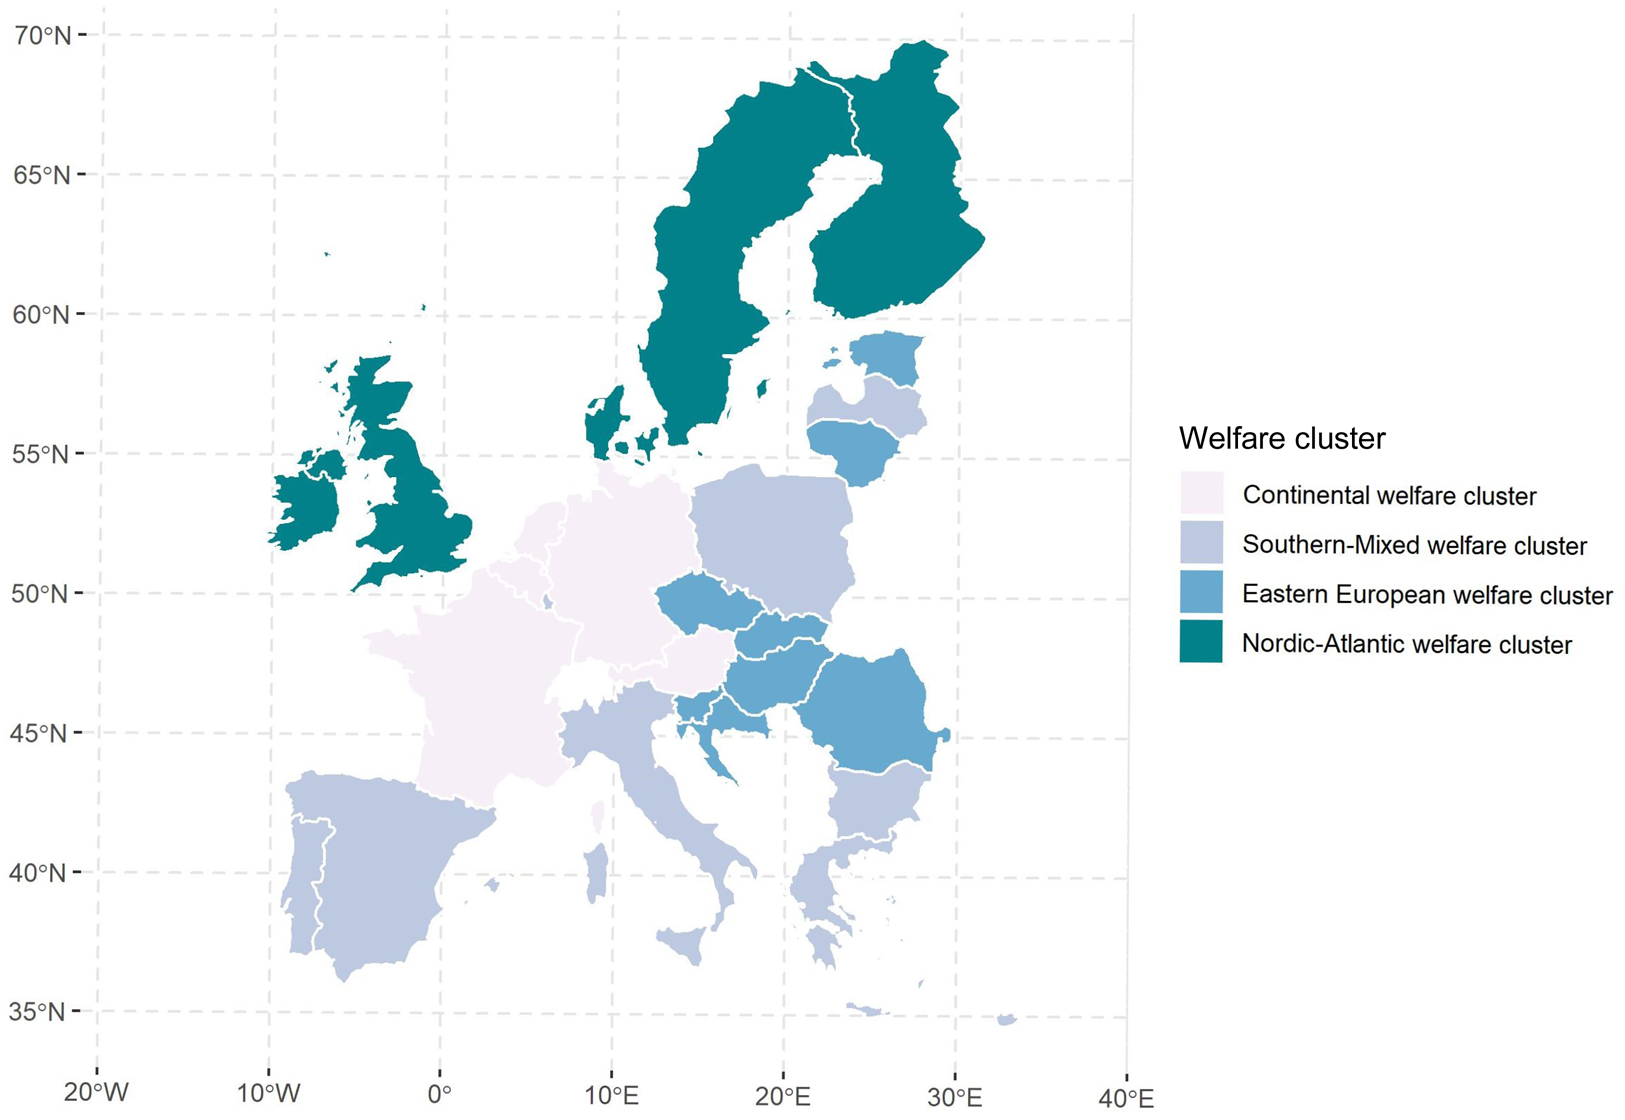
We first present the results of our cluster analysis, which provide the basis for testing Hypothesis 1. The raw comparative data behind the cluster analysis are listed in Appendix Table 1. Using the three elements of expenditures, contribution and service emphasis, our analysis groups EU member states into four welfare clusters. The heatmap in Figure 1 shows how each country scores on the welfare indicators relative to each other. The tree structure on the side of the heatmap shows the following: while the four clusters of countries fall apart in even smaller clusters, the differences between these four groups of EU member states are larger than the differences within them. Looking more closely at how these welfare clusters of EU member states map onto the three indicators, we identify four distinct patterns (see Figures 1 and 2).
Heatmap of welfare indicators for each cluster of EU member states
Note: dark-coloured cells reflect higher relative values, and light-coloured cells reflect lower relative values. The colour bar on the left reflects the identified clusters.

Geographic mapping of welfare clusters based on social contribution, social expenditure and share of service benefits

Overall, our categorization of welfare clusters of EU member states based on levels of social contribution, social expenditure and share of service benefits is more complete, although largely in line with earlier classifications (Bambra Reference Bambra2007; Wendt Reference Wendt2009). The first is the Continental welfare cluster, composed of Germany, the Netherlands, France, Austria and Belgium. This cluster is characterized by relatively high total social expenditures as a percentage of GDP and by being mainly contribution financed. In terms of welfare financing, this cluster is typically Bismarckian (Bonoli Reference Bonoli1997). At the same time, the service emphasis of this cluster is lower than the second cluster described below for most countries.
The second cluster is the Nordic-Atlantic welfare cluster, which is characterized by a relatively high level of welfare services and by being primarily tax financed. Sweden, Finland, Denmark, the UK, Ireland and Malta belong to this cluster. In terms of welfare financing, the cluster belongs to the Beveridge type (Bonoli Reference Bonoli1997). Compared to previous cluster analyses (Bonoli Reference Bonoli1997; Esping-Andersen Reference Esping-Andersen1990; Ferrera Reference Ferrera1996), it may come as a surprise that the Nordic countries are grouped together with the UK, Ireland and Malta. This finding is, however, in line with Kautto's (Reference Kautto2002) clustering and reflects the fact that whereas the UK, Ireland and Malta score lower on total social expenditures as a percentage of GDP than their Nordic counterparts, they share a relatively high service emphasis and have a welfare system that is mainly tax financed. Thus they fall into the same cluster.
The third cluster is the Eastern European welfare cluster, which includes Slovenia, Croatia, the Czech Republic, Hungary, Slovakia, Estonia, Lithuania and Romania. This group of countries has thus far been largely unmapped, and it is interesting to see that they represent a distinct welfare cluster. In this cluster, total social expenditures as a percentage of GDP are low and mainly contribution financed. Out of the welfare provided, there is, however, a certain relative service emphasis. However, this is indeed a relative measure drawn on the basis of benefits in kind as a percentage of total social benefits. Appendix Table 1 shows that the actual benefits in kind as purchasing power per inhabitant remains low.
The fourth and final cluster is the Southern-Mixed welfare cluster, which includes a mix of EU member states, including all southern European members (Italy, Greece, Spain, Portugal and Cyprus) as well as Luxembourg, Poland, Bulgaria and Latvia. This welfare cluster is characterized by being relatively low on total social expenditures as a percentage of GDP, albeit Italy, Spain, Greece and Portugal score somewhat higher. It has the lowest score on service emphasis across the four clusters, and its welfare is primarily contribution financed.
Social Network Analysis of Networked Welfare Governance
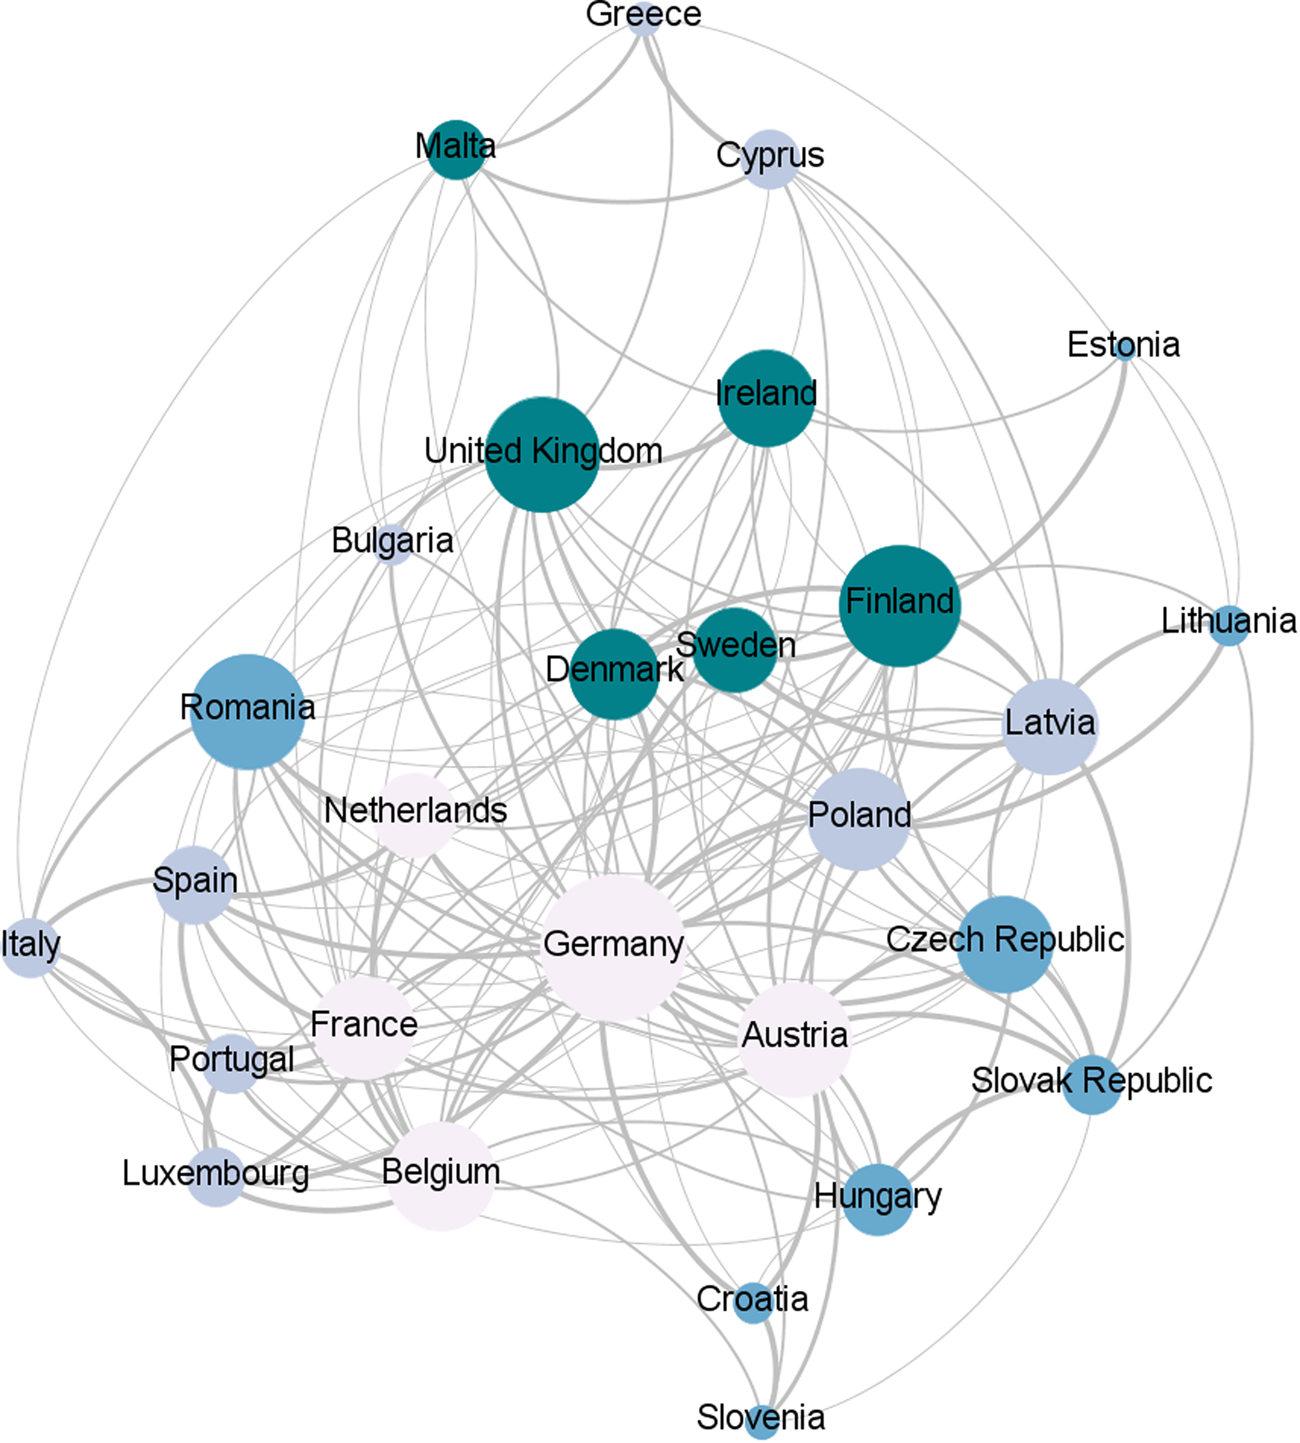
Visualizing networked interactions regarding the co-ordination of social security in the AC and the welfare cluster to which each national representative belongs, we can recognize a distinct pattern. Similar to the welfare clusters, we find that actors tend to cluster together with regard to their interactions (see Figure 3). This clustering seems to be especially strong for countries in the Continental welfare cluster and the Nordic-Atlantic welfare cluster. Moreover, we see a particularly central role for Germany, which demonstrates the most connections among members of the AC. By contrast, Eastern European and Southern European countries generally appear to be more towards the periphery of the network.
Network interactions based on the exchange of information, best practices, advice and problem solving in the Administrative Commission
Note: the thicker the tie, the more types of exchanges were involved in network interactions. The size of the nodes represents the number of connections, and the colour represents the welfare cluster (light grey = Continental; lilac = Nordic-Atlantic; blue = Eastern European and turquoise = Southern-Mixed).

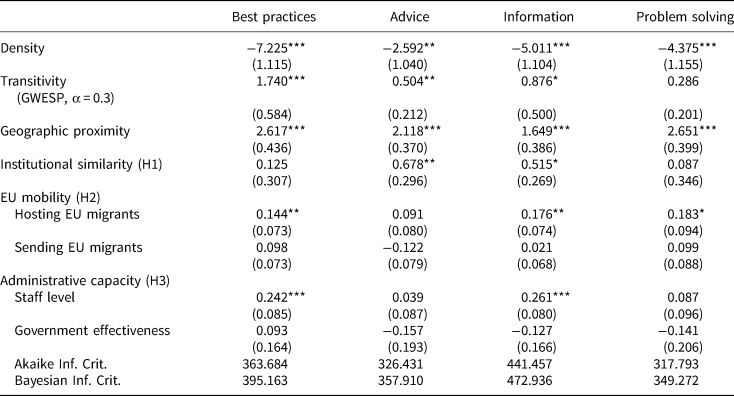
To test whether national representatives significantly engage more with their counterparts from similar welfare types, and whether this is the case for all kinds of exchanges, we rely on the results from our exponential random graph models (reported in Table 1). Each model estimates the hypothesized effects on the likelihood of interacting to exchange best practices, advice or information, or for problem solving (goodness-of-fit diagnostics of each model are displayed in Appendix Figures 1–4). Before we interpret the results of the models in relation to our hypotheses, we discuss the structural dependencies for which we controlled in the models: transitivity and geographic proximity. First, we find that there is an overall network tendency to close triads, no matter what, as shown by the significant effect of transitivity for all interactions except problem solving. This indicates that interactions are dense but also clustered, which is in line with the visualization of the network in Figure 3. The fact that we do not find a significant effect for transitivity for problem solving does not mean there is no tendency for this kind of clustered interaction, but that we can explain this using the other included variables. Secondly, geographic proximity is a significant and strong determinant of interaction. When two countries share a border, they are likely to interact in the network as well.
Exponential random graph models on network member attributes

Note: coefficients are log odds ratios and standard deviations are in parentheses. GWESP = geometrically weighted edgewise shared partners. *p < 0.1 **p < 0.5 ***p < 0.01
Beyond these factors that influence network interactions, we test what drives national representatives to interact and with whom to interact. First, in line with Hypothesis 1, we find that institutional similarity has a significant and positive effect on the likelihood that two types of ties will materialize: the exchange of advice and information sharing. The effect is particularly strong for the likelihood that national representatives give each other advice. The oddsFootnote 14 that two institutionally similar welfare state representatives exchange advice are 1.97, meaning that national representatives from similar welfare clusters are almost twice as likely to give each other advice. The exchange of advice can be interpreted as a kind of exchange that is most relevant for representatives coming from similar systems in regard to welfare policies. Network members from similar institutional backgrounds with regard to welfare policies can be assumed to be more likeminded and therefore more open to each other's advice on the coordination of social protection.
Furthermore, in line with Hypothesis 2a, we find that EU mobility drives interactions in the network. However, this effect is not similar for sending and receiving members. In line with Hypothesis 2b, we find very strong and significant effects for members who encounter high incoming EU mobility, while there is no significant effect for members who encounter high outgoing EU mobility. The higher the number of EU migrants hosted by EU member states, the more actively their national representatives use the European administrative network. This holds true for both the exchange of best practices and information sharing, which indicates that the administrative network is most beneficial for EU member states on the receiving side of EU mobility. While interactions related to problem solving show a similar tendency, the effect is not significant at the 5 per cent level and should therefore be interpreted with caution. No significant effect of EU mobility is found for the exchange of advice, suggesting that countries that host more EU migrants are not significantly more active in all kinds of interactions. We do not find that the number of emigrating EU citizens positively affects the likelihood that the national representative of their home country will engage in the network. Overall, the finding that sending member states do not engage to the same extent as hosting member states suggests that cooperation and learning are biased towards those at the receiving end of EU mobility. This is contrary to the network's objective, which is to enhance horizontal cooperation and interaction, and even reflects political cleavages and a core–periphery structure.
Interestingly, we do not find that administrative capacity has a clear and consistent effect on the likelihood of network engagement (Hypothesis 3). Overall government effectiveness does not significantly affect whether or not members engage in any kind of network exchange. However, regardless of the effectiveness of national governments, we do see that for some kinds of exchanges, it matters how many employed staff members are involved in the AC's activities. The results indicate that administrative units with higher staff levels were more likely to exchange best practices and information, whereas this is not the case with regard to the exchange of advice or problem solving. On the one hand, this indicates that the former activities require more administrative capacity; on the other hand, it could mean that the exchange of advice and problem solving are considered more vital to network members.
Conclusion
Around the world, migration is regarded as a challenge to the welfare state, which forces states to decide how to regulate social protection for those on the move. The EU has adopted exceptional rules in this regard, allowing EU migrants the right to move to and access welfare in other member states. Yet the rules are complex and detailed, filled with political compromises and judicial interpretations. Thus national administrations face implementation challenges related to managing the specific characteristics of their national welfare schemes, the increased politicization of the rules and the requirement to comply with EU obligations. To ensure cooperation between the representatives of advanced welfare states, the AC is a key instrument to enable information sharing, rule clarification and dispute resolution.
Crucially, the AC can facilitate learning, capacity building and dispute settlement between member states. It also is a rather likely case for network interactions to develop across the board, as it scores high on a number of prerequisites for interactions to materialize across the network: it is an explicitly formalized network with a long history of collaboration between members that are highly interdependent, and it has the required resources to sustain interactions. At the same time, we can doubt whether interactions really develop across the board, given the contested nature of welfare provision to migrants, and the fact that previous network research has shown that domestic political and institutional factors may structure interactions within a network.
Following recent work on how domestic factors structure international co-operation (Bach and Newman Reference Bach and Newman2014; Efrat and Newman Reference Efrat and Newman2018; Ruhs and Palme Reference Ruhs and Palme2018; Vantaggiato Reference Vantaggiato2018), we presented the theoretical argument that network members of advanced welfare states seek out peers from similar institutional contexts for their network interactions. National welfare institutions are likely to structure interactions not only because they represent strong institutional legacies and ways of doing things, but also because institutions contribute to divergent political responses to free movement and cross-border welfare (Ruhs and Palme Reference Ruhs and Palme2018). The civil servants who are interacting bring with them a specific institutional and political context that informs the related implementation challenges and therefore their administrative positions in transnational welfare governance.
Our analysis identified four welfare state types: continental, Nordic-Atlantic, Eastern European and Southern-mixed. We find that these types indeed structure who interacts with whom in the AC. Welfare state representatives turn to peers from similar institutional contexts when exchanging information and seeking advice on free movement and cross-border welfare. In particular, our analysis revealed that national representatives from similar welfare state types have a strong tendency to exchange advice with one another. Giving advice on implementation challenges reflects trust between peers, but tends to be directed towards counterparts from similar institutional contexts. Furthermore, we found that countries with high numbers of incoming EU migrants more often engage in network interactions, primarily to exchange best practices and information. Member states with high levels outgoing migration, by contrast, do not engage in interactions more often than others. Finally, we find that differences in overall government effectiveness do not affect activity in the network. However, higher staff levels do enable more activity for some types of exchanges, indicating that even though highly embedded relationships may reduce transaction costs, some member states are more capable of participating in the network.
Our results demonstrate that networked welfare governance indeed materializes, but not evenly throughout the network, as the policy theory underpinning the AC holds. Instead of exchanging information, best practices, giving advice and solving problems across the spread of experiences of EU-28, interaction occurs particularly among similar welfare types. Furthermore, our findings show the centrality of receiving member states in the network. Whereas political and administrative challenges can be expected to occur to the same extent for receiving and sending member states, receiving member states tend to define the network, serving as the network core, whereas sending member states are placed at the periphery of the network. Co-operation in networked welfare governance is rather homophilous and mirrors the political cleavages between sending and receiving member states that have also been identified in Council negotiations between national ministers.
These findings have several implications. The first relates to the rules at stake in discussions of EU free movement and cross-border welfare; the benefits of co-operation are not distributed evenly. Information is a core input of governance (Efrat and Newman Reference Efrat and Newman2018). Advice giving is just as essential as input when implementation challenges associated with transnational welfare governance are to be solved. However, our analysis shows that information and advice primarily flow between peers from the same institutional context, which hinders a more even spread of core inputs to improve EU governance.
Secondly, given that we have investigated a case that is highly likely to be fully integrated and have the ability to depoliticize issues, our finding of homophilous network interactions has implications for other network types. The findings suggest that less developed networks – whether they are younger, meet less frequency, have fewer functions or lack a secretariat – will be less able to overcome political differences and clustered interactions.
Thirdly, the core–periphery structure identified between receiving and sending member states in transnational network governance contradicts the conventional theoretical argument that network interaction revolves around interdependencies created by complex governance challenges. Despite interdependencies between receiving and sending member states, the former are key to defining the challenges and solutions associated with transnational welfare governance. We see that peers interact with peers, but that some peers are more active than others. These peers interact at the core of the network, and are thus more able to define problems and solutions in the everyday governance of Europe.
Supplementary material
Data replication sets are available in Harvard Dataverse at: https://doi.org/10.7910/DVN/811M8C and online appendices at https://doi.org/10.1017/S0007123420000204.
Acknowledgements
We thank our anonymous reviewers for their helpful comments. We also thank Lukas Müller and Søren Lund Frandsen for their assistance in collecting our data. The research for this article was funded by the Danish Council for Independent Research, grant. no. DFF-7015-00024.