Introduction
In natural protected areas, monitoring programmes, management and conservation strategies are commonly designed for plants and vertebrates, but the effectiveness of these plans in the conservation of invertebrates is not well known (Haslett, Reference Haslett2001; Carignan & Villard, Reference Carignan and Villard2002). Among insects, parasitoids are a promising model for diversity studies. These species represent a large proportion of global species richness (LaSalle & Gauld, Reference LaSalle, Gauld, LaSalle and Gauld1993); for instance, it has been estimated that there are five to six parasitoid species for every herbivorous insect species (Askew & Shaw, Reference Askew, Shaw, Waage and Greathead1986; Hawkins & Lawton, Reference Hawkins and Lawton1987). Parasitoid insects also provide essential ecological services for ecosystems by regulating insect populations, especially those of phytophagous species (LaSalle & Gauld, Reference LaSalle, Gauld, LaSalle and Gauld1993). This regulatory role makes parasitoids key bioindicators of the conservation status of disturbed environments (Chay-Hernández et al., Reference Chay-Hernández, Delfín-González and Parra-Tabla2006; Sharkey, Reference Sharkey2007; Anderson & Purvis, Reference Anderson and Purvis2008).
For conservation purposes, parasitoids are relevant because they have highly sensitive life cycles, which increases their vulnerability to drastic population reductions and sometimes leads to local extinctions of some species (Hochberg & Ives, Reference Hochberg and Ives2000). These reductions and extinctions can have unpredictable effects on prey population dynamics and may unleash cascade effects in ecosystems (LaSalle & Gauld, Reference LaSalle, Gauld, LaSalle and Gauld1993). The effective conservation of parasitoids requires a basic species inventory, research on parasitoid diversity and distribution, and the development of monitoring programmes that allow the evaluation of species’ conservation status (Fraser et al., Reference Fraser, Dytham and Mayhew2008a).
Given their ecological importance and the limited coverage of parasitoids in management plans for biodiversity conservation, our study focused on the Ichneumonidae (Hymenoptera) in a biosphere reserve in the seasonal tropics of south-eastern Mexico (Yucatan Peninsula). Ichneumonidae species richness is highest among parasitoids. Parasitoids are present in almost all natural and managed ecosystems but are among the least represented organisms in management and conservation plans (Gauld, Reference Gauld1991; Hochberg & Ives, Reference Hochberg and Ives2000; Dolphin & Quicke, Reference Dolphin and Quicke2001).
Studies on the Ichneumonidae of Mexico have mainly focused on faunistic, taxonomic or biogeographical patterns (e.g., Ruíz-Cancino & Tejada, Reference Ruíz-Cancino and Tejada1986; Ruíz-Cancino et al., Reference Ruíz-Cancino, Coronado and Martínez2002; Kasparyan & Ruíz-Cancino, Reference Kasparyan, Ruíz-Cancino, Llorente, Morrone, Yáñez and Vargas2004a, Reference Kaparyan and Ruíz-Cancinob, Reference Kasparyan and Ruíz-Cancinoc, Reference Kasparyan and Ruíz-Cancinod; Kasparyan, Reference Kasparyan2007a, Reference Kasparyanb, Reference Kasparyanc; Khalaim & Ruíz-Cancino, Reference Khalaim and Ruiz-Cancino2009; Bordera et al., Reference Bordera, González-Moreno, Sääksjärvi and Veijalainen2010; González-Moreno et al., Reference González-Moreno, Bordera and Delfín-González2010; Ruíz-Cancino, Reference Ruíz-Cancino2010; Ruíz-Cancino et al., Reference Ruiz-Cancino, Kasparyan, Coronado, Myartseva, Trjapitzin, Hernández and García2010; González-Moreno & Bordera, Reference González-Moreno and Bordera2011, Reference González-Moreno and Bordera2012), but few studies have evaluated the spatial and/or temporal diversity of Ichneumonidae in Mexico (Chay-Hernández et al., Reference Chay-Hernández, Delfín-González and Parra-Tabla2006; Pérez-Urbina et al., Reference Pérez-Urbina, Correa-Sandoval, Ruíz-Cancino, Kasparyan, Coronado-Blanco and Horta-Vega2010; González-Moreno et al., Reference González-Moreno, Bordera and Delfín-González2010; González-Moreno et al., Reference González-Moreno, Bordera and Delfín-González2015).
The aim of the present paper is to assess whether and how vegetation type, land management of conservation areas and seasonality influence the diversity of Ichneumonidae in a protected area of Mexico. To this end, the following three hypotheses were tested:
1) The ‘enemies hypothesis’ (EH) (Root, Reference Root1973) argues that structural complexity and high plant diversity favour increased prey or phytophagous hosts and, consequently, predators or parasitoids; therefore, the dry forest should have higher species richness and diversity indices than other vegetation types.
2) The second hypothesis proposes that the conservation status of vegetation affects ichneumonid species richness; zones with a higher conservation level (core zones) should have higher richness and diversity than zones with a low conservation level (buffer zones) because, in buffer zones, agriculture, construction and other activities are allowed, and these activities have been reported as the main causes of insect habitat loss, leading to population decreases or even extinction (Samways, Reference Samways2007).
3) The third hypothesis proposes that abundance and species richness will be higher during the rainy season because of the increase in productivity and vegetation complexity (Andrade et al., Reference Andrade, De la Barrera, Reyes-García, Ricalde, Vargas-Soto and Cervera2007), offering more resources for herbivores and parasitoids (Gauld, Reference Gauld1991; Shapiro & Pickering, Reference Shapiro and Pickering2000).
Materials and methods
Study area
The Ría Lagartos Biosphere Reserve (Reserva de la Biósfera Ría Lagartos, RBRL) is located at approximately 21°36′N, 88°10′W in north-eastern Yucatan, Mexico. The average annual temperature is 26°C; the temperature of the coldest month averages 18°C. The average annual rainfall is 670 mm, most of which (48%) occurs during the summer months (July–October). During the dry season (March–June), 27% of the precipitation occurs, while during the north-winds season (November–February), 25% of the precipitation occurs (CONANP, 2000). The three most common vegetation types are coastal dune scrubland, savannah and tropical dry forest (González-Moreno & Bordera, Reference González-Moreno and Bordera2011). Every vegetation type has two conservation status areas, a core, and a buffer zone, which have a total area of 23,681 ha and 36,666 ha, respectively.
In the core zones, only research and habitat restoration activities are permitted; any other kind of activity, such as agriculture, hunting or plant collection, is forbidden. In the buffer zones, some activities that are considered ‘low impact’ are allowed by law, such as wood collection for fuel and traditional slash and burn agriculture or the maintenance of the artificial grasslands that existed before the reserve was established.
The pressure on the buffer zones differs by vegetation type; for instance, the coastal scrubland is subject to destruction for construction and trails. The savannah is sometimes destroyed for grassland establishment but then abandoned, as this ecosystem is not very productive; it is also affected by highway and dumping site establishment. The dry forest is subject to several uses, such as slash and burn agriculture, the establishment of artificial grasslands and cattle grazing, the establishment of orchards for fruit production, maintenance of honeybee hives and forestry exploitation.
The tropical dry forest is dominated by trees that lose their leaves during the driest months of the year (Rzedowski, Reference Rzedowski2006), which lasts between 5 and 6 months in the reserve; the canopy height ranges between 8 and 12 m. Stem diameters rarely reach 50 cm, and the branches develop at low heights. The shrub cover is sparse, except in gaps where the tree canopy is open from damage to branches or tree falls. Some of the dominant tree species, either by size or by density, include the naked Indian tree Bursera simaruba (Burseraceae), black poisonwood Metopium brownei (Anacardiaceae) and Caesalpinia gaumeri (Fabaceae). Other conspicuous elements of this forest include the presence of columnar and shrubby cacti, the existence of epiphytic plants such as bromeliads and orchids, and some palm-like trees such as Beaucarnea pliabilis (Asparagaceae).
The savannah consists of isolated patches dominated by low trees (8 m or less) that are surrounded by a matrix of bare rocky soil with abundant herbs and grasses during the rainy season. Some species are shared between this vegetation type and the dry forest type, such as the naked Indian tree; however, individuals here are smaller due to the shallow soils. In some sections, the drainage is poor, and since its terrain is flat, with almost non-existent slope, it can be flooded during part of the rainy season.
The coastal scrubland exhibits a structure typical of dry regions, which may be due to the combination of high temperatures and sandy soil, which reduce the water stored in the soil and increase the evaporation rates. This vegetation type is dominated by small palm trees and shrubs, which do not reach 6 m in height and produce branches less than 1 m from the soil. Several shrub species are thorny or spiny; Cactaceae such as Opuntia stricta, Acanthocereus pentagonus and Selenicereus grandiflorus are very abundant, together with other succulent plants, such as Agave angustifolia. Epiphytic bromeliads and orchids are common and, in some patches, can be very abundant.
In each vegetation type, two sites were selected, each representing the two land management types: the core and the buffer zones of the reserve. Sites were a minimum of 2 ha. Malaise traps were used for ichneumonid sampling, which is the method most often used in monitoring programmes (e.g., Gauld, Reference Gauld1991; Longino, Reference Longino1994) and which produce large captures of hymenopteran parasitoids (Sääksjärvi et al., Reference Sääksjärvi, Haataja, Neuvonen, Gauld, Jussila and Salo2004, Reference Sääksjärvi, Ruokolainen, Tuomisto, Haataja, Fine, Cárdenas, Mesones and Targas2006; Fraser et al., Reference Fraser, Dytham and Mayhew2007). Twelve traps in total (two traps per site) were used. At each site, the traps were separated by 2 km and were placed at the centre of the vegetation type to avoid edge effects. The sampling programme was carried out for 14 months, from June 2008 to September 2009, with samples collected every 15 days.
Neotropical fauna keys were used to identify Ichneumonidae, (e.g., Townes & Townes, Reference Townes and Townes1966; Dasch, Reference Dasch1974; Gauld, Reference Gauld1988, Reference Gauld1991, Reference Gauld1997, Reference Gauld2000; Gauld et al., Reference Gauld, Ugalde and Hanson1998, Reference Gauld, Godoy, Sithole and Ugalde2002), Mexican fauna (e.g., Kasparyan & Ruíz-Cancino, Reference Kasparyan and Ruíz-Cancino2005, Reference Kasparyan and Ruíz-Cancino2008) and Nearctic fauna (e.g., Townes & Townes, Reference Townes and Townes1959, Reference Townes and Townes1962; Townes, Reference Townes1969, Reference Townes1970a, Reference Townesb, Reference Townes1971; Dasch, Reference Dasch1979). Due to a lack of keys, some subfamilies, such as Ichneumoninae, Campopleginae and Orthocentrinae, were only identified to the genus level and separated as morphospecies using the keys by Townes & Townes (Reference Townes and Townes1966), Townes (Reference Townes1970b) and Townes (Reference Townes1971).
Some of the collected materials were compared with type and non-type specimens from the following institutions: Instituto Nacional de Biodiversidad (INBio), currently MNCR (Costa Rica), the American Entomological Institute and the Florida State Collection of Arthropods (Florida, USA), the Museo de Insectos of the Universidad Autónoma de Tamaulipas (México) and the Természettudományi Múzeum Állattára (Budapest, Hungary).
The collected material was deposited at the Colección Entomológica de la Universidad de Alicante (Spain) and the Colección Entomológica Regional at the Universidad Autónoma de Yucatán (México).
Data analysis
To assess whether all species at each site were represented in the sample, nonparametric richness estimators were calculated using EstimateS 8.2 (Colwell, 2009); the estimators included ICE (Incidence-based Coverage Estimator), Jackkniffe 1 and ACE (Abundance-based Coverage Estimator), which are well fitted for small samples (Magurran, Reference Magurran2004). The rarefaction curves were built to compare species richness using EcoSim700 (Gotelli & Entsminger, Reference Gotelli and Entsminger2004) with confidence limits of 95%. Then, to test for differences in species composition among seasons, we performed a nonparametric one-way analysis of similarity (ANOSIM), wherein shared species are shown using Venn diagrams.
We ran a Generalized Linear Model (GLM) (McCullagh & Nelder, Reference McCullagh and Nelder1989) to determine the influence of vegetation type, land management and season on species richness and abundance. Three variables were analyzed under the structure of repeated measures: factor 1 (inter-subject) included vegetation type (three levels), factor 2 (inter-subject) included land management (two levels) and factor 3 (intra-subject) included seasons (three levels). Each dependent variable was individually analyzed with a Poisson probabilistic model and a log link function. Differences among levels of factors were analyzed with a Bonferroni pairwise estimation (<0.05). A Wald statistical test, using the maximum likelihood method, was used to evaluate the effects of covariates (vegetation types, land management and seasons) on species abundance and richness. The statistical analysis was run in SPSS 22 for Mac.
The α diversity was measured using the Simpson diversity and Pielou evenness indexes (Zar, Reference Zar1984), which were calculated with 95% confidence intervals obtained by bootstrap resampling using the Species Diversity and Richness software (Henderson & Seaby, Reference Henderson and Seaby2002); the β diversity was described using the Jaccard index of similarity (Magurran, Reference Magurran2004).
The ϒ spatial diversity of the reserve was calculated according to the partition model of diversity. This analysis calculates the contribution of alpha and beta diversities to the gamma or landscape diversity. The relative importance of local species diversity and turnover in each vegetation type and its contribution to the total ϒ diversity of RBRL were analyzed using the additive partition model of diversity, which permits the evaluation of significant differences between diversity levels and identification of the principal components of diversity contributing to the total diversity. We estimated the partition of ϒ diversity (Crist et al., Reference Crist, Veech, Summerville and Gering2003) as follows: ϒ = αs + βs + βz + βv, where ϒ is the total species richness recorded in the RBRL, partitioned in average richness within sites (αs), among sites within management zones (βs), among management zones (βz) and among vegetation types (βv). We evaluated whether the observed partitions could have been obtained by a random allocation of individuals using 10,000 individual-based randomizations with PARTITION software (Veech & Crist, Reference Veech and Crist2009).
To analyze the relationship among ten guilds of parasitoids and vegetation type and seasons, we ran a Redundancy analysis (RDA, Legendre & Legendre, Reference Legendre and Legendre1998), which was selected over Canonical Correspondence Analysis because of the reduced length of the gradient of our variables (Ter Braak & Smilauer, Reference Ter Braak and Smilauer2002). The length of gradients was calculated using detrended correspondence analysis (Hill, Reference Hill1979). The significances of each guild of parasitoid and seasonality were treated as dummy variables, as well as the first axis and all axes, which were tested within the forward selection procedure using a Monte Carlo random permutation test (499 permutations, P ≤ 0.05). The analysis was performed using Canoco 4.5 (Ter Braak & Smilauer, Reference Ter Braak and Smilauer2002). The trophic guilds followed the classification of Mazon & Bordera (Reference Mazon and Bordera2014), who recognized ten guilds of parasitoids belonging to Ichneumonidae family, and based on the classification criteria from Garbarczyk & Sawoniewicz (Reference Garbarczyk and Sawoniewicz1984), to define the trophic level membership of their hosts and food specialization:
Coc: parasitoids of cocoons and pupae.
cPh: parasitoids of concealed phytophagous larvae feeding inside above-ground plant parts, such as leaf rollers, leaf folders, gall formers and leaf miners.
gPh: parasitoids of exposed phytophagous larvae feeding on the external parts of plants, such as leaves, stems, flowers and buds.
Mel: parasitoids of melitophagous larvae of bees that feed on stores of honeydew, nectar and pollen and wasp larvae living in nests.
Myc: parasitoids of larvae living in the fruiting bodies of mushrooms and bracket fungi.
Poly: polyphagous parasitoids whose host range include two or more arthropod orders with different trophic habits.
Sap: parasitoids of saprophagous larvae.
Unkn: unknown parasitoids whose hosts remain unknown.
Xyl: parasitoids of xylophagous larvae, excluding those feeding in dead but not decomposing wood.
Zoo: parasitoids of zoophagous larvae and spiders.
Results
A total of 6686 individuals representing 18 subfamilies, 113 genera and 336 species were captured during the study period. The ICE richness estimator predicted a higher maximum number of species of 475 in the RBRL, while the ACE estimator predicted 473 species. Thus, according to both estimators, the species inventory was approximately 71% complete. Below, we describe the influence of vegetation type, land management and seasonality on Ichneumonidae diversity.
Evidence from vegetation type
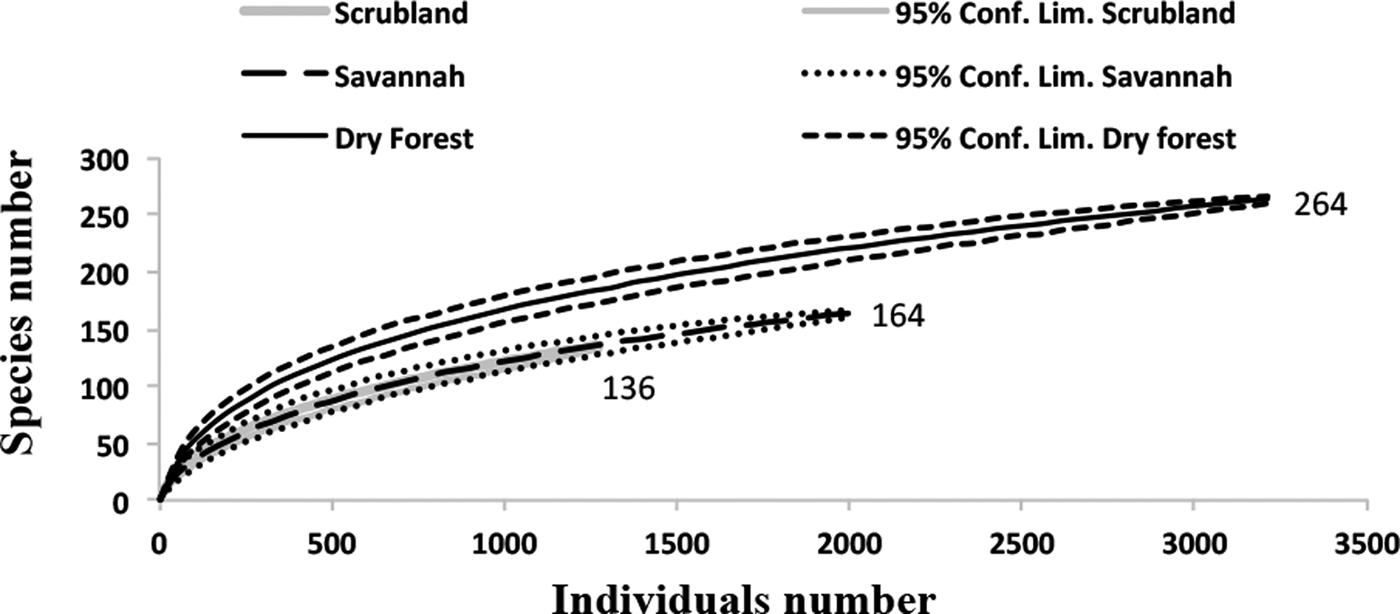
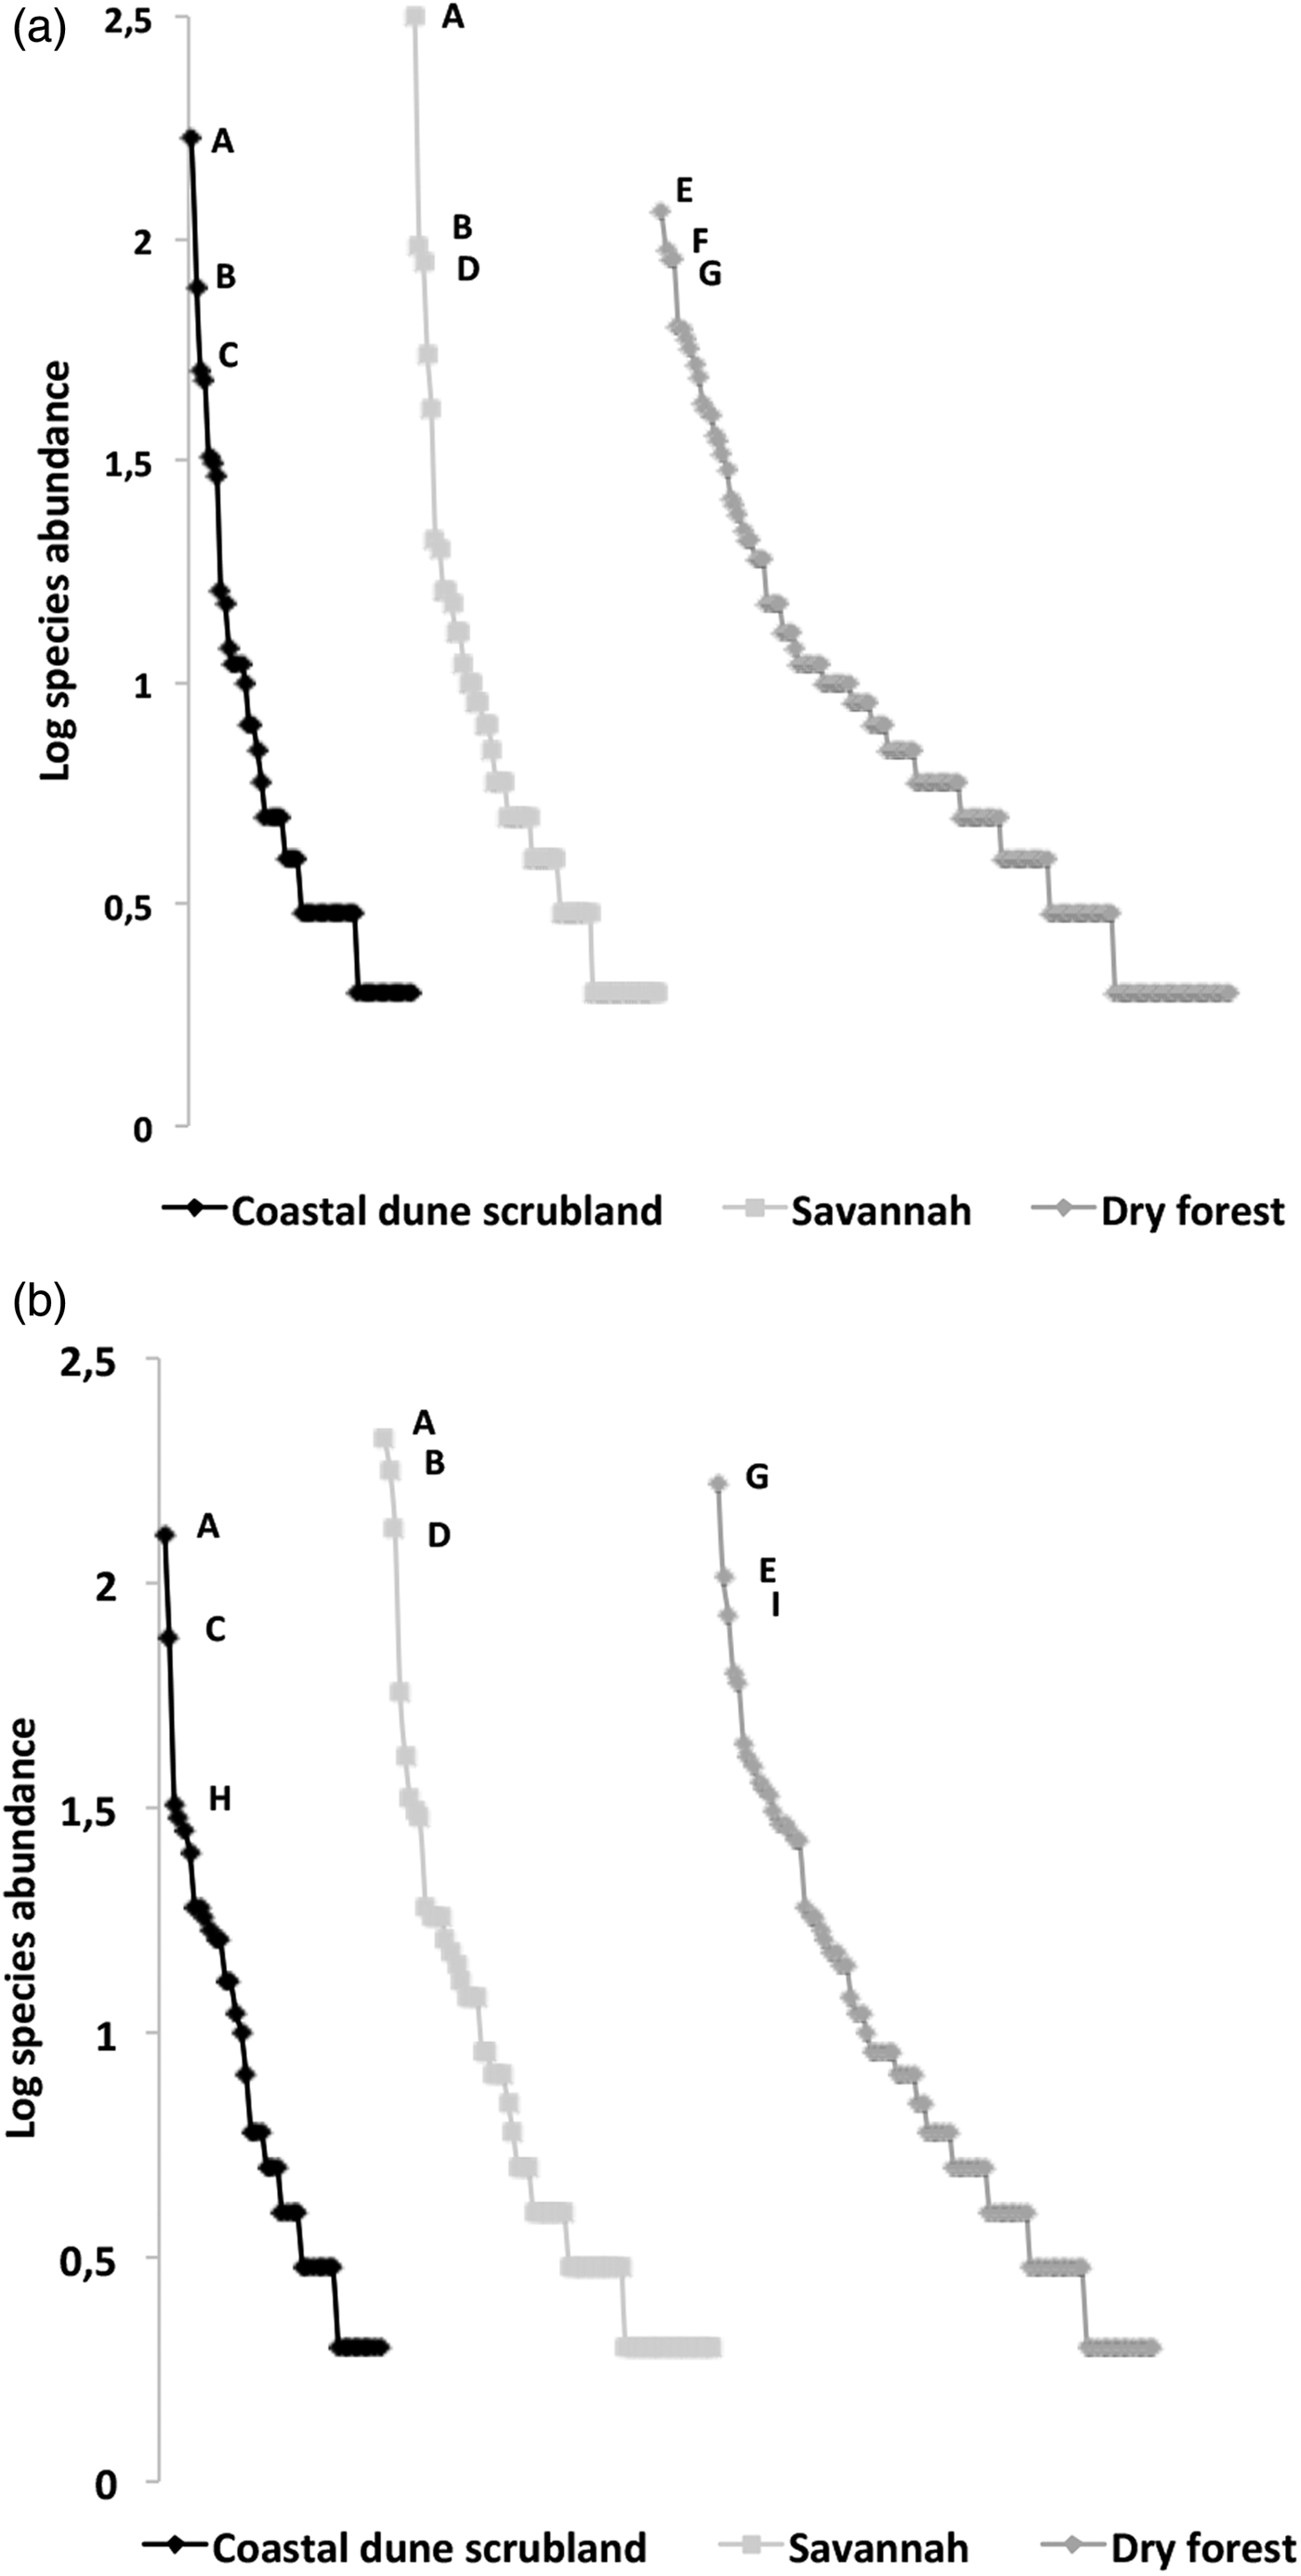
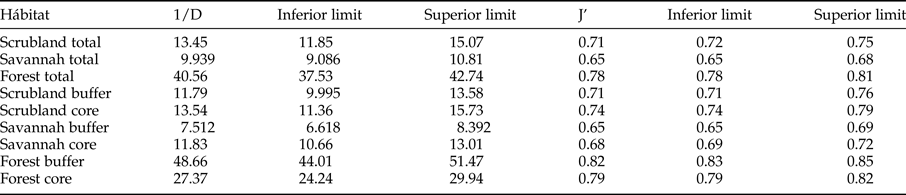
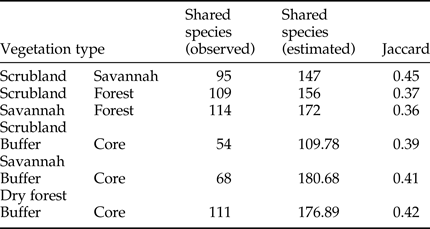
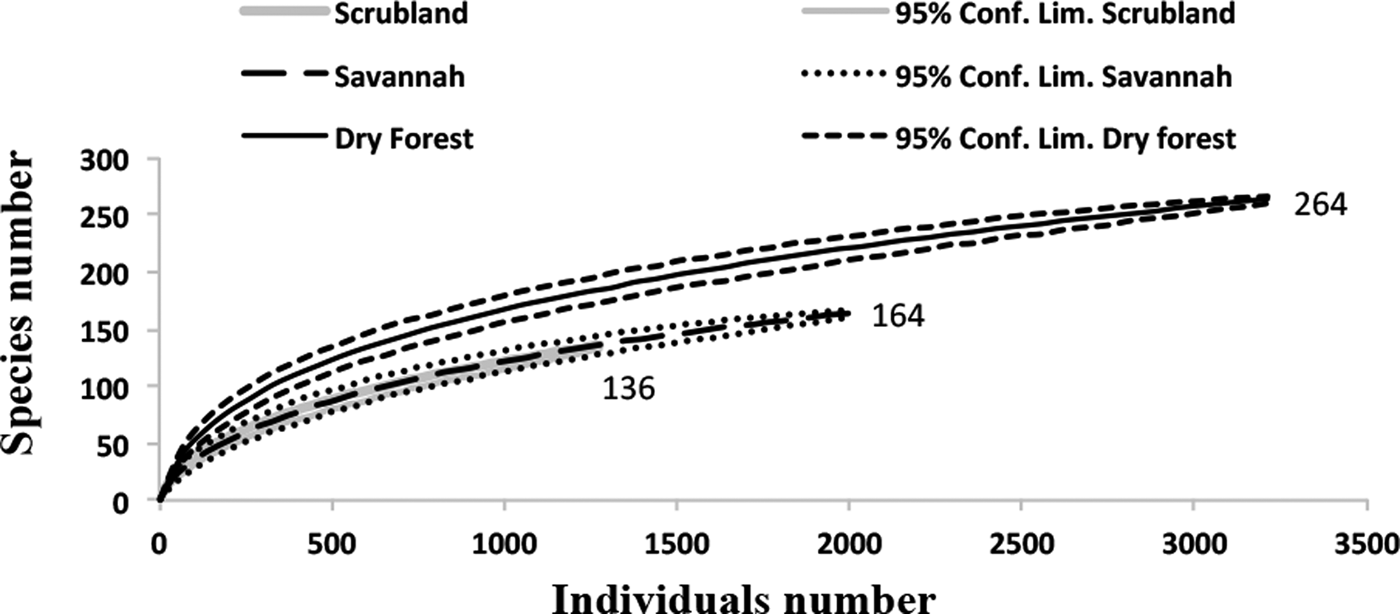
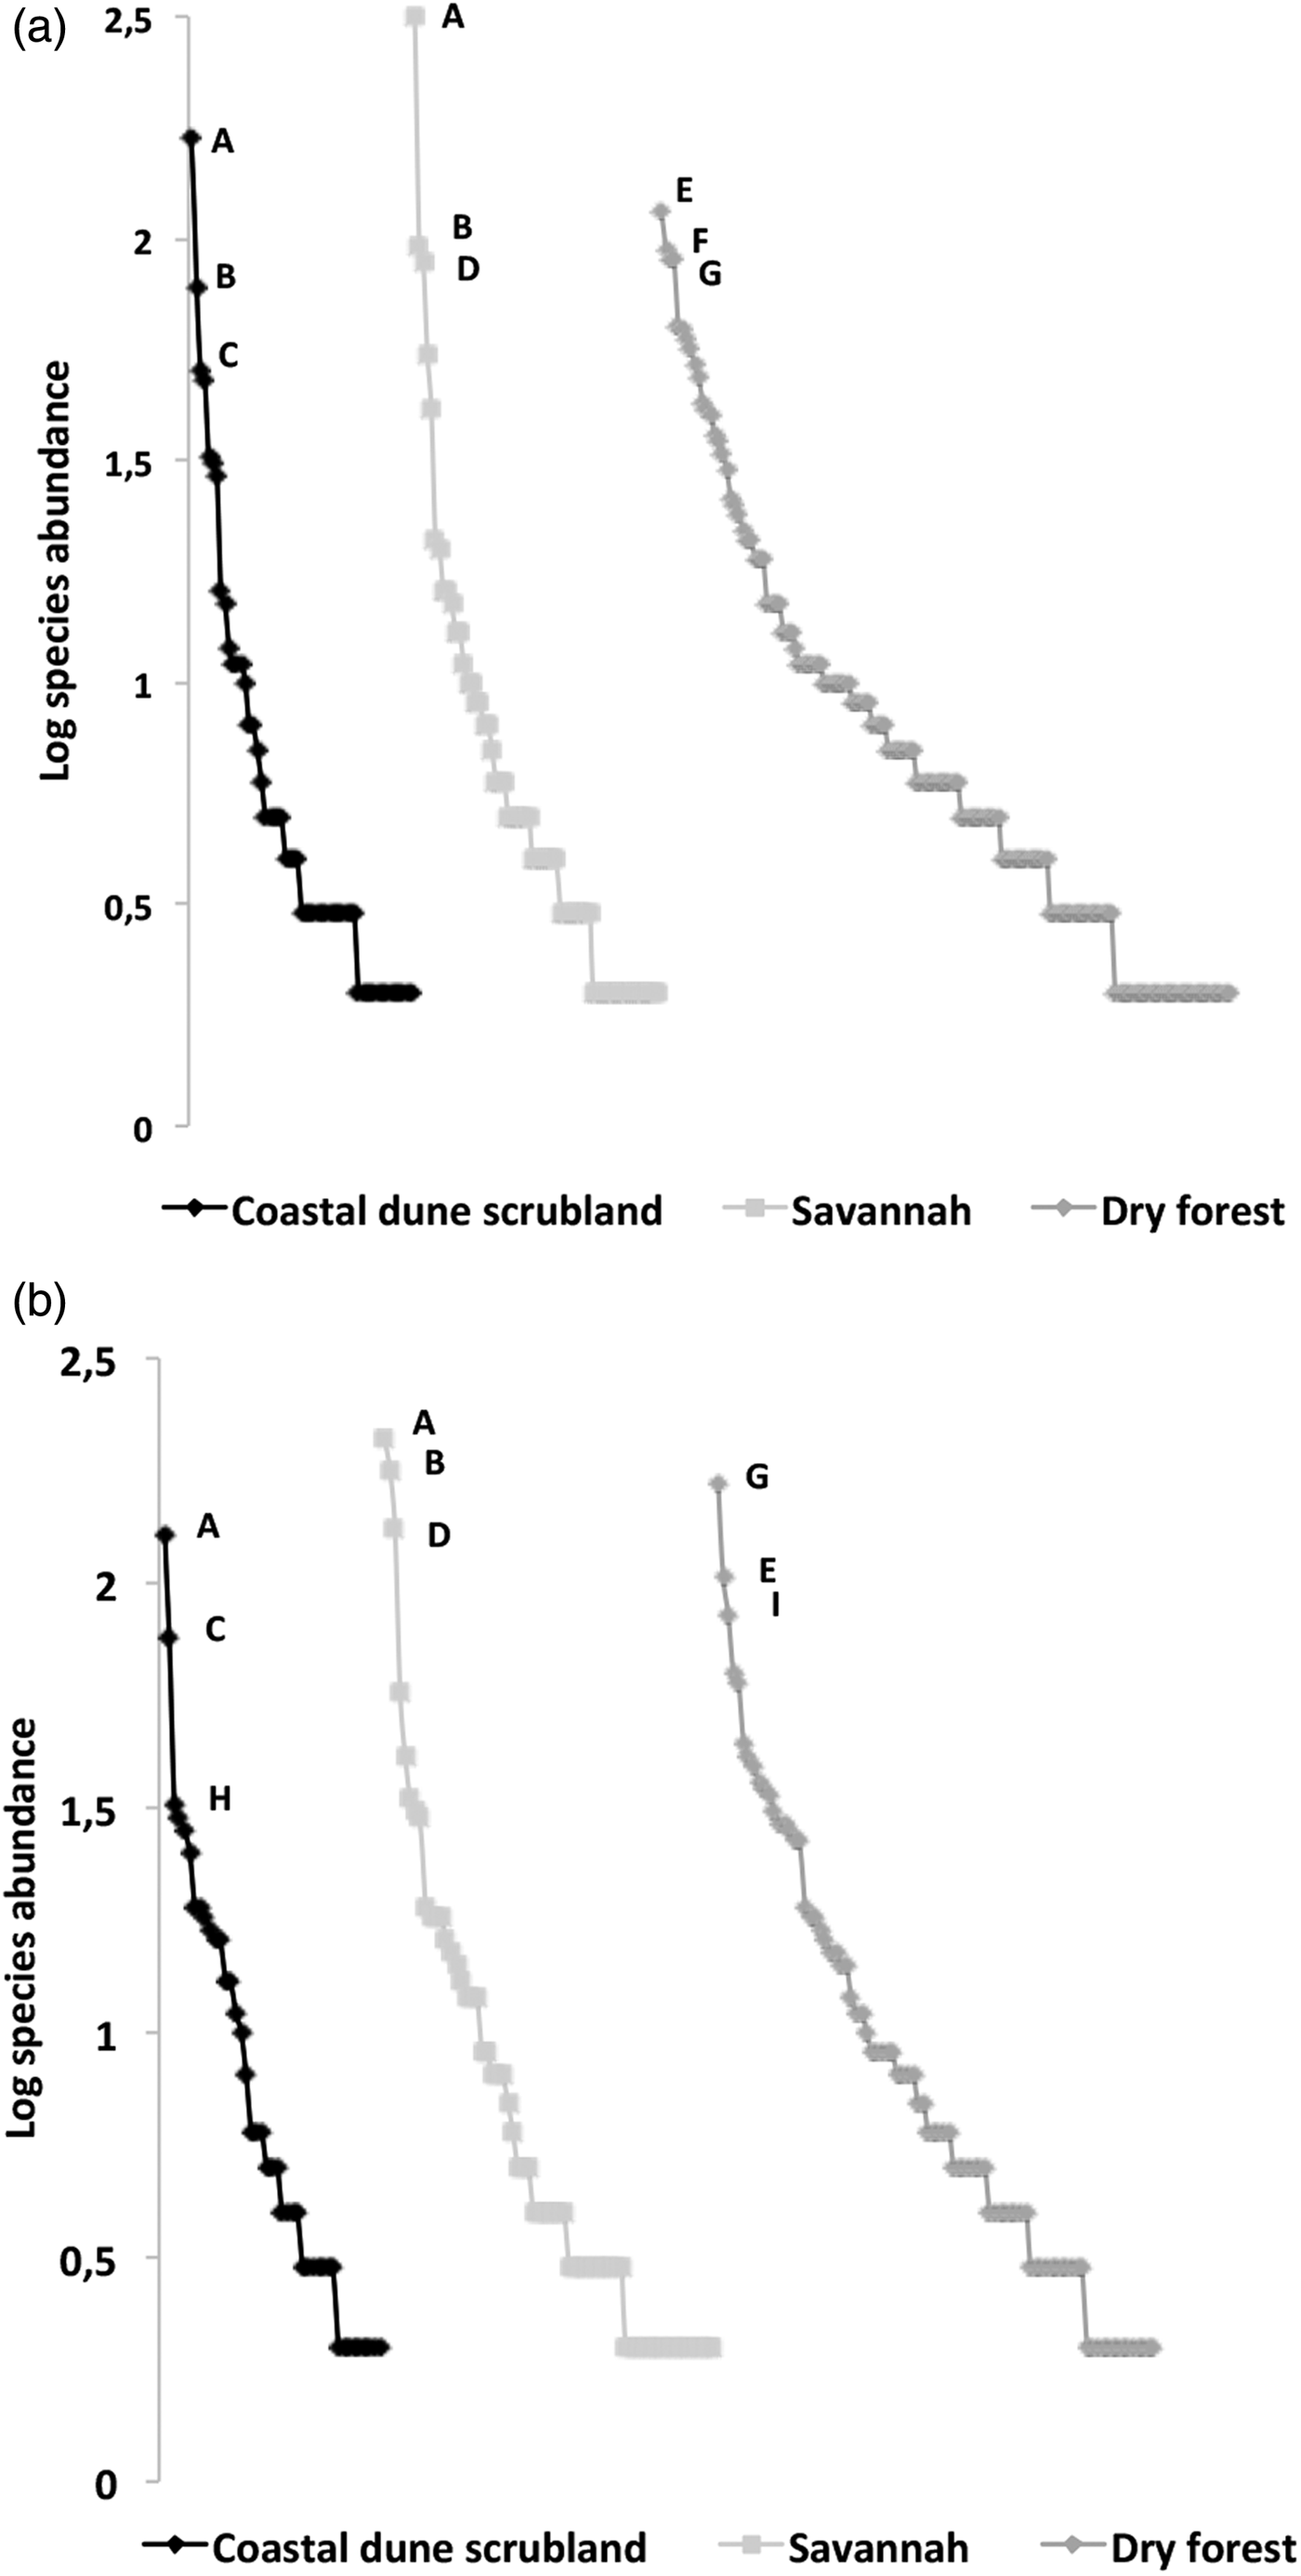
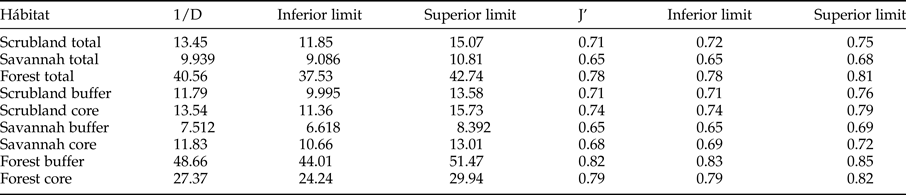
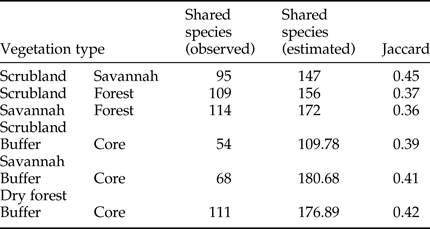
The rarefaction expected richness of 1321 individuals per vegetation type indicated a significantly higher cumulative richness in the dry forest (with 264 species) than in the savannah and coastal dune scrubland (with 164 and 136 species, respectively) (fig. 1). The species composition changed among vegetation types (fig. 2); in the savannah and in the coastal dune scrubland, the most abundant species was Microcharops anticarsiae, and in the dry forest, two species were dominant, Agonocryptus chichimecus and Camera euryaspis. We found the highest α diversity in the dry forest, followed by scrubland and savannah (Table 1). Few species were shared among all vegetation types (Table 2), reflecting high β diversity in the RBRL; the scrubland and savannah were the vegetation types with the highest similarity.
Rarefaction curves of the Ichneumonidae in the three vegetation types in the RBRL for species collected in the Malaise traps. The richness is indicated at the end of each line. The standardized sampling effort was 1321, which the smallest number of individuals found in any vegetation type. The rarefaction curves exhibited higher species richness in the dry forest (264 species) compared to the savannah (164 species) and coastal dune scrubland (136 species).
Rank–abundance plots of ichneumonid ensembles collected from the three vegetation types in the RBRL: (a) buffer zone and (b) core zone. A logarithmic scale of abundance was plotted against the species-rank ordered by species, from those with the most abundant individuals to those with the fewest. The species codes were as follows (only the three most abundant): A, Microcharops anticarsiae; B, Eiphosoma dentator; C, Xiphosomella roxana D, X. ozne; E, Agonocryptus chichimecus; F, Baltazaria crassicornis; G, Camera euryaspis; H, Casinaria sp.; I, Baltazaria rufonotata.
Simpson Diversity (1/D) and Pielou evenness (J’) according to the 95% confidence limits obtained by bootstrapping.
Qualitative similarity species index.
Evidence from land management
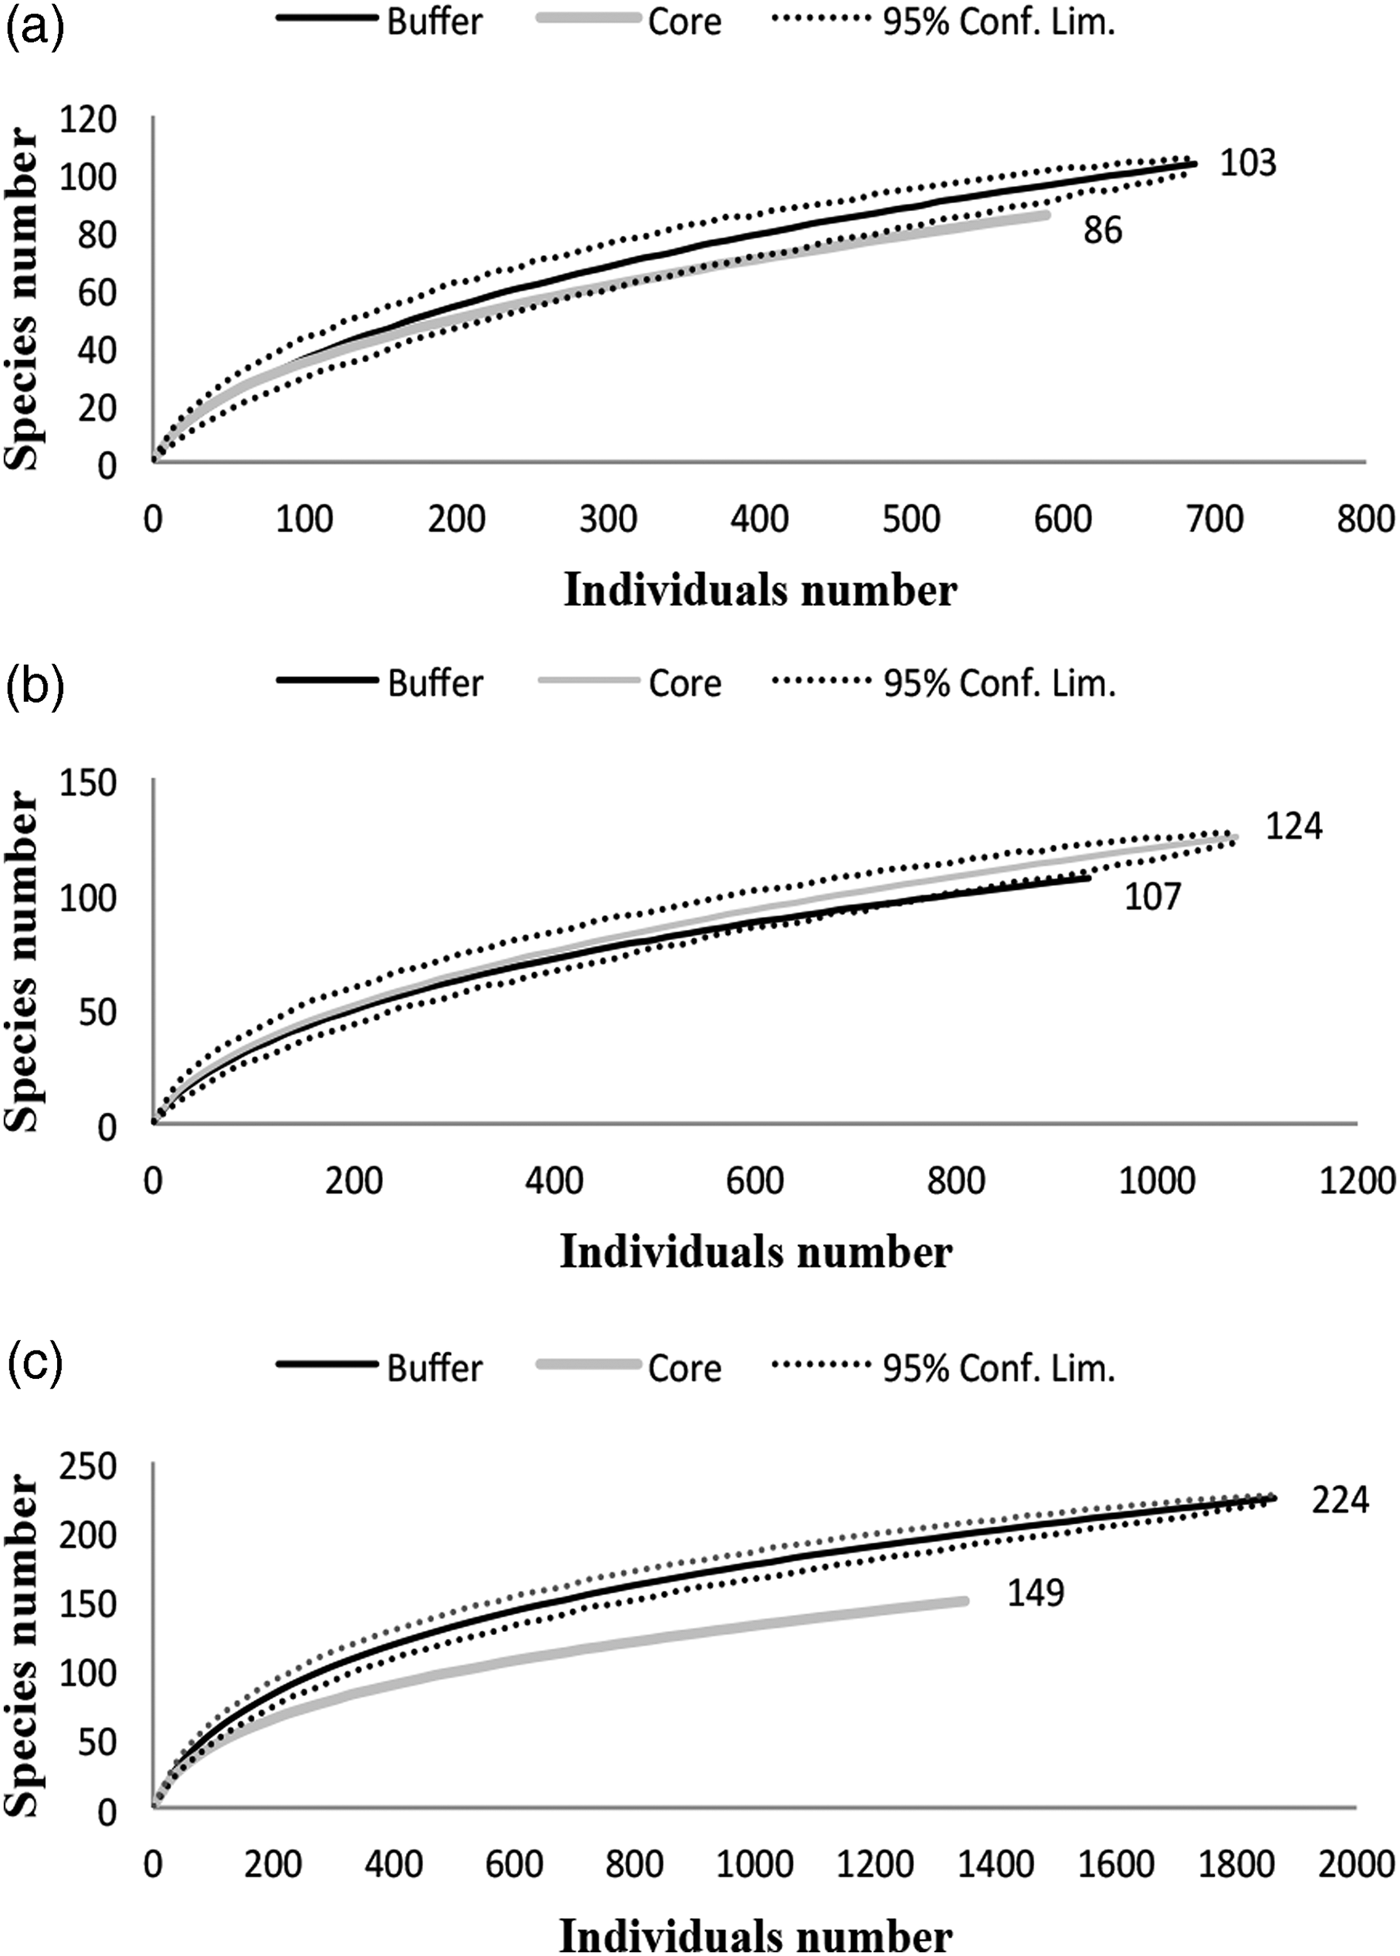
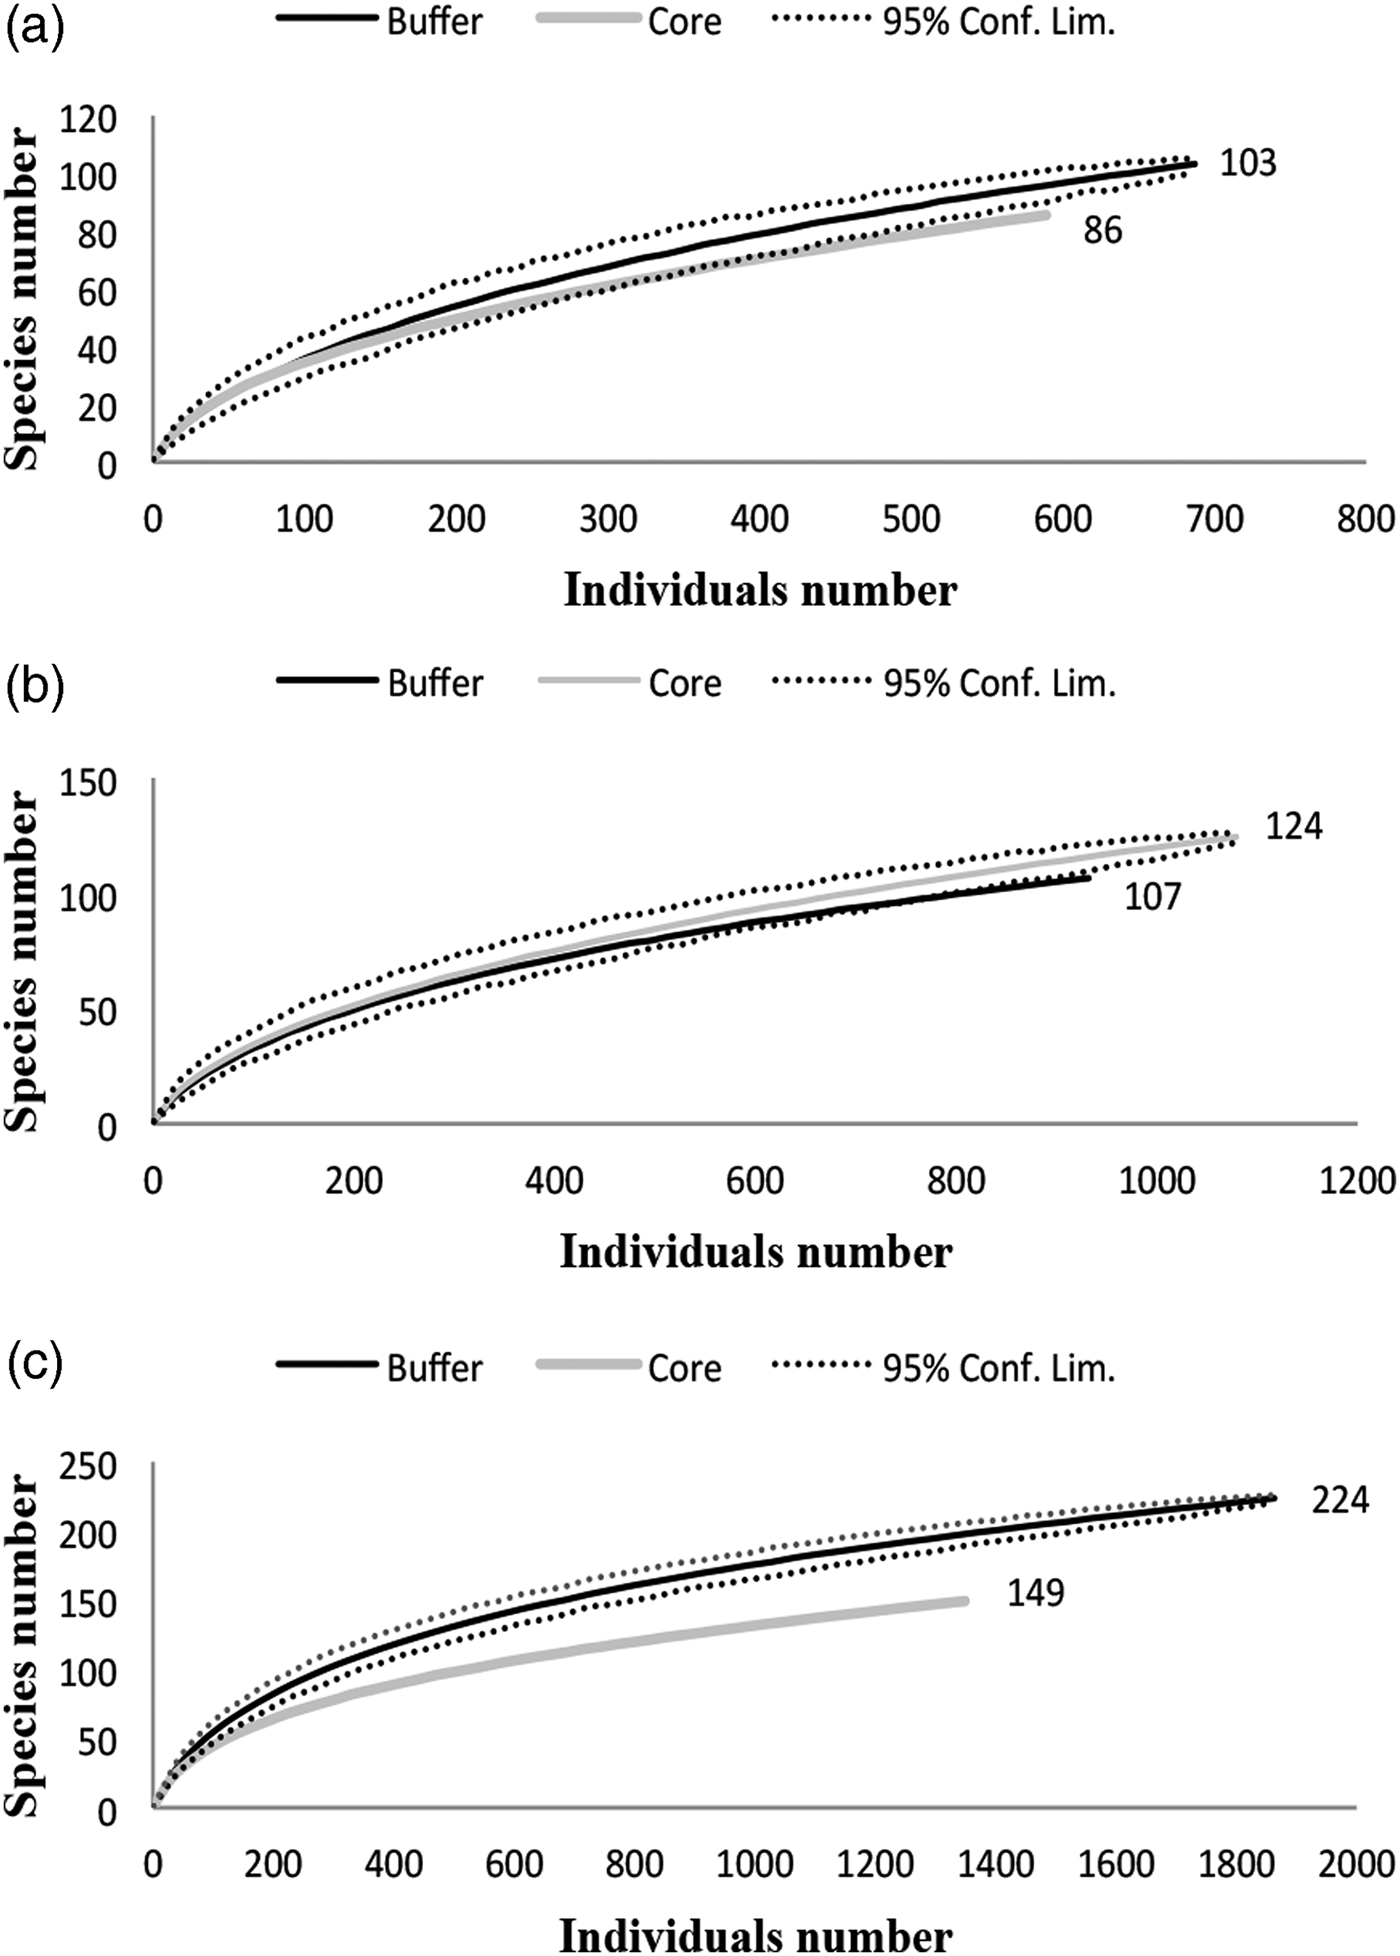
A comparison of species richness among management policies for each vegetation type revealed differences only in the dry forest; scrublands and savannahs exhibited no differences between the buffer and core zones (fig. 3). However, species composition differed according to land management only in the dry forest; the dominant species was Agonocryptus chichimecus in the buffer zone and Camera euryaspis in core zone (fig. 3). In the savannah and dry forests, the α diversity was different between the conservation status zones (Table 1). The highest species shift was observed between the buffer and core zones in the scrubland (Table 2).
Rarefaction curves of both conservation status types under three vegetation types: (a) Scrubland, (b) Savannah and (c) Dry forest.
Partition diversity at the landscape level
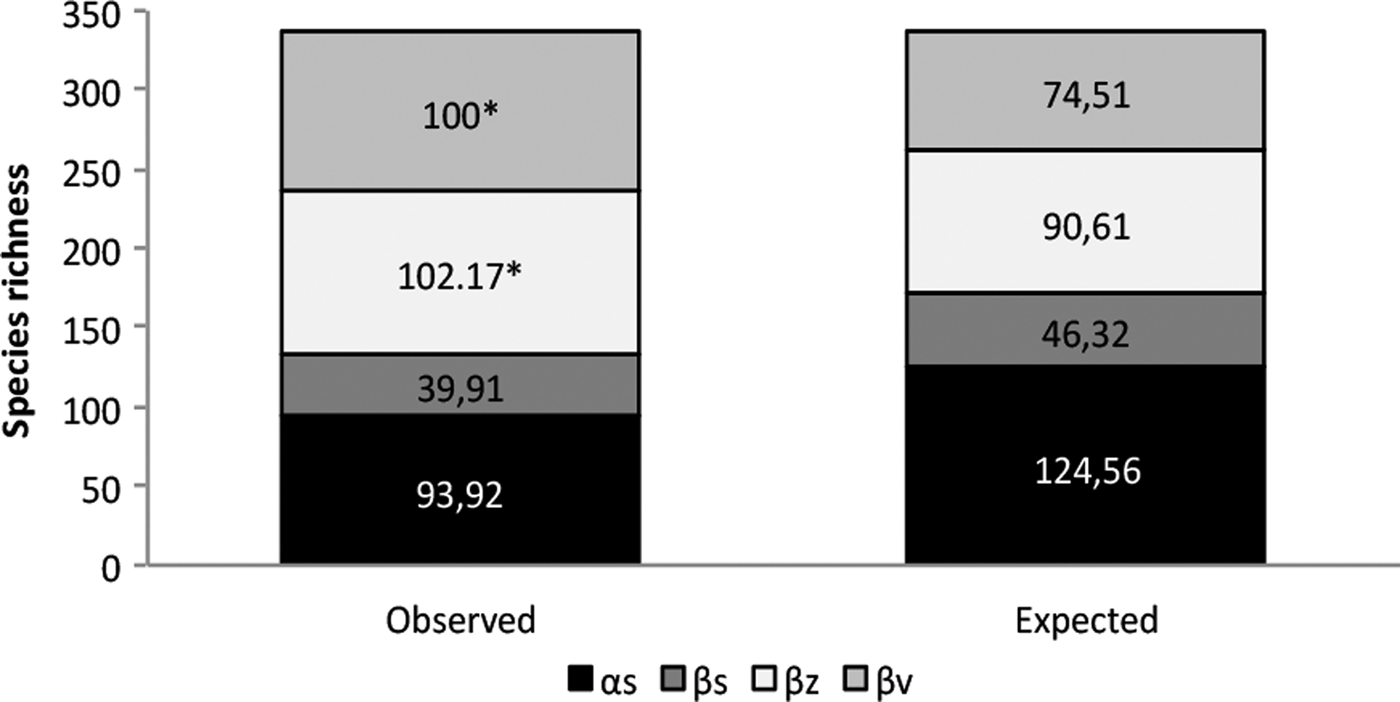
The gamma diversity in the RBRL was 336. This regional diversity was more influenced by species turnover among management zones (βz = 102.17 species) and among vegetation types (βv = 100 species) than among sites (βs = 39.91 species) and species richness within sites (αs = 93.92 species); all of these values (βz, βv, βs, αs) were equivalent to 30, 30, 12 and 28% of the contribution to the total richness (336), respectively. However, the only turnover among management zones (βz) and among vegetation types (βv) exhibited higher diversity than expected for a random distribution (P < 0.001). The other values, (αs) and (βs) did not differ significantly from the random distribution (fig. 4).
Spatial additive partitioning of Ichneumonidae species richness at four levels: within sites (αs), among sites within management zones (βs), among management zones (βz), and among vegetation types (βv). Asterisks indicate statistical significance (P = 0.001) based on 10,000 randomizations.

Evidence from seasonality
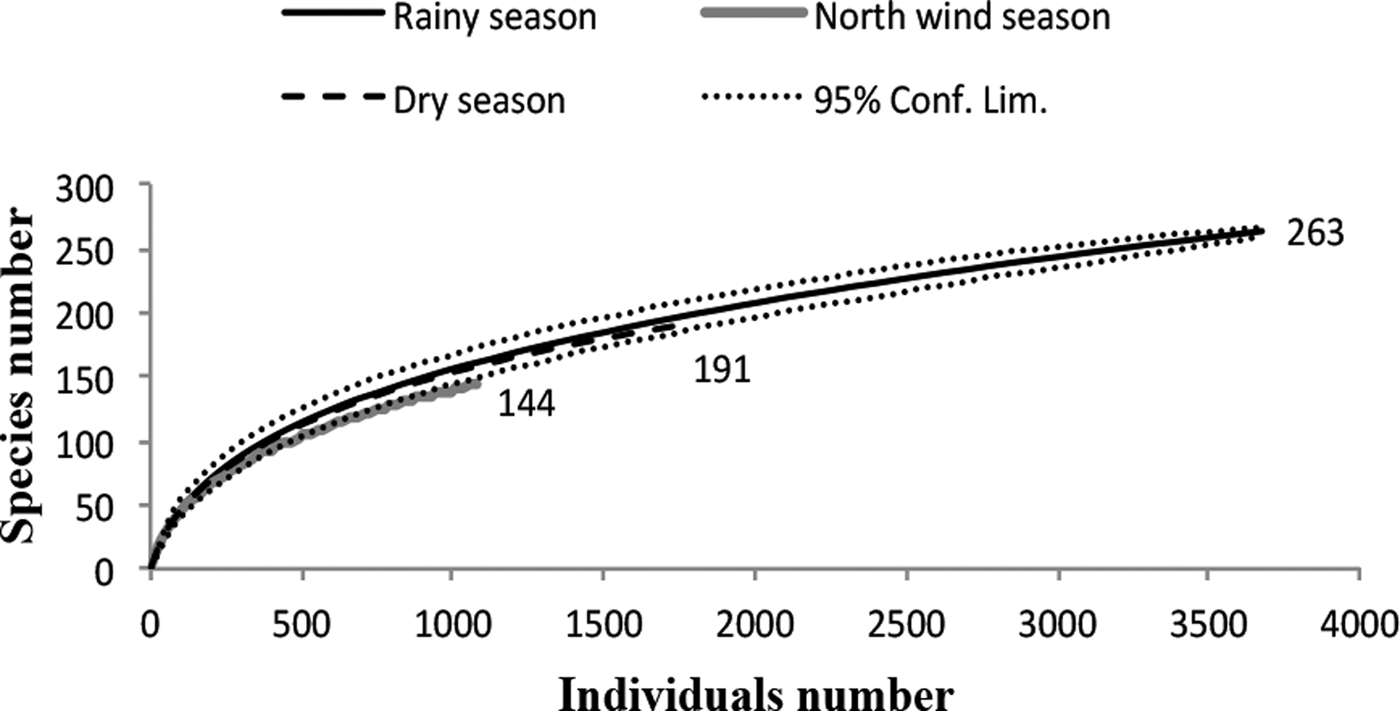
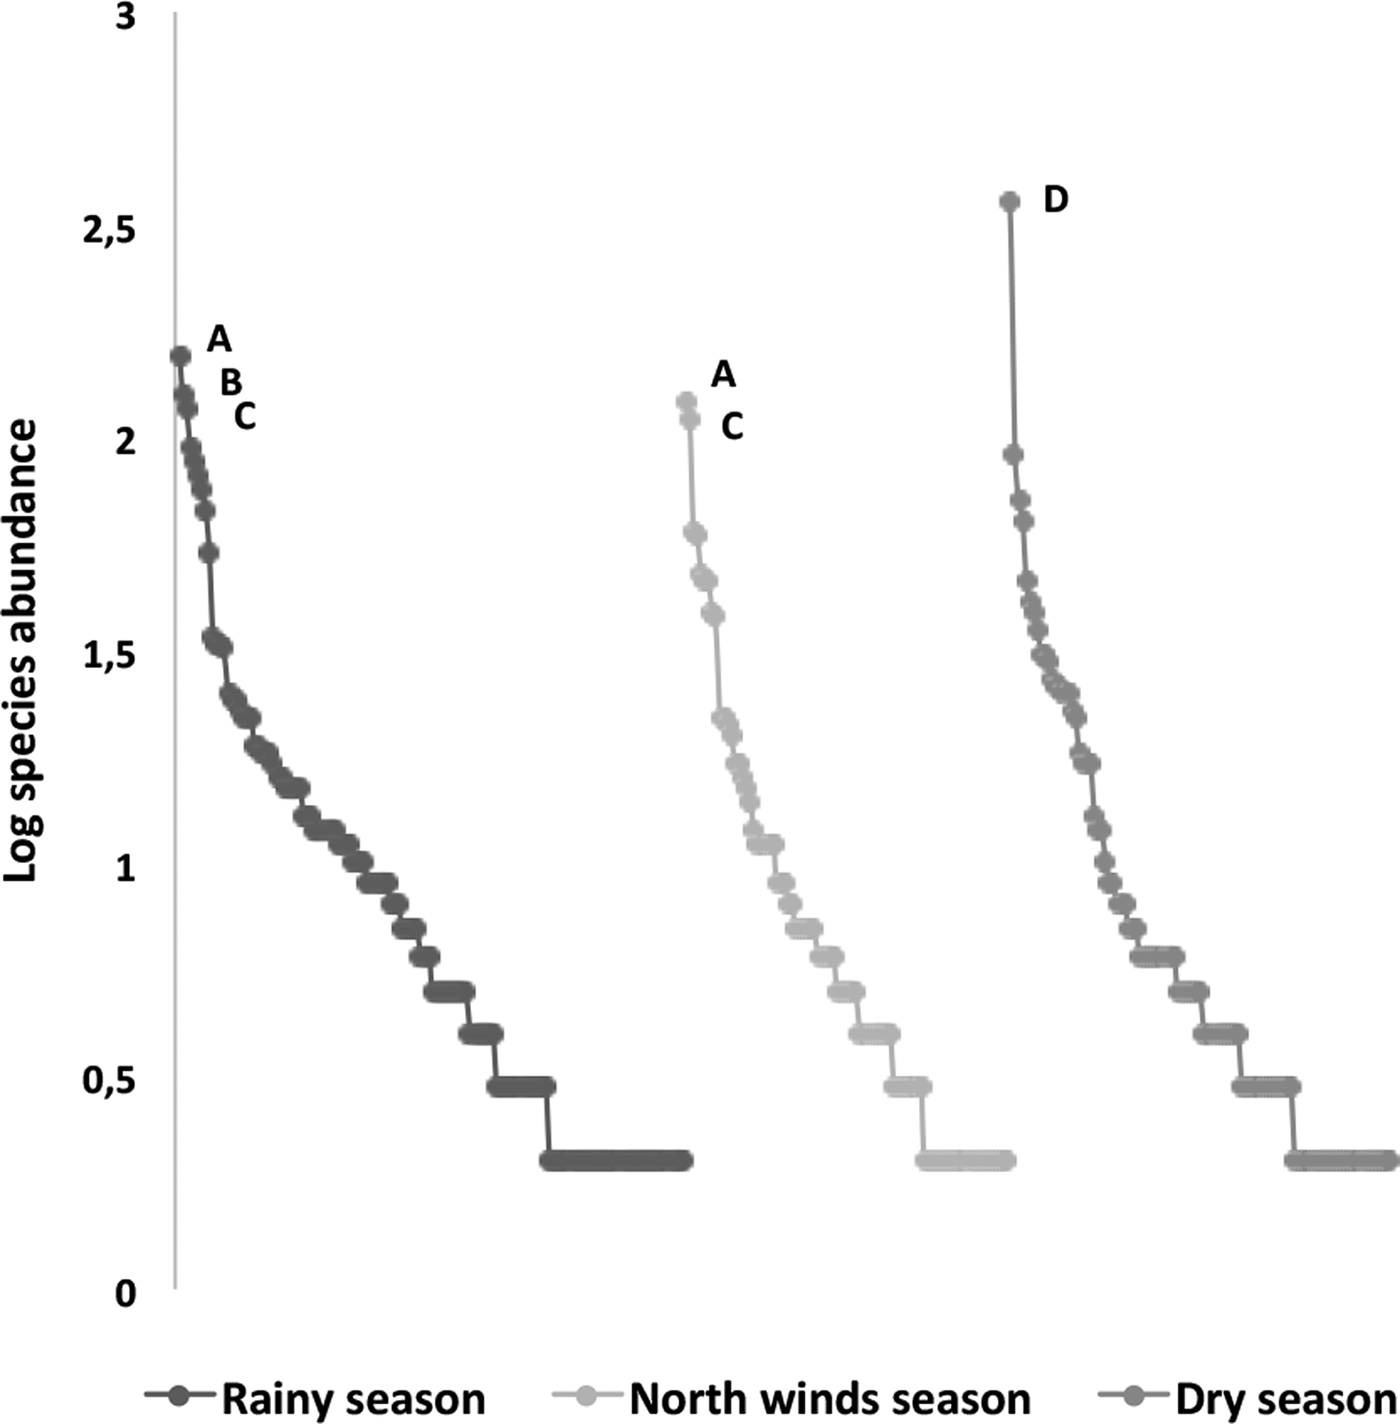
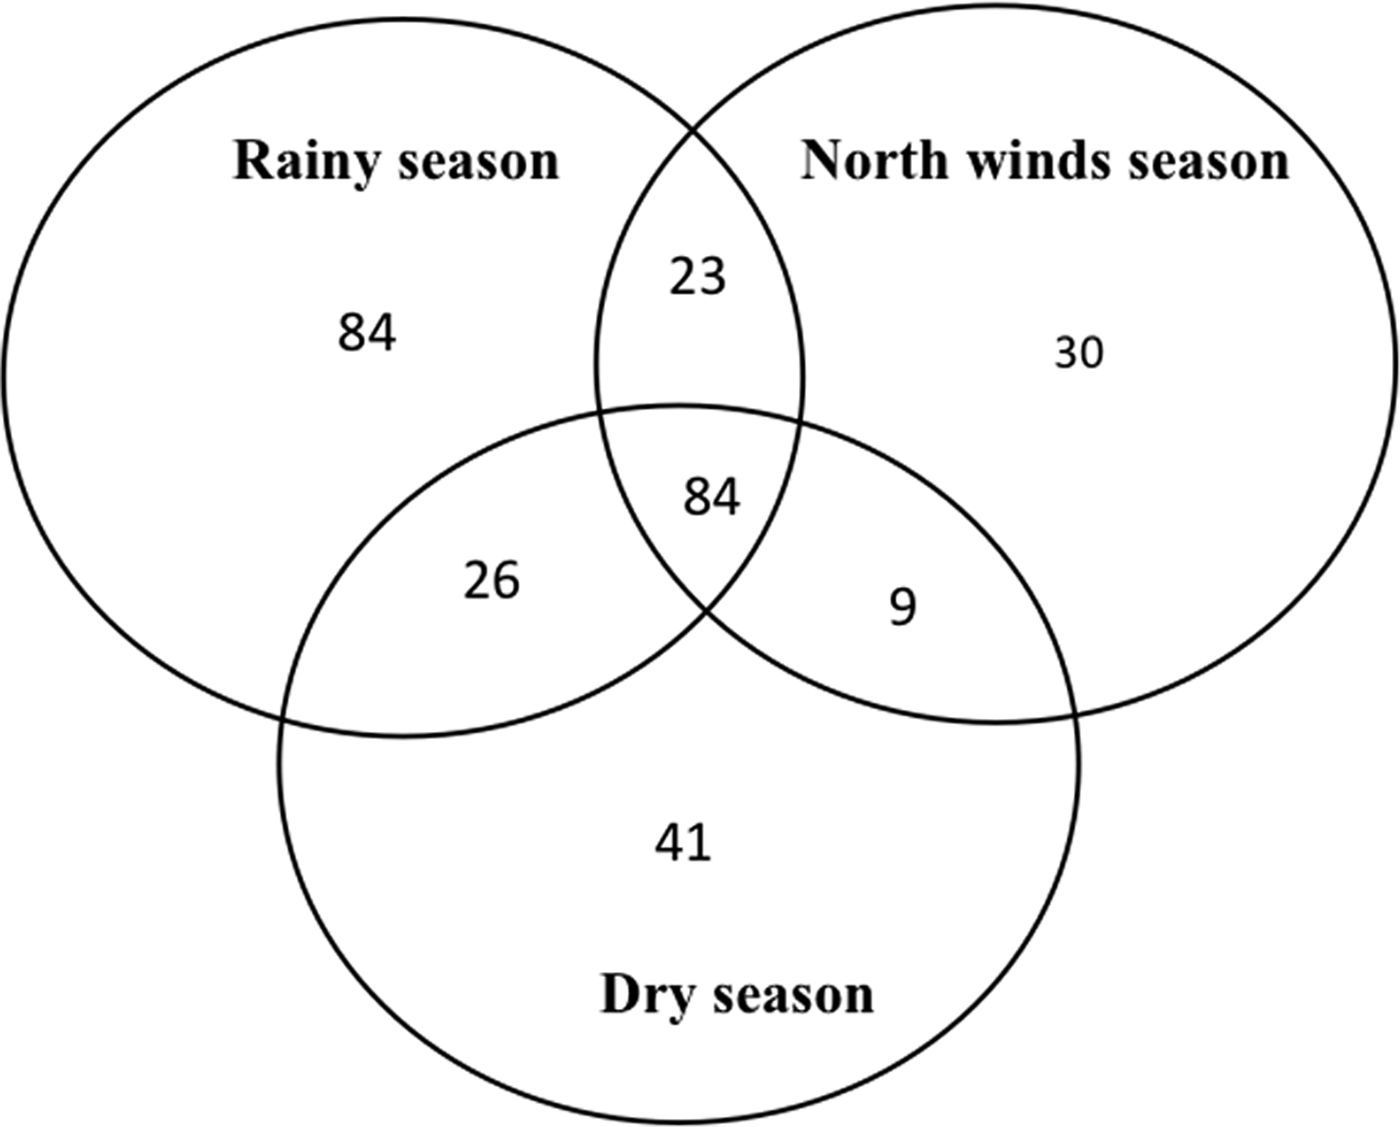
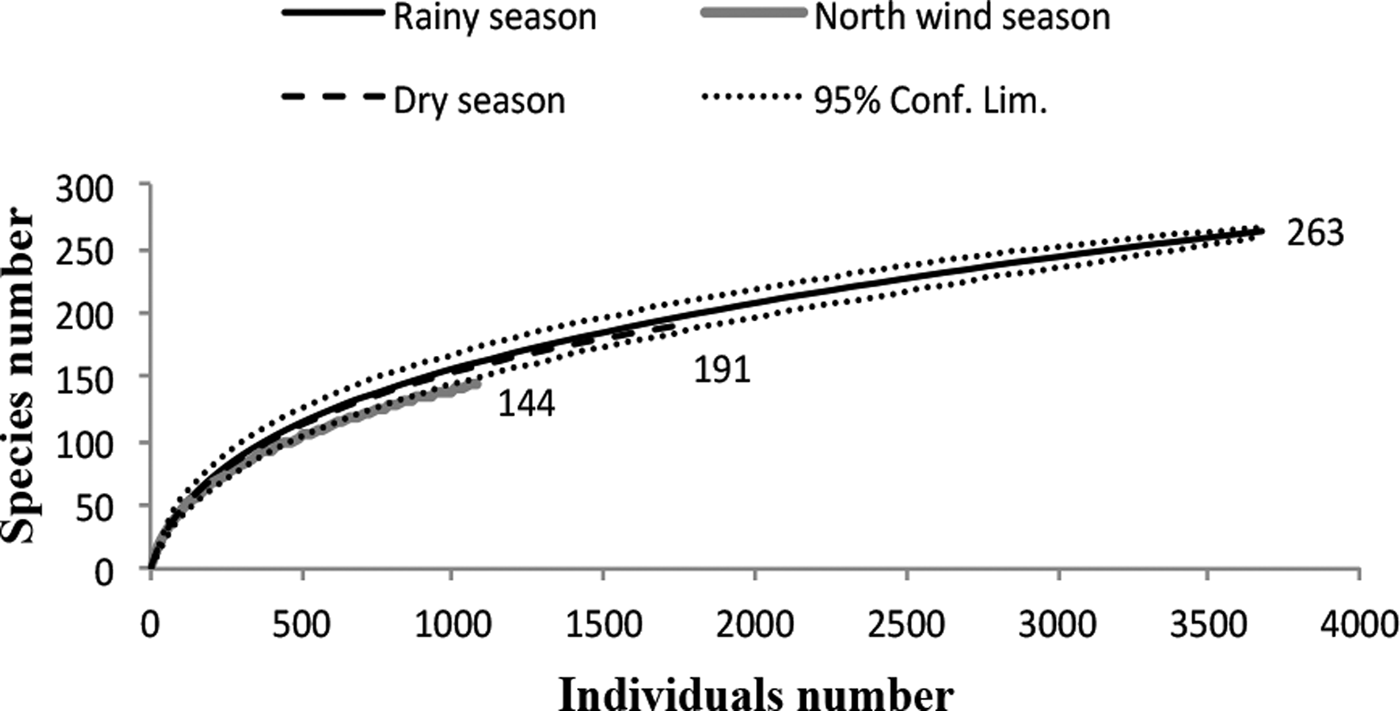
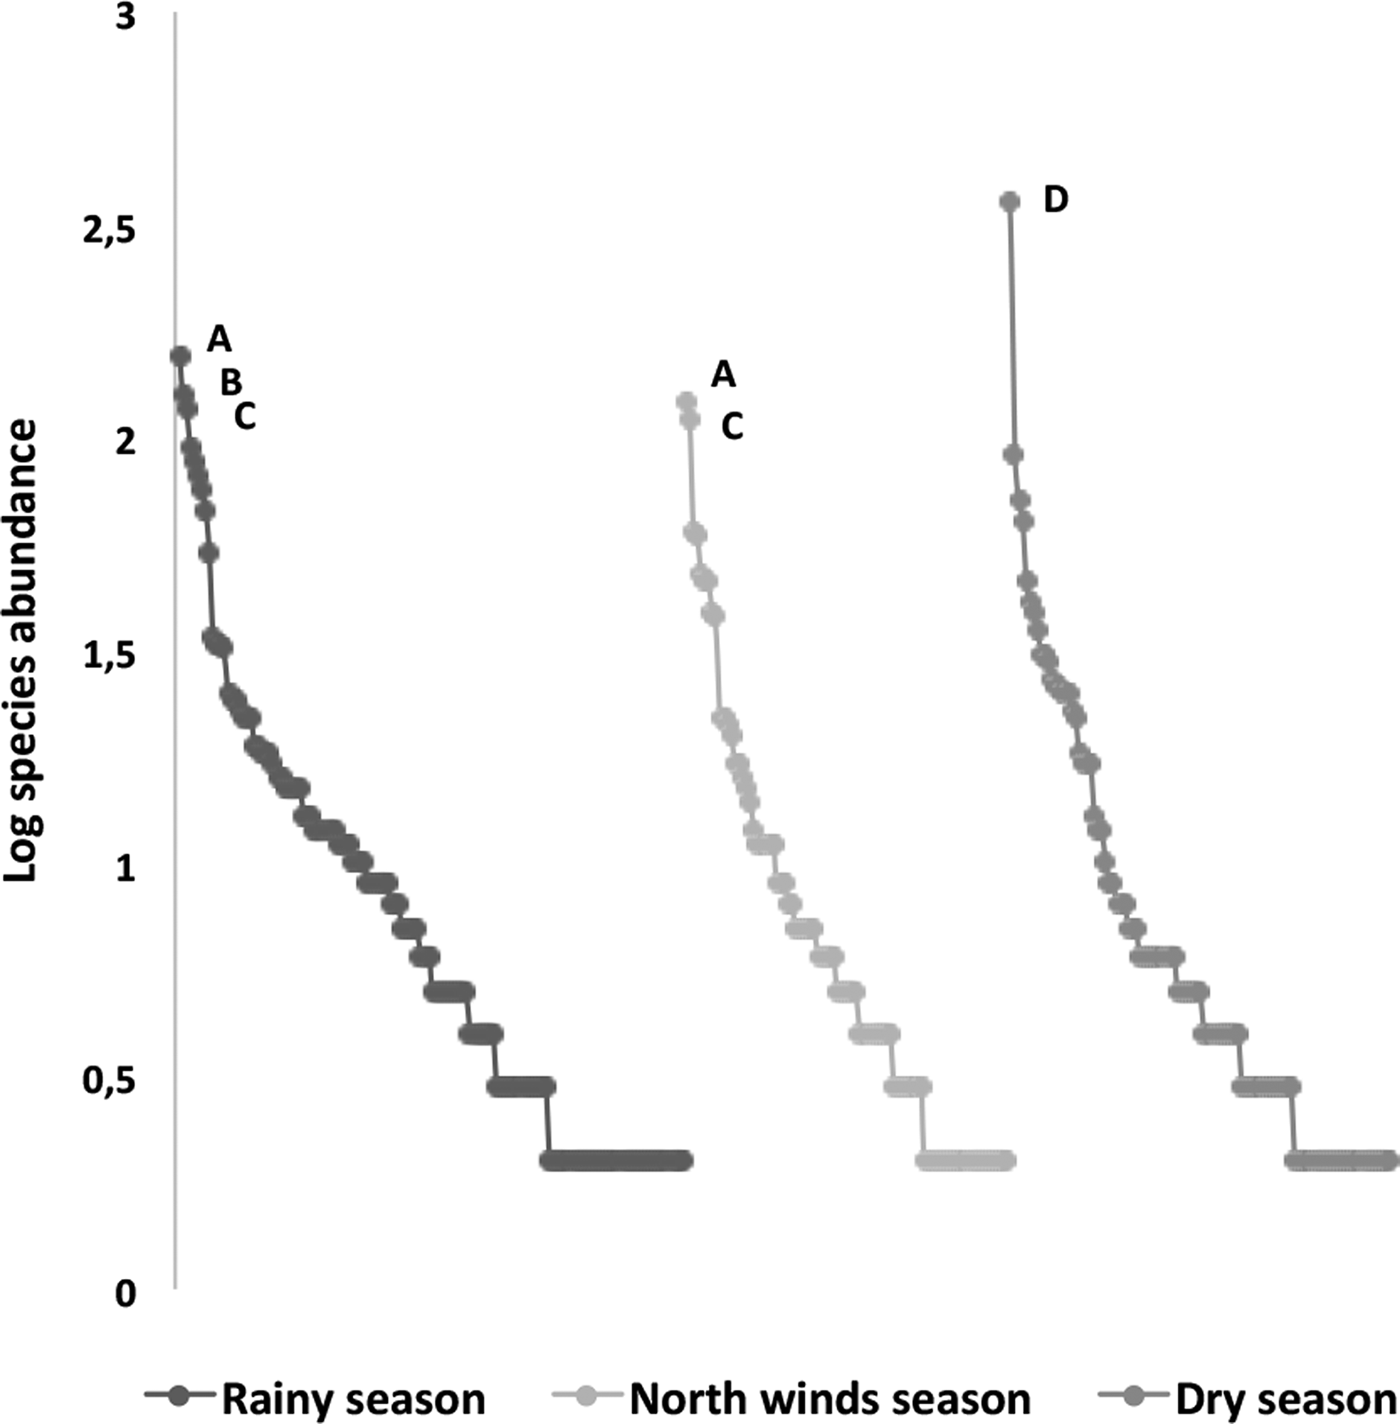
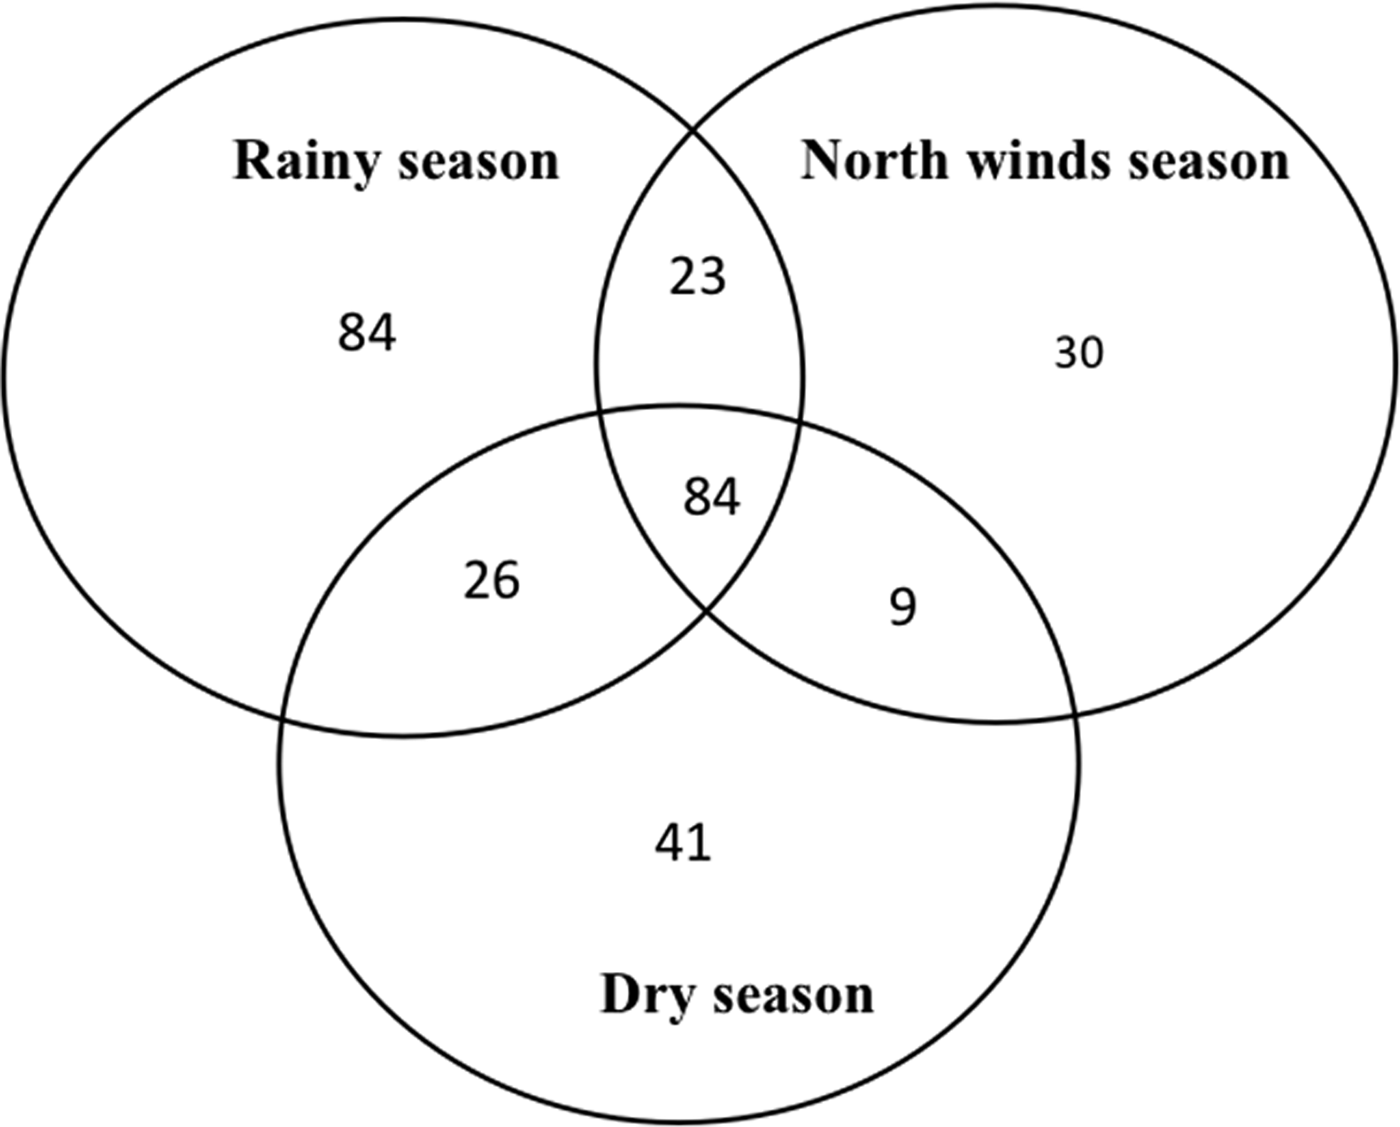
The species richness was similar among the three sampled seasons (fig. 5). During the rainy season, the ensembles were more ‘heterogeneous’, with several species having similar abundance; in contrast, during the north-winds and dry seasons, only two and one dominant species were found, respectively (fig. 6). The α diversity differed among seasons, with greater diversity in the north-winds and rainy seasons than in the dry season (Table 3). The species composition was different among seasons (ANOSIM: R = 0.7124; P = < 0.0001), with only approximately 1/3 of species shared among all three seasons (fig. 7).
Rarefaction curves for Ichneumonidae during the three seasons for the species collected in the Malaise traps, whose richness values are indicated at the end of each line. The standardized sampling effort was 1110, which is the smallest number of individuals found in any vegetation type. Rarefaction curves indicate similar species richness during the rainy season (263 species), dry season (191 species) and north-winds season (144 species).
Rank–abundance plots of ichneumonid ensembles collected throughout the year during three seasons (rainy, north-winds and dry); a logarithmic scale of abundance was plotted against the species-rank ordered by species with the most individuals to those with the fewest. Species codes include only the most abundant: A, Agonocryptus chichimecus; B, Eiphosoma dentator; C, Xiphosomella ozne; and D, Microcharops anticarsiae.
Venn diagrams representing shared species of Ichneumonidae among seasons in the RBRL.
Simpson Diversity (1/D) and Pielou evenness (J’) according to the 95% confidence limits obtained by bootstrapping in the three seasons.

Interactive effects of vegetation type, land management and seasonality
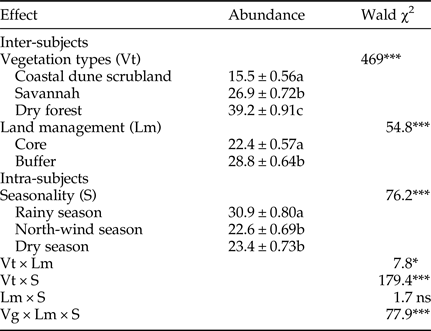
We found significant influences of vegetation type, land management and season on the abundance of parasitoids, including almost all of the interaction effects (Table 4). Of the three vegetation types, the dry forest had the highest abundance. Furthermore, in terms of land management, the parasitoid abundance was higher in the buffer zone than in the core zone. Finally, we found a higher parasitoid abundance during the rainy season than during the north-winds and dry seasons. We observed that the species abundance was higher in the buffer zone than in the core zone. Surprisingly, when we analyzed the interaction types of vegetation × season, we uncovered a different pattern; parasitoid abundance was higher in the rainy season in the coastal dune scrubland and the dry forest, but was the lowest in savannah vegetation. The interaction of vegetation type × land management × season was statistically significant, reflecting a cross-effect of factors and a differential magnitude of effects relative to the three factors. In other words, parasitoid abundance increased in almost only one direction: higher abundance in the dry forest, buffer zone and rainy season.
Generalized linear model for the abundance of parasitoids among vegetation types, management zones and seasonality.
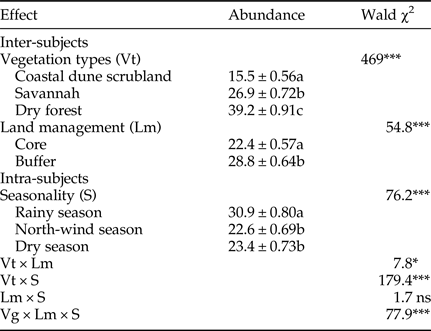
Different letters indicate significant differences (Bonferroni < 0.05). ns, no significant; *P < 0.05; **P < 0.01; ***P < 0.001.
Guilds of parasitoids, vegetation type and seasonality
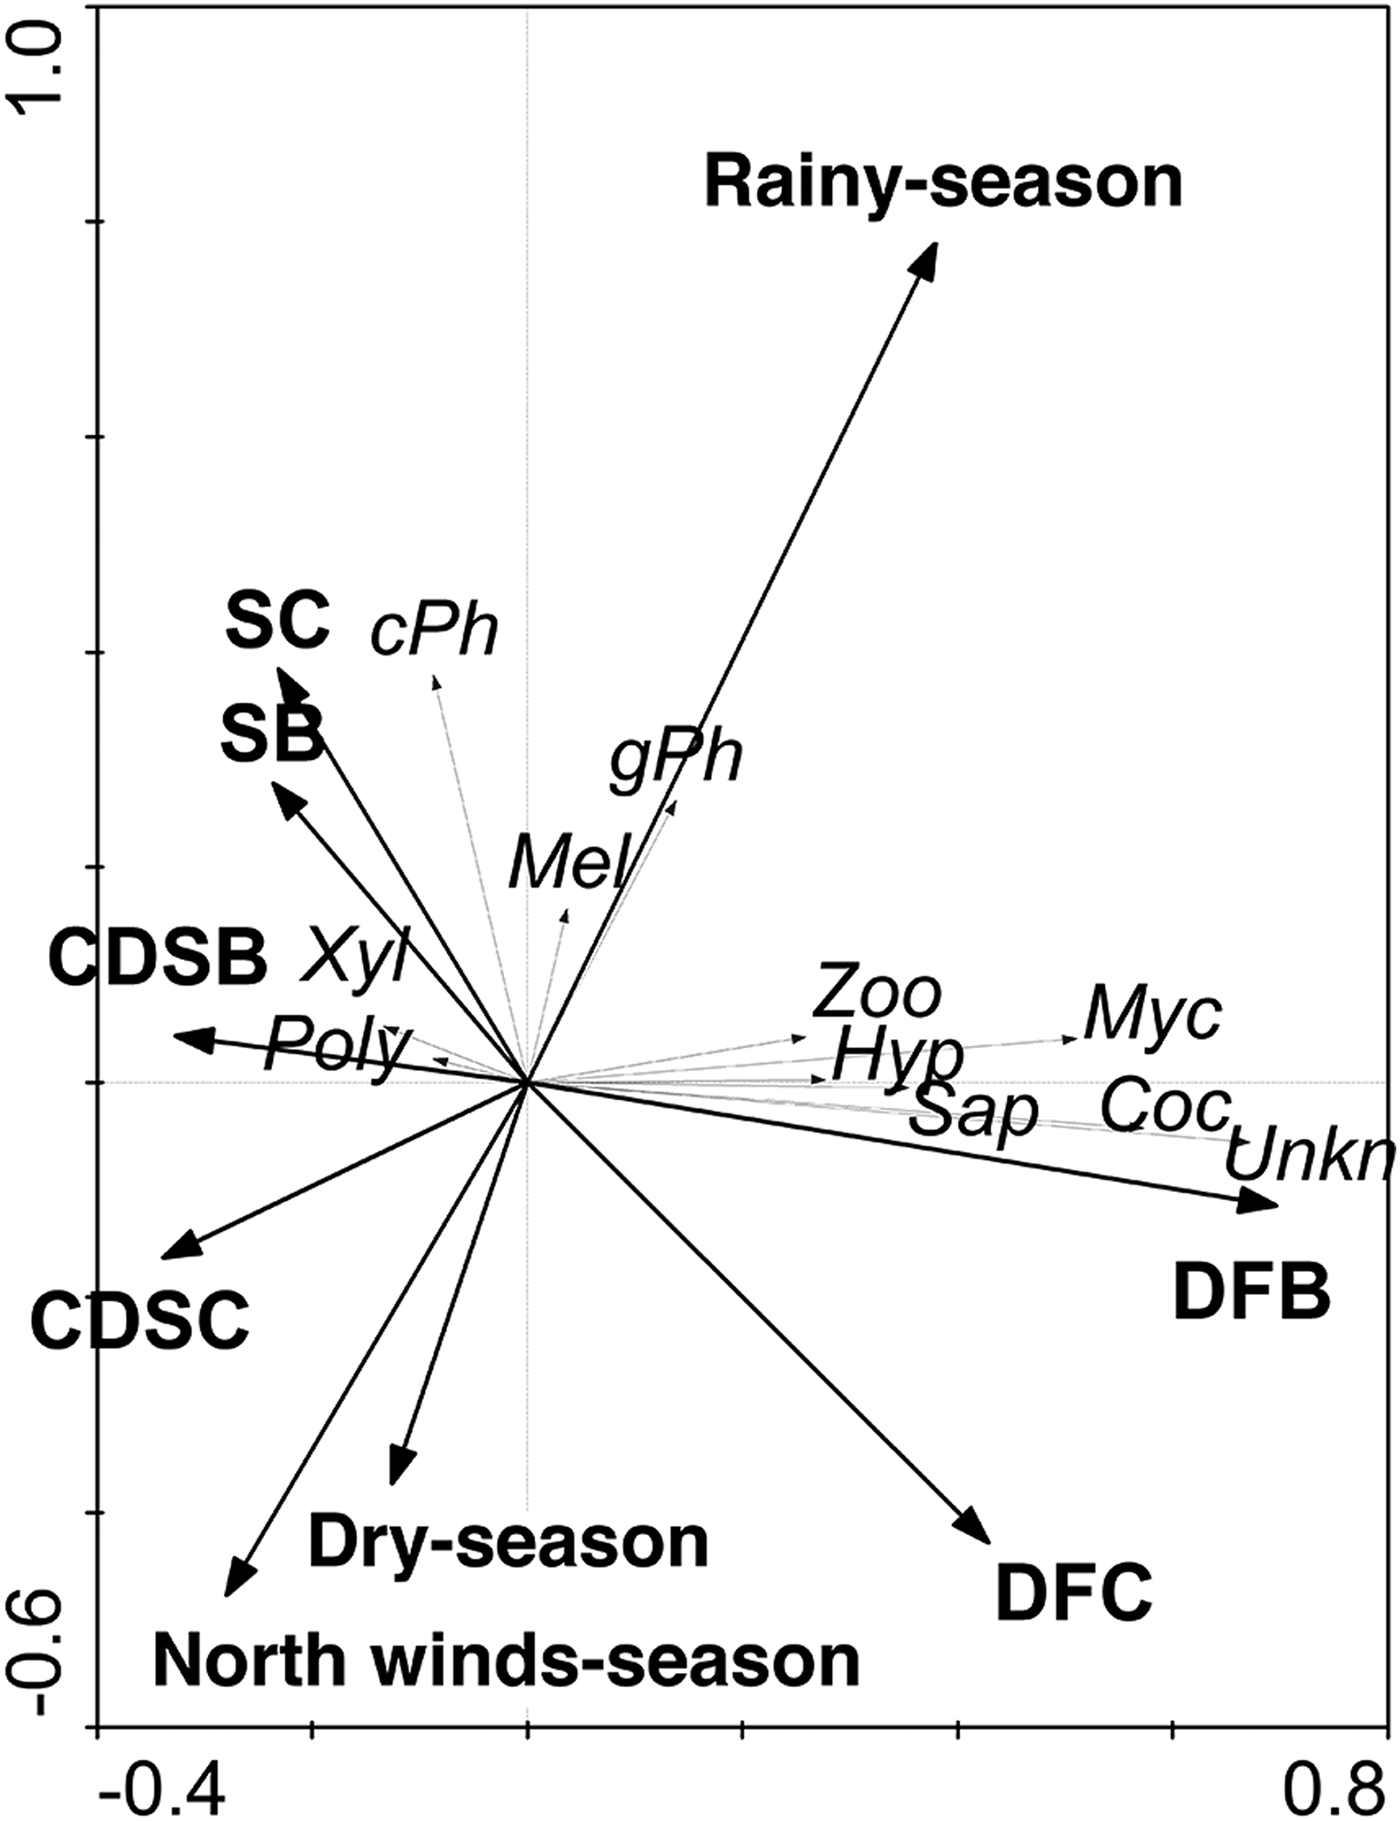
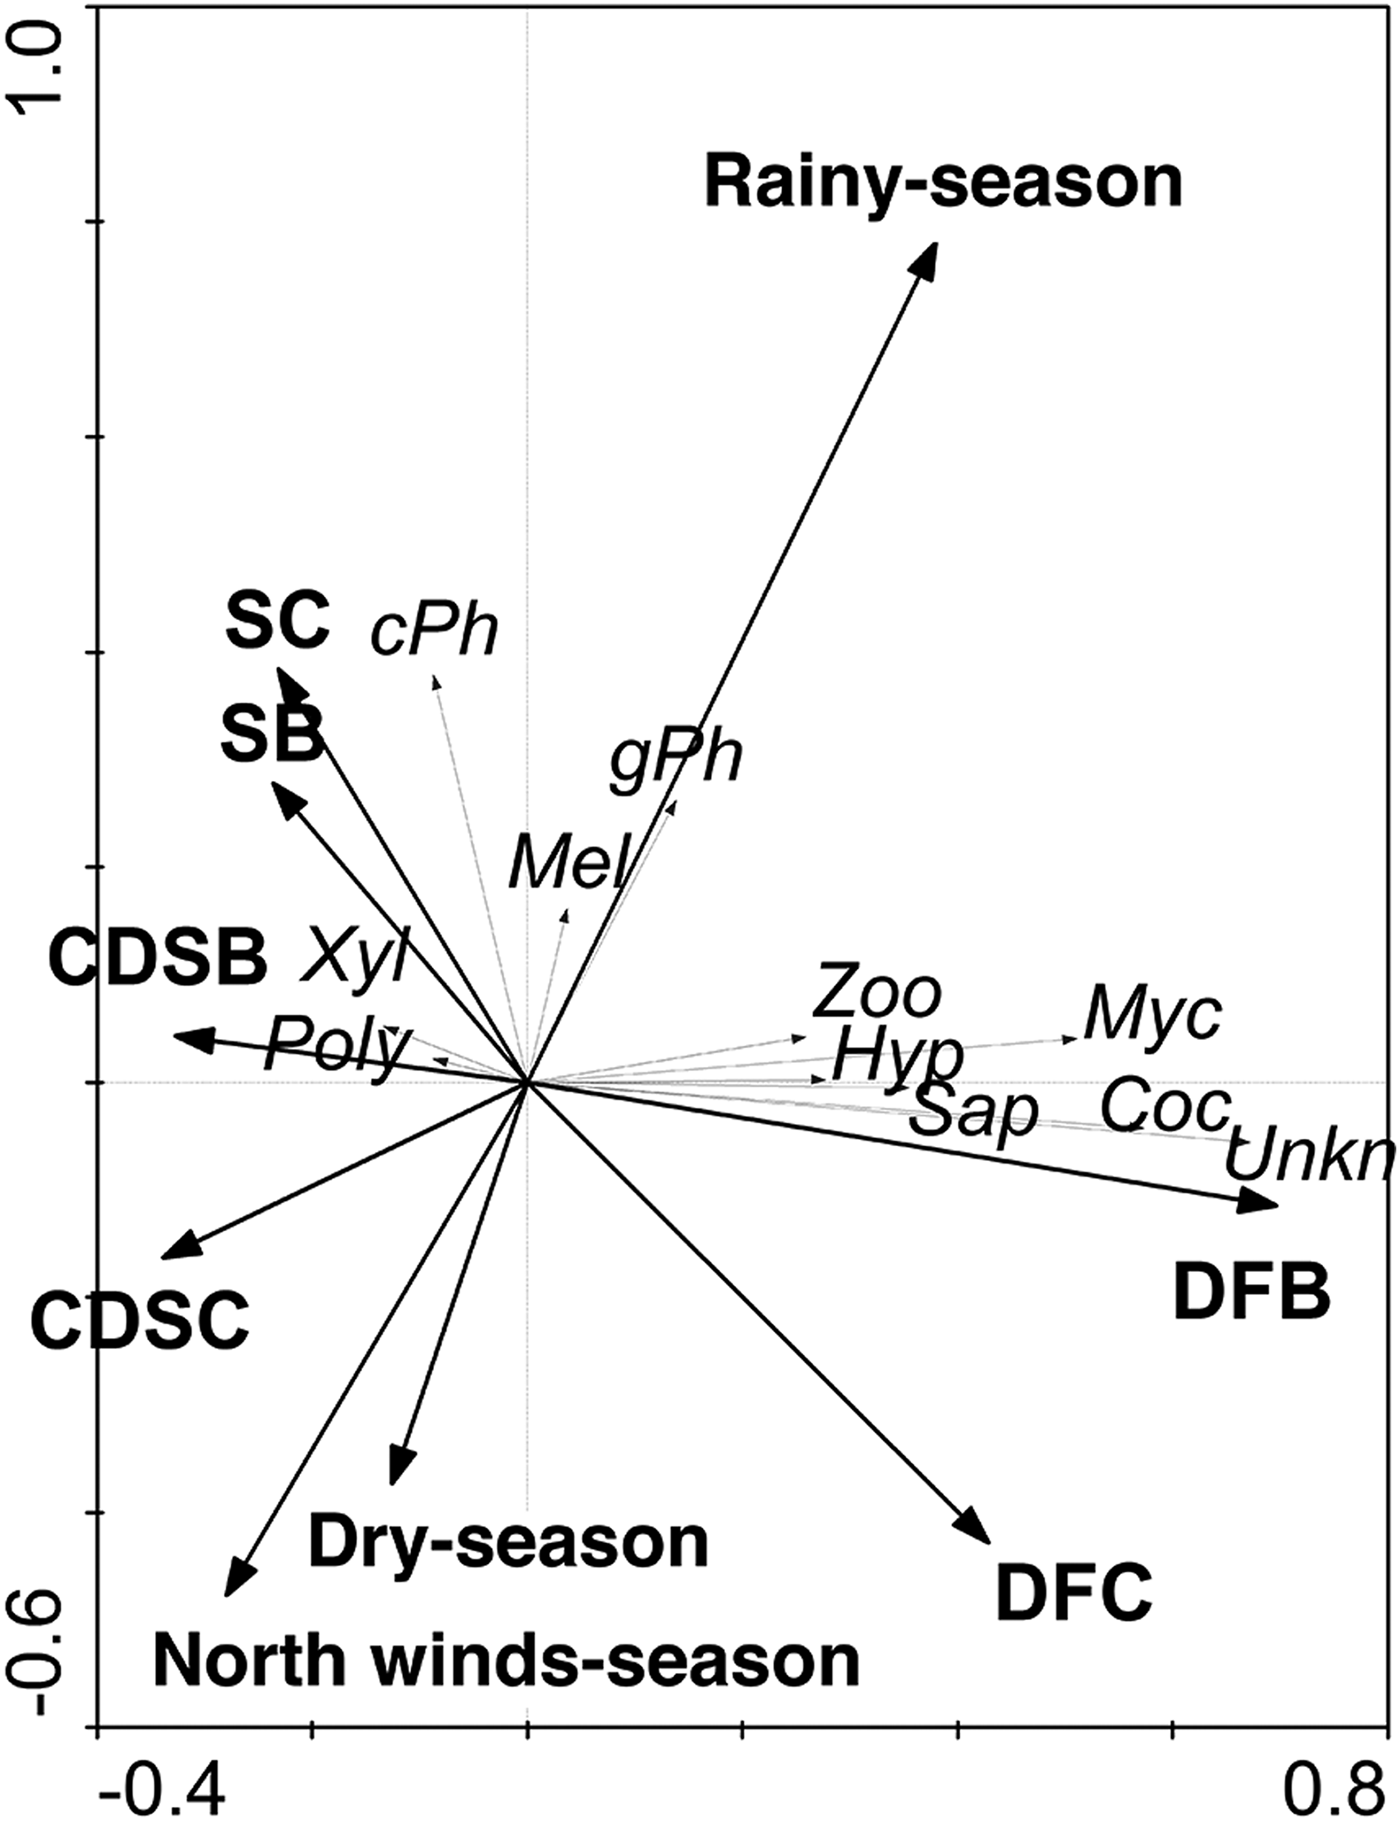
Among the 9 guilds defined in this work, exposed and concealed phytophagous were the most abundant, which together represented 56% of the collected individuals; the third most abundant guild was the cocoon parasitoid (Table 5). Possible relationships between the guilds of parasitoids with the vegetation types and seasonality were analyzed. The RDA tri-plot indicated a reduced separation of the guilds of parasitoids on the axes (sum of eigenvalues axes 1–4 = 0.21; and the guilds and type of vegetation – seasonality correlations = 0.631 (axis 1) and 0.378 (axis 2)); however, Monte Carlo permutation tests were significant for the first canonical axis (F-ratio = 28.4, P ≤ 0.005) and for all canonical axes (F = 5.89, P ≤ 0.05). Only vegetation type, such as dry forest buffer (DFB; F = 13.65, P = 0.002), dry forest core (DFC; F = 12.55, P = 0.002) and rainy season (F = 12.34, P = 0.002) were significant in the model. For example, DFB and DFC had strong positive relationships with the Coc and Myc parasitoid guilds, while only DFC had a strong negative relationship with the cPh parasitoid guild. Although the rainy season had a significant effect on the model, only weak positive relationships were detected with the cPh and gPh parasitoid guilds (fig. 8).
Redundancy analysis (RDA) scatterplot illustrating the relationships among 9 guilds of parasitoids, types of vegetation and seasonality. The thick arrows represent the types of vegetation and seasonality. The thin arrows refer to the parasitoid guild.
Individuals number and proportion of Ichneumonidae guilds.

Discussion
The estimated values of species richness suggest that approximately 71–74% of Ichneumonidae species were sampled at the study sites in the RBRL. These results were adequate for comparative studies of parasitoid diversity according to other studies providing results ranging between 70 and 80% of the expected species (Skillen et al., Reference Skillen, Pickering and Sharkey2000; Sääksjärvi et al., Reference Sääksjärvi, Haataja, Neuvonen, Gauld, Jussila and Salo2004; Fraser et al., Reference Fraser, Dytham and Mayhew2007; Mazon & Bordera, Reference Mazon and Bordera2008).
Vegetation
In our study, as in others (e.g., Sääksjärvi et al., Reference Sääksjärvi, Ruokolainen, Tuomisto, Haataja, Fine, Cárdenas, Mesones and Targas2006; Fraser et al., Reference Fraser, Dytham and Mayhew2008b), vegetation had a strong influence on species richness, which is in keeping with the EH, which predicts that structural complexity and high plant diversity favour increased predators or parasitoids (Price et al., Reference Price, Bouton, Gross, McPheron, Thompson and Weis1980; Sheehan, Reference Sheehan1986; Letourneau, Reference Letourneau1987; Russell, Reference Russell1989; Mulder et al., Reference Mulder, Koricheva, Huss-Danell, Högberg and Joshi1999; Jactel & BrockerhoV, Reference Jactel and BrockerhoV2007; Vehvilainen et al., Reference Vehvilainen, Koricheva and Ruohomaki2007, Reference Vehvilainen, Koricheva and Ruohomaki2008; Scherber et al., Reference Scherber, Eisenhauer, Weisser, Schmid, Voigt, Schulze, Roscher, Weigelt, Allan, Beßler, Bonkowski, Buchmann, Buscot, Clement, Ebeling, Engels, Fischer, Halle, Kertscher, Klein, Koller, König, Kowalski, Kummer, Kuu, Lange, Lauterbach, Middelhoff, Migunova, Milcu, Müller, Partsch, Petermann, Renker, Rottstock, Sabais, Scheu, Schumacher, Temperton and Tscharntke2010; Zhang & Adams, Reference Zhang and Adams2011; Borer et al., Reference Borer, Seabloom, Tilman and Novotny2012; Zou et al., Reference Zou, Sang, Bai and Axmacher2013). In the RBRL, the tropical dry forest was the vegetation type with the highest richness and diversity. The dry forest had the most structured complex vegetation (Noyes, Reference Noyes1989), offering a greater variety of resources such as food, refuge and mating sites; these conditions facilitate a higher diversity of herbivorous insects and, as a consequence, of parasitoids (Hawkins & Lawton, Reference Hawkins and Lawton1987; Hawkins et al., Reference Hawkins, Shaw and Askew1992; Jervis et al., Reference Jervis, Kidd, Fitton, Huddleston and Dawah1993 in Idris & Hainidah, Reference Idris and Hainidah2003; Sääksjärvi et al., Reference Sääksjärvi, Ruokolainen, Tuomisto, Haataja, Fine, Cárdenas, Mesones and Targas2006; Fraser et al., Reference Fraser, Dytham and Mayhew2008b); furthermore, it has been reported that many herbivorous insects produce volatile compounds from different plant species that can attract different species of parasitoids (Godfray, Reference Godfray1994).
The similar richness observed between the scrubland and the savannah may be due to their similar vegetation structures (Flores & Espejel, Reference Flores and Espejel1994), which may produce a similar diversity of herbivorous insects and associated parasitoid diversity (Hawkins & Lawton, Reference Hawkins and Lawton1987; Hawkins, Reference Hawkins1988). Furthermore, the lower diversity in the savannah could be explained by the simpler vegetation structure, which may lead to a lower host diversity and, as a consequence, lower parasitoid diversity.
These results largely agree with those obtained previously in the RBRL by Gonzalez-Moreno et al. (Reference González-Moreno, Bordera and Delfín-González2010) in a study on Cremastinae and Labeninae (Ichneumonidae), who reported the highest species richness in the dry forest, and by González-Moreno et al. (Reference González-Moreno, Bordera and Delfín-González2015) on Cryptinae (Ichneumonidae), who also found the highest values of abundance and diversity in the dry forest. However, our results appear to contradict those reported by Chay-Hernández et al. (Reference Chay-Hernández, Delfín-González and Parra-Tabla2006) and Mazon & Bordera (Reference Mazon and Bordera2014), who identified the highest diversity of ichneumonids in open areas surrounded by natural forest, which may be favoured because these areas allow them to pass from one habitat to another, acting as biological corridors (Haddad et al., Reference Haddad, Bowne, Cunningham, Danielson, Levery, Sargent and Spira2003). However, in this case, a more open savannah is also a harsh environment with higher temperature and humidity fluctuations, leading to further reductions in insect biodiversity (Gauld, Reference Gauld1987; Shapiro & Pickering, Reference Shapiro and Pickering2000). The savannah was also the most fragmented vegetation type, surrounded by roads and urban areas, especially in the buffer zone. Furthermore, the disturbance intensity is not the only factor that affects diversity (Idris et al., Reference Idris, Gonzaga, Zaneedarwaty, Hasnah and Natasha2001; Chay-Hernández et al., Reference Chay-Hernández, Delfín-González and Parra-Tabla2006); the surrounding landscape also has an effect (Chay-Hernández et al., Reference Chay-Hernández, Delfín-González and Parra-Tabla2006). Therefore, it is necessary to maintain as much quality landscape heterogeneity as possible because many insects require a variety of structural vegetation types, fields and forest boundaries (Samways, Reference Samways2007), and many studies conclude that landscape diversity favours parasitoid diversity, especially in landscapes with crops surrounded by natural vegetation (Östman et al., Reference Östman, Ekbom and Bengtsson2001; Roschewitz et al., Reference Roschewitz, Hücker, Tscharntke and Thies2005; Tscharntke et al., Reference Tscharntke, Klein, Kruess, Steffan-Dewenter and Thies2005; Zhao et al., Reference Zhao, Hui, Hardev, Ouyang, Dong and Ge2014; Pak et al., Reference Pak, Iverson, Ennis, Gonthier and Vandermeer2015; Meagher et al., Reference Meagher, Nuessly, Nagoshi and Hay-Roe2016); therefore, landscape simplification has a negative effect on the species richness of natural enemies (Inclán et al., Reference Inclán, Cerretti and Marini2014). Unfortunately, the savannah in the RBRL could be considered an ‘island’ because it is a vegetation patch surrounded by urban areas and roads.
The dominant ichneumonid species suggest that parasitoids are exploiting different resources depending on the vegetation type. Ichneumonid species shifts were high among the vegetation types. It is possible that the low similarity between communities was due to the narrowness of the ichneumonids’ niches, which allowed the coexistence of many species (Hirose, Reference Hirose, Hawkins and Sheehan1994) and led to specious communities.
Land management
Land management influences Ichneumonidae abundance and richness, probably by modifying resource heterogeneity and availability. A general tendency towards higher species richness in buffer zones was found in this study. A possible explanation for this is the intermediate disturbance hypothesis (IDH), which states that diversity will be higher in sites where disturbance is not very frequent or very intense than in undisturbed or very intensively or frequently disturbed sites (Conell, Reference Conell1978; Speight et al., Reference Speight, Hunter and Watt2008). Insects are no exception; several authors have supported the use of IDH for different functional groups, including specialized apple pests (Szentkirályi & Kozar, Reference Szentkirályi and Kozár1991), insect herbivores (Stork et al., Reference Stork, Srivastava, Eggleton, Hodda, Lawson, Leakey and Watt2017) and parasitoids in agricultural systems (Landis & Menalled, Reference Landis, Menalled and Pedro1998; Lewis & Whitfield, Reference Lewis and Whitfield1999; Menalled et al., Reference Menalled, Marino, Gage and Landis1999; Klein et al., Reference Klein, Steffan-Dewenter, Buchori and Tscharntke2002; Chay et al., Reference Chay-Hernández, Delfín-González and Parra-Tabla2006).
In our study, the highest diversity was found in the buffer zone of the forest, which could be explained by the vegetation in the Yucatan deciduous forests; it has been reported that at intermediate disturbance levels, young trees are the dominant life form but do not yet suppress the herbaceous and shrubby vegetation (Leirana-Alcocer et al., Reference Leirana-Alcocer, Hernádez-Betancourt, Salinas-Peba and Guerrero-González2009), offering a variety of resources and microhabitats to herbivores and their predators (Price et al., Reference Price, Denno, Eubanks, Finke and Kaplan2011). In other words, it has been suggested that on lightly disturbed land (i.e., old abandoned farms), some arthropods specializing in ‘mature’ forests coexist with those specializing in disturbed habitats (New, Reference New2015), leading to a higher species richness than that observed either in mature forests or urbanized land. Furthermore, the dry forest buffer has a higher environmental heterogeneity originating from the existence of a mosaic, including small orchards, cattle grazing and subsistence agriculture, together with forests at various stages of succession; these activities are forbidden in the core zone.
Importantly, on the savannah and scrubland, in both the buffer and core zones, the dominant species employ an endoparasitoid koinobiont strategy, which is considered to be a specialist strategy for host species, mostly Lepidoptera, with low agricultural importance, such as Spodoptera frugiperda, Mocis latipes, Euglyphis fibra, E. rivulosa, Alabama argillacea, Anticarsia gemmatalis and Autoplusia egena (Yu et al., Reference Yu, van Achterberg and Horstmann2012). In forests, the two dominant species included idiobionts (ectoparasitoids with wide ranges of host species), suggesting higher herbivore diversity in the forest.
Furthermore, the other abundant Ichneumonid wasp in the forest buffer, Agonocryptus chichimecus, has been widely collected in different habitats in Mexico (Ruiz-Cancino Reference Ruiz-Cancino, Kasparyan, Coronado, Myartseva, Trjapitzin, Hernández and García2010) and is a known predator of several species of Coleoptera, including Aerenicopsis championi, Anelaphus parallelus, Psyrassa unicolor, Saperda vestita, and Anthonomus grandis and of lepidopteran species, such as Podosesia syringae. The dominant ichneumonid species Camera euryaspis has unknown hosts (Yu et al., Reference Yu, van Achterberg and Horstmann2012). This result is similar to that reported by Stork et al. (Reference Stork, Srivastava, Eggleton, Hodda, Lawson, Leakey and Watt2017), who found that disturbance affected the species composition more strongly than the species richness.
Communities were different not only among vegetation types but also between the conservation status zones (buffer or core zone) of each vegetation type; therefore, the parasitoid community seems to be very specific to each habitat and management category.
Landscape diversity
Notably, a larger component of the regional diversity was represented by the high species turnover between vegetation types and management zones. This pattern of high turnover could be explained by the variation in structural diversity (White et al., Reference White, Adler, Lauenroth, Gill, Greenberg, Kaufman, Rassweiler, Rusak, Smith, Steinbeck, Waide and Yao2006), even within the same vegetation types, which is an indicator that the RBRL has great microhabitat diversity and is able to support well-defined Ichneumonidae communities. These results reinforce the importance of the exclusive species within each vegetation type. Therefore, the diversity of ichneumon assemblages depends on the vegetation structure of a site and its surrounding landscape in the RBRL.
Seasonality
Many studies, including the present study, have found that seasonality, especially rainfall, is important to determining parasitoid ensembles (Gauld, Reference Gauld1991; Shapiro & Pickering, Reference Shapiro and Pickering2000). In the RBRL, the abundance and richness of the species were influenced not only by the vegetation type and management zone but also by the season; the annual maximum diversity occurred during the rainy season, perhaps due to the higher productivity of vegetation and the peak of resource abundance, such as nectar, at this time of year in the RBRL, which occurs when most plant species are in flower and a higher diversity of herbaceous plants exists (Flores & Espejel, Reference Flores and Espejel1994; Andrade et al., Reference Andrade, De la Barrera, Reyes-García, Ricalde, Vargas-Soto and Cervera2007). Our results agree with those obtained by González-Moreno et al. (Reference González-Moreno, Bordera and Delfín-González2015) in the RBRL; several other studies have been conducted in the Neotropics on the same family and other Hymenoptera (Shapiro & Pickering, Reference Shapiro and Pickering2000; Tylianakis et al., Reference Tylianakis, Klein and Tscharntke2005) as well as with other insect orders, such as Diptera and Coleoptera (Sobek et al., Reference Sobek, Steffan-Dewenter, Scerber and Tscharntke2009), as well as in temperate zones in Mediterranean climates, where two peaks are observed throughout the year (Rodríguez-Berrío, Reference Rodríguez-Berrío2006; Mazon & Bordera, Reference Mazon and Bordera2008) that are associated with maximum rainfall and mild temperatures (Mazon & Bordera, Reference Mazon and Bordera2008).
The composition of ichneumonid species changed throughout the year, depending on the season, with only approximately 33% of species common among all seasons. These seasonal changes in species were not unusual; for instance, in Ecuadorian forest Hymenoptera, there was 30% species turnover from the rainy to the dry season (Tylianakis et al., Reference Tylianakis, Klein and Tscharntke2005). Beetles also exhibited high seasonal species turnover (Sobek et al., Reference Sobek, Steffan-Dewenter, Scerber and Tscharntke2009). In the RBRL, this pattern could be explained by the fact that phytophagous communities are also in constant flux throughout the year, following the vegetation phenology and species changes (Andrade et al., Reference Andrade, De la Barrera, Reyes-García, Ricalde, Vargas-Soto and Cervera2007). Furthermore, as with other insects, Ichneumonoidea wasps are able to react to environmental factors, such as seasonal photoperiod, temperature, humidity (González-Moreno et al., Reference González-Moreno, Bordera, Leirana-Alcocer and Delfín-González2012) and air flow (Gullan & Cranston, Reference Gullan and Cranston2000). It is also important to consider the ordination results that indicated opposing directions of species dissimilarity related to seasonality. However, the species composition was analyzed by guild; therefore, these differences could be marked by seasonality together with other biotic conditions such as hosts.
Guilds of parasitoids, vegetation type and seasonality
Our results coincide with those of Mazon & Bordera (Reference Mazon and Bordera2014), who found that phytophagous parasitoids are the most abundant guild in Spanish forests. It has been estimated that there are five to six species of parasitoid for every phytophagous insect (Askew & Shaw, Reference Askew, Shaw, Waage and Greathead1986; Hawkins & Lawton, Reference Hawkins and Lawton1987). Nevertheless, even when they were the most abundant, phytophagous parasitoids experienced no strong influence from vegetation or land management and only appeared to be weakly impacted by season. This pattern might be caused by the complexity of the tropical forests, in which abundant chemical signals may hinder a parasitoid's ability to find its host species (Portillo-Quintero & Sánchez-Azofeifa, Reference Portillo-Quintero and Sánchez-Azofeifa2010). This effect is even more evident in specialized parasitoids (De Rijk, Reference De Rijk2016), as most of the species identified in this study were specialized koinobionts. A koinobiont abundance pattern was also found by other authors (Askew & Shaw, Reference Askew, Shaw, Waage and Greathead1986; Hawkins, Reference Hawkins1988; Chay-Hernández et al., Reference Chay-Hernández, Delfín-González and Parra-Tabla2006). Therefore, it is possible that insect populations in the RBRL are very abundant and able to support viable specialized koinobiont assemblages (Hawkins & Lawton, Reference Hawkins and Lawton1987; Hawkins et al., Reference Hawkins, Shaw and Askew1992).
Vegetation type and management had an important effect on the guilds, and the buffer and core zone of the dry forest had a positive impact on the Coc and Myc parasitoid guilds, which attack cocoons and pupae and the concealed larvae living in the fruit bodies of mushrooms and bracket fungi, respectively. Members of the Coc guild are generalist parasitoids (idiobionts), and their strong relationship with dry forests may be due to their search strategies; in complex vegetation with a high richness of potential hosts (Janzen, Reference Janzen1981) and non-hosts (De Rijk, Reference De Rijk2016), generalist parasitoids may be favoured. Furthermore, generalist parasitoids respond with greater intensity to vegetation diversity, as they depend on a higher availability of host species and alternative resources that can be found in heterogeneous habitats (Sheehan, Reference Sheehan1986). The Myc guild requires environmental conditions such as high humidity, which supports the growth of fungi, conditions that are absent in savannahs and coastal dune scrublands.
These findings are very different from the findings of Mazon & Bordera (Reference Mazon and Bordera2014), who reported that parasitoids with generalist habitats are dominant in oak woodland, which is a homogeneous habitat, while parasitoids of xylophages are characteristic of scrubland. In our study, xylophages were not associated with vegetation and represented only 2% of the total abundance.
In contrast, the core zone had a strong negative relationship with the cPh parasitoid guild of concealed phytophagous larvae feeding inside above-ground plant parts, such as leaf rollers, leaf folders, gall formers and leaf miners. Therefore, the explanation that the most structurally complex vegetation favours parasitoid diversity, as previously stated, was not at work in this guild, which may be because this parasitoid type needs visual cues to find the host, such as damage by leaf miners (Quicke, Reference Quicke2015). In a dry forest with complex vegetation (Noyes, Reference Noyes1989), these cues are difficult to identify (De Rijk, Reference De Rijk2016). Other studies have found no effects from genotypic diversity or species diversity on leaf miner abundance, parasitism or parasitoid species richness (Abdala-Roberts et al., Reference Abdala-Roberts, González-Moreno, Mooney, Moreira, González-Hernández and Parra-Tabla2016).
This study highlights the role of vegetation type, land management based on conservation type, and seasonality on the diversity of Ichneumonidae in a protected area of Mexico, resulting in the following findings: (1) the vegetation type influenced species richness and abundance of Ichneumonidae, with the dry forest having the highest diversity, supporting our first hypothesis in keeping with the EH, which predicts that structural complexity and high plant diversity favour increased predators or parasitoids. (2) Furthermore, land management influences Ichneumonidae diversity but in a manner opposite what was expected; diversity was higher in the buffer zone than in the core zone, rejecting our second hypothesis. Nevertheless, these results are based on the IDH, which states that diversity can be higher at sites where disturbance is not very frequent or very intense than in undisturbed or very intensively or frequently disturbed areas. (3) The evidence supported our third hypothesis predicting the highest parasitoid abundance in the rainy season because of the increase in productivity and vegetation complexity. (4) Finally, vegetation and management had a positive impact on parasitoid guilds that attack cocoons and on the pupae and parasitoids that attack concealed larvae living in the fruiting bodies of mushrooms.
In conclusion, variations in the diversity of parasitoid assemblages in the RBRL can be explained at both local and landscape scales. At the local scale, diversity was mainly influenced by the vegetation type, followed by seasonality and management policies, resulting in different assemblages with high beta diversity, both at spatial and temporal scales. However, at the landscape scale, land management is as important as the vegetation type, each contributing 30% to the regional diversity of Ichneumonidae. Considering that the RBRL's fundamental objective is to protect and conserve biodiversity over a large area of high ecological value in south-eastern Mexico, fostering compatibility between the undisturbed vegetation conservation areas and the areas where agricultural holdings are permitted and traditional forestry use exist inside the reserve, our results provide an interesting reference for the reserve managers. These findings demonstrate that this type of environmental conservation policy contributes to the maintenance of high diversity at the landscape level, as both types of management (core and buffer) are complemented, increasing the diversity of different parasitoid assemblages.
Acknowledgements
The authors are grateful to Dr Ruíz-Cancino from UAT (Universidad Autónoma de Tamaulipas, MEXICO), Dr David Wahl from AEI (American Entomological Institute, USA), Dr Ronald Zuñiga and Manuel Solis from INBio (Instituto Nacional de Biodiversidad, currently Museo Nacional de Costa Rica (MNCR)) and Dr Jim Wiley from FSCA (Florida State Collection of Arthropods) for permitting them to study ichneumonid material during visits to their respective institutions. Also, the authors thank the staff of the Ría Lagartos Biosphere Reserve (Yucatán, Mexico) for allowing access to research facilities and providing authorization for collecting material in this protected area. They would like to thank two anonymous referees for their valuable comments on the manuscript and special thanks to the engineer Gregory Stephen Romain for the English revision. This study was supported by Projects A/018089/08 and A/026909/09 of AECID (Ministerio de Asuntos Exteriores y de Cooperación, Spain) and by research grants from Consejo Nacional de Ciencia y Tecnología (CONACYT) (Mexico) and Conselleria d'Educació (Generalitat Valenciana, Spain, Ref: BEST/2010/036).