Introduction
Conventional production system does not take into account innumerable variables impacting yield and, consequently, fields are treated based on average values, as if they were homogeneous. In most cases, neither the soil nor the crop are uniform within a field; they spatially vary their proprieties such as texture, organic matter, water and nutrient availability, crop density, morphology, etc (Heege, Reference Heege2013). According to the same author, future farming has to provide high yields in order to feed the growing world population on a sustainable way. With limited resources of the planet, this dual challenge can only be met by precise adaptation to the locally varying conditions. Sugarcane production in Brazil presents the same challenges and an alternative to solve this problem would be through the use of proximal sensing, which allows obtaining instantaneous information of soil and crop spatial variability. Information about sugarcane aboveground biomass development is important for crop management, since it can allow to infer about abiotic (fertilization, irrigation, cycle initial date, climate, soil, variety, type of cycle: plant-cane or ratoon-cane, etc) and biotic (diseases, pests, etc) influence on final crop yield (Gilbert et al., Reference Gilbert, Shine, Millerc, Rice and Rainbolt2006; Park et al., Reference Park, Robertson and Inman-bamber2005; Singh et al., Reference Singh, Shukla and Bhatnagar2007; Smit and Singels, Reference Smit and Singels2006). In addition, agronomic variables monitoring (measured in high density by proximal sensing technology) could be used on simulation models, aiming to describe crop growth and predict sugarcane yield submitted to several crop conditions (Knox et al., Reference Knox, Rodríguez Díaz, Nixon and Mkhwanazi2010; Lisson et al., Reference Lisson, Inman-bamber, Robertson and Keating2005). Currently, sugarcane growers aim to increase the use of technology in order to assist on management decisions. However, due to the lack of reliable yield monitors for sugarcane, production factors which impact and limit stalk yield within fields are not well-known. In this way, the aim of this study was to evaluate whether canopy sensor technology is able to identify sugarcane biomass variability and whether obtaining other agronomic variable data, such as stalk height and diameter, can assist on biomass quantification.
Materials and methods
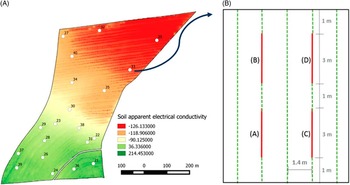
An experiment has been conducted on two sugarcane-producing fields, at Ipiranga Sugarmill, in Descalvado, São Paulo State, Brazil. On the first field (“Boa Vista” – 21°49'41.14''S, 47°44'49.09''W), variety SP867515 was planted on end of April 2015 and had its first harvest on March 24th 2016; on the second (“Santa Luzia” – 21°48'51.74''S, 47°44'8.11''W), variety RB855156 was planted and had its first harvest on the same date; thus, both fields were in the first ratoon. Forty targeted plots (twenty each field) were allocated using a K-means cluster analysis integrating soil apparent electrical conductivity data (0-38 cm and 0-75 cm, figure 1A), soil types and LandSat-8 NDVI image from March 8th 2016. Every plot was comprised by four 3m-long sugarcane row subplots, allowing destructive biomass evaluations on different stages, according to average stalk height (0.3, 0.5 and 0.7 m) and at harvest period (figure 1B). Subplots data consisted on manual measurements of some agronomic variables (number of tillers, stalk diameter and height, Leaf Area Index [LAI] and chlorophyll content), aboveground biomass measurement and canopy reflectance (NDVI and NDRE indices) obtained by a canopy sensor. As an ongoing experiment, only two evaluations were addressed in this paper (~0.3 and 0.5 m stalk height – September 11th and October 11th, 2016, respectively). Three approaches were used to analyze the data by Pearson’s correlation:
-
∙ 1st evaluation: stalk height ~0.3 m – agronomic variables, biomass and canopy sensor were correlated among them;
-
∙ 2nd evaluation: stalk height ~0.5 m – agronomic variables, biomass and canopy sensor were correlated among them;
-
∙ Prediction approach: agronomic variables and canopy sensor data from the first evaluation were correlated and analyzed against second evaluation biomass.
Soil apparent electrical conductivity data from field Santa Luzia exemplifying data used for guide plot allocation. Highlighted, a plot example where (A), (B), (C) and (D) correspond to different stages of evaluation.

The idea behind these approaches was to identify any correlation of agronomic variables and vegetation indices with biomass at the moment of data sampling and also compare with data sampled on earlier evaluations. Deepening the analysis of prediction approach, multiple linear regressions were elaborated integrating vegetation indices and stalk height, due to promising results of other studies explaining part of biomass variation by different data source. This analysis aims to identify whether combining parameters could result in a better prediction model.
Instrumentation
Two vegetation indices were obtained from a canopy sensor (Crop Circle ACS-430 -Holland Scientific Inc., Lincoln, Nebraska, USA), NDVI and NDRE (Amaral et al., Reference Amaral, Molin, Portz, Finazzi and Cortinove2015). This sensor works with three distinct spectral bands: Red (670 nm), Red-edge (transition of red and near infrared, 730 nm) and NIR (Near Infrared, 780 nm). On every subplot, the sensor was manually-carried and held 80 cm above canopy and subplot’s value corresponded to the average of readings; soil apparent electrical conductivity was measured by the sensor EM-38® (Geonics Limited, Mississauga, Ontario, Canada) installed on an ATV utility guided throughout the fields. This equipment collects data on two depths: from 0 to 38 cm and from 0 to 75 cm – both were used to allocate plots. Leaf Area Index was measured in three points of the subplot, beside crop row (each read covers 86,5 cm, excluding external area of subplot and creating an average value) using a ceptometer AccuPAR LP-80 (Decagon Devices, Pullman, Washington, USA). Chlorophyll content was measured with a portable chlorophyll meter (ClorofiLog, Falker Automação Agrícola, Porto Alegre, Rio Grande do Sul, Brazil). Variables “stalk height”, “stalk diameter” and “chlorophyll content” were evaluated on ten random and representative stalks/leaves on each subplot and averaged; “number of tillers” corresponds to total number of stalks counted on subplot.
Results and discussion
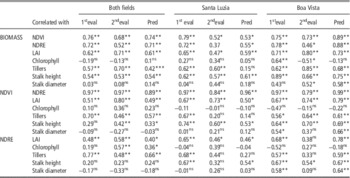
Canopy sensor readings were correlated to sugarcane biomass and their sensitivity to biomass variability was higher on the first evaluation, independently of the field (Table 1). Further, data collected on the first evaluation was efficient in predict biomass amount after 30 days, especially on farm Boa Vista. Such result indicates that this kind of proximal sensing technology can be used for sugarcane biomass prediction and it is in agreement with Amaral et al. (Reference Amaral, Molin, Portz, Finazzi and Cortinove2015), since canopy sensor technology can be a good tool for identifying sugarcane vigor variability within fields. However, these authors, as well as Portz et al. (Reference Portz, Amaral and Molin2012), defended that sensor readings collect in early stage (crop stalk height about 0.3 m) is not able to proper evaluate sugarcane variability due to high soil reflectance and low crop canopy; nonetheless, the high correlation between vegetation indices (mainly NDVI) and sugarcane biomass on both evaluations, as well as in the prediction approach, showed that canopy sensors can be used earlier in the season when the goal is to map biomass variability within fields.
Pearson’s correlation of biomass, NDVI and NDRE with agronomic variables, for three different data approaches, integrated and separated by farm (“Santa Luzia” and “Boa Vista”). Significance levels according to ANOVA test at 1% (**), 5% (*) and non-significant (ns).

On the second evaluation, canopy sensor readings effectiveness to predict biomass was reduced. This behavior may be explained by the increasing tiller-leaf ratio; Portz et al. (Reference Portz, Amaral and Molin2012) argued that when sugarcane stalk height is about 0.5 m, its canopy is almost closed and the amount of leaves do not increase proportional to stalk development, being the last the responsible for increasing biomass, while the sensor is not sensitive to its variability. Nevertheless, this ratio is specific to the cropped variety, what can explain the differences observed across the studied fields (Table 1).
Vegetation indices NDVI and NDRE supposedly are high correlated, since they come from the same 3-band sensor. However, correlation between NDVI and NDRE on the second evaluation (separated fields) was not as high as expected. This behavior might be happen because red-band (NDVI) is more sensitive to LAI variation, while red-edge-band (NDRE) is a little more influenced by crop vigor (chlorophyll variation), based on the relationships presented on Table 1. These results go against Amaral et al. (Reference Amaral, Molin, Portz, Finazzi and Cortinove2015), since these authors stated that NDRE may be subtle better in predicting sugarcane variability than NDVI. Thus, the selection of one or another vegetation index should be guided by the aim of the user.
In most of the cases, agronomic variables showed correlation with biomass (Table 1), except for chlorophyll and stalk diameter data, showing the potential of proximal sensing to predict sugarcane yield throughout early evaluations. Moreover, relationships did not present a clear pattern across the fields, probably due to differences on soil characteristics or crop varieties.
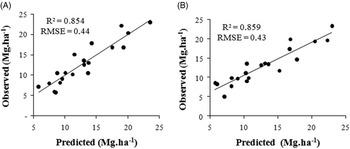
Since agronomic variables tends to show relationship to sugarcane biomass, such data can aggregate information in order to allow a better prediction accuracy rather than canopy sensor readings alone. Some authors have used ultrasonic sensors to measure plant height (Shiratuschi et al., Reference Shiratsuchi, Fergusson, Adamchuck, Shanaham and Slater2009; Portz et al., Reference Portz, Amaral and Molin2012), but other technologies are available, like LiDAR (Hoffmeister et al., Reference Hoffmeister, Waldhoff, Korres, Curdt and Bareth2016). In this sense, agriculture already has tools for sensing crop height efficiently, which can lead to a high accurate biomass prediction when associated to canopy sensor readings (Figure 2). Further investigation aims to explore if multi-sensor platform measuring other crop parameters instead of only canopy reflectance can provide better biomass prediction and, consequently, higher yield estimation accuracy.
Biomass prediction using measured stalk height data and NDRE (A) and NDVI (B), at “Boa Vista” using prediction approach (data collected on first evaluation predicting the biomass measured on the second evaluation).

Conclusions
Crop canopy reflectance sensing is a useful approach to investigate sugarcane biomass spatial-variability within fields on early stages. Also, the relationship between crop variable, proximal sensing data and sugarcane biomass can be different depending on the crop variety and field characteristics. Combining approaches of proximal sensing can be an alternative to obtain high-accurate biomass prediction on early stages in order to improve agronomic investigations within sugarcane fields and variable-rate applications.
Acknowledgements
This project is being financed by the São Paulo Research Foundation (FAPESP) and we also would like to thank Ipiranga Sugarmill (Descalvado/SP – Brazil) for supporting this experiment and to Brazilian Bioethanol Science and Technology Laboratory (CTBE/CNPEM), for providing the equipments.