Nomenclature
- AE
-
autoencoder
- APE
-
aviation piston engine
- CWCI
-
clustering method-guided working condition identification
- DAE
-
deep autoencoder
- DRE
-
dimensionless reconstruction error
- ECOD
-
empirical cumulative distribution-based outlier detection
- FN
-
false negative
- FP
-
false positive
- GA
-
general aviation
- IMDAEF
-
improved deep autoencoder-based framework under multiple working conditions
- LAD
-
local abnormal degree
- LOF
-
local outlier factor
- MDAE
-
deep autoencoder model for multiple working conditions
- OAD
-
overall abnormal degree
- OCSVM
-
one-class support vector machine
- OR
-
outlier region
- RE
-
reconstruction error
- SVM
-
support vector machine
- TN
-
true negative
- TP
-
true positive
- WCI
-
working condition identification
1.0 Introduction
Although the general aviation (GA) industry has been growing rapidly in China in recent years, the safety issue of GA aircraft still remains a challenge. As one of the most important propulsion systems used in GA aircraft, the performance state of an aviation piston engine (APE) is closely related to aircraft operation safety. In order to better manage APE health, an anomaly detection technique is of great practical significance in the process, which can promptly detect patterns in monitored performance data that do not conform to expected behaviour [Reference Chandola, Banerjee and Kumar1], thus ensuring efficient operation of APEs and preventing costly unplanned maintenance. Therefore, it is of great value to study how to improve the detection performance for APE anomaly detection.
In spite of the widespread use of APEs in GA, they are relatively less studied, and most literature focuses on other aero-engines, such as turbojets, turbofans, turboprops and turboshafts [Reference Khattak, Salman, Ghafoor and Latif2]. The methods used in aero-engine anomaly detection can be mainly divided into two categories: model-based methods and data-based methods [Reference Jaw3]. The accuracy of model-based methods [Reference Zhou, Lu and Huang4–Reference Li7] mainly lies in the physical or mathematical expressions adopted in the process, which may not be proper for the real operation process in complex systems such as aero-engines. On the other hand, data-driven methods [Reference Fast, Palme´ and Genrup8–Reference Zhao, Mo, Sun and Huang10] do not require precise mathematical mechanism models and use a tremendous amount of data collected by multiple sensors for anomaly detection, which has a wider application range and better prospects.
With the rapid development of artificial intelligence, machine-learning models are increasingly dominating data-driven methods, which can be further classified into supervised and unsupervised learning. Supervised learning methods primarily involve classification models trained on labeled datasets. These datasets are typically sourced from well-labeled and verified public repositories, where abnormal samples are relatively abundant, contributing to the strong performance of supervised learning models. Nevertheless, due to the constraints of complex working environments and data collection conditions in other engineering application scenarios, analysts may struggle to obtain high-quality normal datasets and sufficient fault data. Additionally, fault phenomena can be highly complex. All of these aspects make data processing and labeling increasingly difficult, which may render supervised learning models less suitable for APE anomaly detection.
Given the aforementioned characteristics of real-life data, unsupervised learning models offer unique advantages and are regarded as the primary solution for APE anomaly detection. A practical advantage of these methods is their ability to perform anomaly detection with scarce or no labels, making them well-suited for handling the large volumes of real APE data. Traditional unsupervised learning models used in anomaly detection substantially include: distance-based or density-based methods, such as K-nearest neighbour models [Reference Ying, Wang, Wang, Li, Zhao, Shang, Huang, Cheng, Yan and Geng11, Reference Li and Guo12], DBSCAN [Reference Jain, Bajpai and Pamula13, Reference Christopher, Song, Lee, Choi, Lim, Bok and Yoo14], local outlier factor (LOF) [Reference Adesh, Shobha, Shetty and Xu15]; support vector machine (SVM)-based methods, such as one-class SVM [Reference Pang, Pu and Li16]; tree-based methods, such as isolated forest [Reference Xu, Wang, Meng and Zhang17, Reference Li, Liu, Liu, Mao, Zhao and Wang18], and autoencoder (AE)-based methods [Reference Sakurada and Yairi19–Reference Han, Ma, Wang and Wang21]. Besides, recent research has validated promising approaches such as transformer-based methods [Reference Song, Kim, Oh, Cho, Oh, Neumann, Globerson, Saenko, Hardt and Levine22, Reference Fentaye and Kyprianidis23], normalising flow-based methods [Reference Miao, Chen, Liao, Dai and He24, Reference Dai and Chen25] and ensemble models [Reference Zhang, Wang, Zhou, Xu and Han26], which offer distinct advantages for different anomaly detection scenarios. Despite the advancement of artificial intelligence, AEs are still considered to be an effective method for anomaly detection, and there are various modifications of AEs, such as sparse autoencoder [Reference Han, Liu, Zhang, Lü and Li27], stacked autoencoder [Reference Lin, Liang, Yoshida, Feng and Guan28], variational autoencoder [Reference San Martin, Droguett, Meruane and Moura29] and denoising autoencoder [Reference Vincent, Larochelle, Lajoie, Bengio and Manzagol30]. These types of AEs introduce different constraints and regularisation terms in the encoding–decoding processes to further improve the performance and generalisation ability of the methods. In general, recent advances in AE-based anomaly detection focus on two aspects: (1) architectural improvements to AEs [Reference Hu, Zhang, Yang and Fang31] and (2) hybrid models combining AEs with other effective models [Reference Wang and Chen32–Reference Lin, Zhang, Cheng, Shi, Gamba and Wang34]. These developments enhance detection while maintaining computational efficiency for industrial deployment. Benefited from the continued development of AEs, these models can be applied to detect anomalies not only in tabular data, but also in graph data [Reference Ding, Li, Bhanushali and Liu35] and image/video data [Reference Xu, Ricci, Yan, Song and Sebe36].
A traditional AE has three layers, including the encoder layer, the hidden layer and the decoder layer. With the development of deep learning skills, the AE model has also been transformed into the deep autoencoder (DAE) model. With a deeper network structure and better generalisation ability, DAEs are proper to solve high-dimensional, unlabeled datasets in engineering applications. The role of DAEs acted in anomaly detection can be mainly divided into two methods: first, the DAEs can be used as the feature extractor to extract lower-dimensional features from the original complex data, and the anomaly detection task is subsequently performed on the new feature space [Reference Moslemi and Jamshidi37, Reference Rifai, Vincent, Muller, Glorot and Bengio38]; another way assumes that abnormal instances are harder to reconstruct from reduced space than normal instances [Reference Pang, Shen, Cao and Hengel39]. For the latter method, the threshold of the DAE model is of vital importance and determined in the normal datasets with lower reconstruction errors (REs). The unlabeled data points will be deemed as abnormal if their REs are larger than the set threshold. In this study, the second method is mainly adopted.
Challenges still exist in applying APE unsupervised learning with a DAE-based model in real-life scenarios. First, for engineering device anomaly detection, it is crucial to account for changes in working conditions in order to achieve optimal performance. For typical rotating machinery such as electric engines, working conditions could be classified by rotating speeds [Reference Lin and Zhao40]. For APEs, the datasets are usually derived from the aircraft’s real-time digital recording devices, indicating that the working conditions of APEs are closely related to aircraft flight phases. Nicoletta Fala [Reference Fala, Georgalis and Arzamani41] discussed flight phase identification skills, and clustering techniques were verified as effective methods. But there is a lack of research on APE working condition identification (WCI) using clustering-based techniques. Secondly, given that APE datasets from daily normal operations inherently contain outliers due to environmental interference (noise, vibration, et al.) and sensor limitations, such errors can consequently bias the DAE threshold determination and compromise final detection accuracy [Reference Yin, He, Peng, Chen, Zhang and Zhang42]. In order to reduce the impact of outliers in normal datasets during the DAE training phase, Song Fu et al. [Reference Fu, Zhong, Lin and Zhao43] developed an R-DAE structure in which a sample selection mechanism was performed during the training stage to screen out outliers in normal datasets; Vincent et al. [Reference Vincent, Larochelle, Bengio and Manzagol44] introduced a modified DAE model named denoising autoencoder, which intentionally injected noise into the input data during training to enhance the robustness; and inspired by robust principal component analysis, Chong Zhou et al. [Reference Zhou and Paffenroth20] proposed a robust deep autoencoder model, which split the input data and increased the robustness of standard deep autoencoders. However, the feasibility of these methods needs to be further verified on APE datasets. Additionally, it is certain that the DAE threshold determination is affected by the distribution of outliers existed in the normal datasets. Typically, the threshold is calculated through prior knowledge or non-parametric statistical methods such as the 3-sigma principle, control chart and so forth [Reference Schneider, Antensteiner, Soukup and Scheutz45, Reference Ahasan, Haque, Akram, Momen and Alam46]. Nevertheless, these methods are relatively rough and should be improved, considering the specific distribution of outliers in real-life APE datasets. Finally, there are many available public datasets such as the Tennessee Eastman process [Reference Tong, Palazoglu and Yan47, Reference Song, Ma and Shi48] and the continuous stirred tank reactor [Reference Song, Yan, Shi and Tan49]. Han et al. [Reference Han, Hu, Huang, Jiang and Zhao50] also released 57 datasets collected from different fields. These benchmark datasets help researchers to focus on model performance improvement instead of expending a rich price on collecting and labeling data in the real world. But in APE anomaly detection, there is no public dataset, and the labeling task is relatively harder due to the discontinuous and inapparent fault phenomena. More specifically, this type of fault behaviour may easily lead to biased human judgements and even be neglected in the manual labeling process, thus leading to an invalid evaluation of the unsupervised learning model. As yet, there is a lack of relevant discussions on auxiliary annotation of the poorly labeled industrial datasets using a DAE-based framework.
In the face of the difficulties in existing unsupervised anomaly detection methods, inspired by the sample selection mechanism proposed in Ref. [Reference Fu, Zhong, Lin and Zhao43], this paper developed an improved DAE-based framework under multiple working conditions (IMDAEF) to achieve efficient unsupervised anomaly detection and provide a systematic solution to the complexities of APE real-life monitoring data. First, a clustering method is adopted for the working condition classification based on APE multisensor data. Fine-tuning the technique is further employed to adjust the boundaries for the consistency between APE working conditions and aircraft flight phases. The fundamental model, MDAE, introduced in this paper, integrates the clustering-based method for identifying working conditions with corresponding multiple DAE models. Second, to address the presence of outliers in normal datasets, a sample selection mechanism is employed to remove abnormal samples from the original training set whenever possible, thereby minimising their negative impact on the MDAE training process. Third, in order to reasonably determine the threshold values in MDAE, a simple outlier detection method is applied to the REs calculated by MDAE instead of roughly judging by the 3-sigma principle or other statistic methods. Finally, during the model evaluation process, an outlier region division and selection mechanism is proposed, followed by re-annotation of poorly labeled fault datasets, thereby updating the model performance evaluation metrics at the end of the proposed framework.
The rest of the paper is organised as follows: Section 2 introduces the theoretical background and the details of the proposed framework; Section 3 illustrates the application of the framework on APE datasets; Section 4 presents the results, including a comparison with traditional unsupervised methods, an ablation study and robustness analysis; and finally, Section 5 concludes the paper.
2.0 Method
2.1 Clustering method-guided working condition identification for APEs
Engine condition identification assumes that data samples from the same working condition are closer in the feature space than those from different conditions. Therefore, clustering methods can be used for this purpose. The K-means algorithm is a representative clustering method that has been utilised for working condition classification [Reference Liu, He and Liu51, Reference Du, Meng and Yu52], and its main process can be summarised as follows: first, it randomly selects k objects from the whole dataset to serve as the initial clustering centres. Then, each remaining point is assigned to a cluster whose centroid is closest to it. Subsequently, recalculation of a specific centroid position is conducted for each newly obtained cluster by taking the mean of all data points within that cluster. This process is repeated until a cost function begins to converge. The flowchart is shown in Fig. 1.
K-means clustering algorithm flow chart.

However, the accuracy of the K-means algorithm largely depends on the centroid initialisation [Reference Esteves, Hacker and Rong53]. It may also fail to be consistent with the real APE working conditions and corresponding aircraft flight phases. Therefore, a clustering method-guided working condition identification (CWCI) is proposed to improve the identification of APE working conditions. First, APE multisensor data is collected, and the K-means algorithm is applied for identification. Next, the clustering results are used to preliminarily determine the boundaries between different working conditions for the sensor variables. Finally, since the datasets are collected from daily aircraft flight training, the boundaries of the various APE working conditions are fine-tuned to align with the actual flight phases.
2.2 Fundamentals of stacked DAE under multiple working conditions (MDAE)
The AE model is a crucial unsupervised learning model proposed by Hinton et al. [Reference Hinton and Salakhutdinov54], which is typically composed of the encoder layer, the hidden layer and the decoder layer, as shown in Fig. 2. The theory of the model is presented as follows. First, assuming the input vector
 $x \in {R^n}$
, it is transformed to vector
 $z \in {R^m}$
with lower dimensions after the encoding process. Then the decoding layer is adopted to transform the vector z to the vector x
*
. The process is shown in Equations (1)–(2):
 \begin{equation}z = f\left( {{W^{(1)}}x + {b^{(1)}}} \right)\end{equation}
 \begin{equation}{x^*} = g\left( {{W^{(2)}}z + {b^{(2)}}} \right)\end{equation}
where W (i) is the weight matrix, b (i) is the bias term of the network, i = 1, 2. f(·) and g(·) are activation functions for encoding and decoding layers, such as ReLU, LeakReLU and Tanh, etc.
Structure of an AE model.

The objective of an AE is to optimise the model by minimising the discrepancy between the input data x and the reconstructed data x* . A loss function typically represents this discrepancy. The loss function of the AE model is set as the sum of all squared errors between the input vector x and the output vector x* for the training of the AE model, as shown in Equation (3):
 \begin{equation}L\left( {x,{x^*}} \right) = \frac{1}{N}{\sum\limits_{j =1}^N {\left\| {{x_j} - x_j^{\ast}} \right\|} ^2}\end{equation}
where L(·) means the loss function, N indicates the size of the training set and
 $\left\| \cdot \right\|$
represents the Euclidean norm.
In this study, we further enhance the feature extraction capability and training performance of the model by increasing the depth of the AE’s hidden layer, called DAE. Furthermore, a layer-wise pre-training technique is utilised to enhance the speed of iterative convergence, and the DAE model trained by this approach is designated as a stacked DAE, as shown in Fig. 3. The detailed pre-training technique is described as follows:
-
1. A typical three-layer AE is trained, using the mini-batch gradient descent method;
-
2. The encoder layer and the decoder layer in the first AE model are retained, and the hidden layer is extracted for the second AE training;
-
3. Iterate step 2 until the layers are deep enough;
-
4. Stack up the encoder and decoder layers trained in steps 2 and 3 to construct the final structure of a DAE model. All parameters of the DAE are initialised according to the pre-training results and then fine-tuned using the back propagation algorithm.
Schematic diagram of the stack process for DAE training.

Owing to substantial variations in the state parameters of the APE system and diverse criteria for determining normality across various operating conditions, it is imperative to train a DAE specifically for each working condition. This approach enables more accurate detection of anomalies that occur under specific working conditions. The DAE-based model for multiple working conditions is called MDAE, as illustrated in Fig. 4. The structure incorporates a process for identifying working conditions of the input data, and the DAE models are trained specifically for each working condition.
Schematic diagram of the MDAE model.

In order to filter the abnormal samples in the real-life datasets, a sample selection mechanism combined with the MDAE model is adopted. The technique is inspired by Ref. [Reference Fu, Zhong, Lin and Zhao43] and is further applied in MDAE, as shown in Fig. 5. Steps of the technique can be described as follows:
Sample selection mechanism using MDAE.

First, the original unlabeled data is used to train MDAE, and the REs of each original sample are calculated and divided into several datasets using the CWCI technique.
Second, the obtained REs in each working condition dataset are further clustered into two groups using the K-means algorithm. For DAE anomaly detection, outliers are harder to reconstruct compared to normal samples. Therefore, a higher RE for a sample increases the likelihood that it is an anomaly. Given the clustering results, the group with higher REs should be removed, and another group is further filtered to get the representative normal training set.
Finally, a new MDAE is trained using the filtered training set. Due to the sample selection mechanism, the new training set contains almost normal points and a few outliers. After the training of MDAE, the differences of REs between normal and abnormal samples are expected to be more significant than those of MDAE trained using original datasets. Apparently, the applied sample selection mechanism raises the training set quality effectively.
2.3 APE anomaly detection based on IMDAEF
The main structure of conducting unsupervised anomaly detection for APEs using IMDAEF is shown in Fig. 6, and the detailed process is described as follows.
Schematic diagram of IMDAEF.

Figure 6 Long description
Panel A: Data acquisition and preparation. This panel shows the initial step of data acquisition from real flight scenarios, including normal and fault data. The data is divided into training sets and a testing set. Panel B: Training stage of the proposed method. This panel is divided into three sub-panels. The first sub-panel shows the sample selection mechanism using RE Clustering and MDAE. The second sub-panel illustrates the equivalent threshold determination process using MDAE and ECOD. The third sub-panel shows the calculation of OAD and LAD. Panel C: Evaluation stage of the proposed method. This panel shows the re-annotation process using MDAE and the evaluation metrics such as precision, recall, F1-score, and accuracy.
First, the real-life multisensor data of a normal APE operation is collected and divided into two training sets, named Training set 1 and Training set 2. The first MDAE model is trained using Training set 1. After that, a sample selection mechanism is applied for data filtering. Points belonging to the cluster with large REs are removed, while samples closer to the centroid in another cluster are further selected to form a new training set. It can be inferred that the new dataset primarily consists of normal points, with virtually no outliers. After that, the MDAE is retrained using the new dataset as input.
Second, Training set 2 is adopted as the input to determine the thresholds of the IMDAEF. Considering the outliers present in the second training set, a simple detection algorithm called empirical cumulative distribution-based outlier detection (ECOD) is used to calculate the specific proportion of outliers in the APE normal dataset. Subsequently, equivalent thresholds are established for different working conditions by maintaining a consistent proportion of data points exceeding the corresponding threshold values. An explanation of this algorithm can be found in Ref. [Reference Li, Zhao, Hu, Botta, Ionescu and Chen55], as it will not be elaborated on here. Dimensionless operations are performed for each working condition to calculate the dimensionless REs (DREs), as shown in Equation (4). For IMDAEF, a given point is considered as an outlier if its DRE is above 0.
 \begin{equation}DRE = \frac{{R{E_{\begin{array}{*{20}{c}}{condition} & n\end{array}}} - Threshol{d_{\begin{array}{cc}{condition} & n\end{array}}}}}{{Threshol{d_{\begin{array}{cc}{condition} & n\end{array}}}}}\end{equation}
Third, an outlier region (OR) division mechanism with two evaluation metrics called overall abnormal degree (OAD) and local abnormal degree (LAD) is proposed for the benefit of describing outlier clustering characteristics over time in a given dataset. The method is shown in Algorithm 1. The definition of OAD of the whole dataset is shown in Equation (5):
 \begin{equation}OA{D_{normal}} = \frac{{{n_a}}}{{{N_a}}}\end{equation}
where
 $OA{D_{normal}}$
describes the overall abnormal distribution of the real-life APE normal dataset, n
a
, N
a
means the number of the outliers in the normal dataset and the size of the normal dataset.
Outlier region division

Algorithm 1 Long description
The equation represents the overall abnormal degree of a normal dataset. It is defined as the fraction with numerator n subscript a and denominator N subscript a. n subscript a represents the number of outliers in the normal dataset, and N subscript a represents the size of the normal dataset.
After the OR division, similarly, the OAD of a specific region is defined as Equation (6):
 \begin{equation}OAD_{normal}^{region} = \frac{{{n_b}}}{{{N_b}}} \gt OA{D_{normal}}\end{equation}
where
 $OAD_{normal}^{region}$
describes the abnormal degree of a specific region in the real-life normal dataset, and it is larger than
 $OA{D_{normal}}$
to highlight the abnormality of ORs. n
b
, N
b
denote the number of abnormal samples in each outlier region and the size of the OR. The definition of LAD in a normal dataset is shown in Equations (7a) and (7b):
 \begin{equation}LAD_{normal}^{region} = {n_b}\end{equation}
 \begin{equation}LA{D_{normal}} = n_b^*\end{equation}
where
 $n_b^*$
is a value larger than that in most ORs of the same dataset.
 $LAD_{normal}^{region}$
implies the outlier clustering in a specific region, while
 $LA{D_{normal}}$
indicates the outlier clustering threshold value of the real-life normal dataset.
Finally, although public datasets for APE anomaly detection are limited, real-life multisensor datasets containing fault behaviours are extracted from daily flights and carefully labeled by maintenance staff for use as testing datasets. However, due to human limitations and the complex nature of fault behaviours in APE daily flights, the annotation task is particularly challenging, and the resulting labels may not always be entirely accurate. To address this, an OR selection technique, integrated with the previously described OR division mechanism, is introduced during the model evaluation process. The primary goal is to assist in re-labeling fault datasets using the OAD and LAD parameters obtained during the training process. By inputting the fault dataset into the MDAE in the framework, similar operations are performed, allowing the outlier distribution within the fault dataset to be determined. The corresponding OAD and LAD are presented in Equations (8) and (9):
 \begin{equation}OAD_{fault}^{region} = \frac{{{n_c}}}{{{N_c}}} \gt OA{D_{normal}}\end{equation}
 \begin{equation}LAD_{fault}^{region} = {n_c} \gt LA{D_{normal}}\end{equation}
where n c , N c denote the number of the abnormal samples in each OR and the size of the OR in a specific fault dataset.
The ORs selected in the testing fault-embedded datasets need to fulfil the following requirement: the LAD of the regions in the fault datasets should be larger than
 $LA{D_{normal}}$
determined using the real-life normal dataset. Thus, the ORs are abnormal enough compared with the normal datasets, and if outliers in ORs are mislabeled as normal samples, they are supposed to be relabeled and recognized as anomalies, leading to the recalculation of the evaluation metrics. While manual verification remains mandatory during the final re-annotation stage, this method provides a relatively feasible criterion that can be used in the model evaluation process to help with the annotation task and improve the accuracy of the model performance evaluation metrics. It can also be applied in the subsequent unsupervised anomaly detection process to identify critical outlier clusters that are more anomalous and warrant attention.
Overall, Fig. 6 and the aforementioned description together illustrate the following module relationships in IMDAEF: the integration of the CWCI process and the DAE forms the MDAE model. A sample selection mechanism acts during MDAE training to optimise this model. Subsequently, the equivalent threshold determination module uses the trained MDAE to compute appropriate thresholds for anomaly detection, yielding the OAD and LAD parameters that are critical for the final re-annotation process. The proposed framework is considered applicable to various types of APEs. However, different engine types may exhibit distinct operational profiles and noise characteristics. Consequently, applying our framework to a new engine type would require adjustments to the framework parameters, with particular emphasis on recalibrating the working condition boundaries and equivalent thresholds based on the specific normal-operation data of that engine.
3.0 Experiment using IMDAEF
3.1 Data analysis and preprocessing
The experimental monitoring data were obtained from CD-135 APEs installed on the aircraft at the Flight College of Civil Aviation University of China (CAUC). These datasets are multidimensional time series data obtained by the full authority digital engine control (FADEC) system, as shown in Table 1. Due to practical limitations, the normal operation data used for training was mainly collected from a specific APE. To ensure coverage of all flight phases throughout the year, we selected datasets that encompass complete flight training profiles from multiple seasons. Moreover, normal operation data from the top one-third of the engine’s service life were primarily selected to minimise the degradation effect on the detection results. And the testing datasets used for model evaluation are mainly fault-embedded datasets collected from multiple APEs with the same engine type. These fault datasets were downloaded by the maintenance staff and primarily consist of piston engine data collected during the three hours leading up to the aircraft’s emergency landing. Therefore, the fault datasets inherently contain both normal and abnormal data.
Typical APE sensor data obtained from FADEC system

Table 1 Long description
The table presents typical APE sensor data obtained from a FADEC system, with 5 rows and 12 columns. The columns are labeled as Date, Time, Revs, Load, MAP, POil, PRail, PBaro, DisLoad, LiMAPTar, AdActVol, PRaTar, and WG_DC. The units for each column are specified as follows: Revs in rpm, Load as a fraction, MAP and POil in mbar, PRail and PBaro in bar, DisLoad as a fraction, LiMAPTar in mbar, AdActVol in cubic meters per minute, PRaTar in bar, and WG_DC as a fraction. The data rows are as follows: Row 1: 12/03/2023, 01:34:39:00, 3323, 66.6, 1741, 4216, 899, 765, 59.7, 1744, 41.05, 917, 84.4. Row 2: 12/03/2023, 01:34:40:00, 3326, 66.6, 1736, 4151, 899, 765, 59.8, 1745, 41.06, 919, 84.6. Row 3: 12/03/2023, 01:34:41:00, 3342, 66.6, 1741, 4163, 921, 765, 59.9, 1749, 41.09, 925, 85. Row 4: 12/03/2023, 04:50:18:00, 1495, 0, 1037, 2712, 347, 987, 5.3, 1211, 8.8, 348, 18.
Main variables collected by the FADEC system

Table 2 Long description
A table with eleven rows and three columns. The columns are labeled Variable abbreviation, Meaning, and Unit, range. Row 1: Variable abbreviation, Revs; Meaning, Crankshaft speed; Unit, range, rpm, 0-8000. Row 2: Variable abbreviation, Load; Meaning, Position of throttle lever; Unit, range, /, 0-100 percent. Row 3: Variable abbreviation, MAP; Meaning, Engine intake pressure; Unit, range, mbar, 0-3000. Row 4: Variable abbreviation, POil; Meaning, Lubricating oil pressure; Unit, range, mbar, 0-5000. Row 5: Variable abbreviation, PRail; Meaning, Common-rail fuel pressure; Unit, range, bar, 0-2500. Row 6: Variable abbreviation, PBaro; Meaning, Ambient atmospheric pressure; Unit, range, mbar, 0-2000. Row 7: Variable abbreviation, DisLoad; Meaning, Engine power; Unit, range, /, 0-100 percent. Row 8: Variable abbreviation, AdActVol; Meaning, Fuel injection quantity; Unit, range, m3/min, 0-100. Row 9: Variable abbreviation, WG_DC; Meaning, Waste gate duty cycle; Unit, range, /, 0-100 percent. Row 10: Variable abbreviation, LiMAPTar; Meaning, Target value of MAP; Unit, range, mbar, 0-3000. Row 11: Variable abbreviation, PRaTar; Meaning, Target value of PRail; Unit, range, bar, 0-2500.
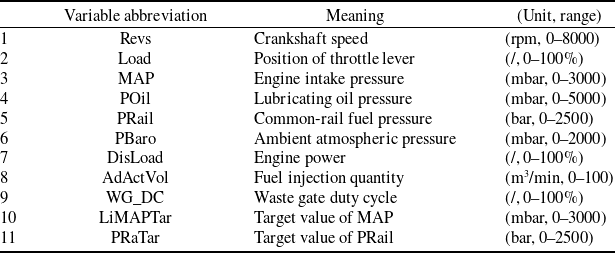
Table 2 lists and describes key variables from the FADEC sensors, along with the units and ranges used in this study. The selection of these variables is grounded in engineering expertise [56], as they demonstrate high relevance for detecting anomalies in APEs. For variable 10, since the difference between the target value and the actual value may be more meaningful for detecting faults in APEs, the absolute value of the difference between variables LiMAPTar and MAP is selected as the final feature, instead of LiMAPTar. A similar feature processing method can also be performed on PRaTar. Therefore, the IMDAEF has an input variable dimension of 11. Notably, the flight phases of the APE-equipped aircraft can be judged from the variable PBaro. After feature selection, the normalisation of input data x is done using Equation (11) to get normalised x norm .
 \begin{equation}{x_{norm}} = \frac{{x - \min\!(x)}}{{\max\!(x) - \min\!(x)}}\end{equation}
Optimal cluster selection of K-means method.

Revs and corresponding clustering results.

3.2 CWCI of APEs
As mentioned in Section 2, the APE normal operation dataset is divided into Training set 1 and Training set 2, respectively. The K-means algorithm is trained using Training set 1, which includes all working conditions. To determine the optimal number of clusters, the elbow method was applied, as illustrated in Fig. 7. The Y-axis indicates the sum of the distances from each sample to the corresponding cluster’s centre point, while the X-axis is the number of the clusters. The results show that the optimal number of clusters is 4. All figures presented in the following sections were prepared using Origin.
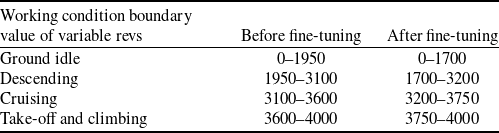
Figure 8 is an example illustrating the trend of Revs in the selected normal operation dataset, while different colours show results of the K-means algorithm. In this paper, the term ‘sample number’ refers to a continuous sequence of samples taken at 1-second intervals. The four clusters in Fig. 8 correspond to distinct APE working conditions. Their clear stratification in the Revs plot, as evidenced by the colour distribution, indicates a strong correlation between operating condition and rotational speed. Here, Revs is used as an example to demonstrate the proposed identification method: the preliminary Revs boundaries of different working conditions can be determined from colour distributions in Fig. 8, and values are shown in Table 3. Nevertheless, due to the limitations of the clustering algorithm, the results may not always accurately reflect the actual states of APE-equipped aircraft, particularly as the APE working conditions should also align with the aircraft’s flight phases. In this study, the flight phases are identified by the trend of PBaro over time, which can be divided into four phases: ground idle phase, take-off and climbing phase, cruising phase and descending phase. Thus, the values of APE working condition boundaries are further fine-tuned to ensure consistency with the PBaro distribution. This process can be seen in Fig. 9, and the final boundaries of Revs are presented in Table 3. Other variables can also be adjusted using a similar operation. Typical parameters of identified working conditions are presented in Table 4.
APE working condition boundaries before and after fine-tuning

Table 3 Long description
A table with four rows and three columns comparing the boundaries of a variable revs for different working conditions before and after fine-tuning. The columns are labeled Working condition boundary, value of variable revs, Before fine-tuning, and After fine-tuning. The row labels are Ground idle, Descending, Cruising, and Take-off and climbing. Row 1: Ground idle, 0-1950, 0-1700. Row 2: Descending, 1950-3100, 1700-3200. Row 3: Cruising, 3100-3600, 3200-3750. Row 4: Take-off and climbing, 3600-4000, 3750-4000.
Typical parameters of identified APE working conditions

Table 4 Long description
A table titled 'Typical parameters of identified APE working conditions' with two columns: Phase parameters and Typical range. The table has four rows detailing the parameters and their ranges. Row 1: Climbing/descending time, 600-900 s. Row 2: Climbing/descending altitude, 2300-2800 m. Row 3: Cruising altitude, 2500-3000 m. Row 4: Cruising time, 1000-7000 s.
Comparison of CWCI results. (a) K-means identification results. (b) Fine-tuned identification results.

The effectiveness of the aforementioned CWCI approach is further verified on three datasets randomly selected from a normal operation flight record of APE-equipped aircraft. Results are shown in Fig. 10 and the identification accuracy is 95.8, 92.68 and 98.1%, demonstrating that the proposed method achieves sufficient accuracy for real-world APE working condition identification.
Verification of CWCI on three sample datasets.

3.3 Parameter setup of IMDAEF
For the training process of IMDAEF, Training sets 1 and 2 are used with dimensions of 11,377 × 11 and 11,325 × 11. The device is a high-performance CPU (AMD Ryzen 9 7945HX) with 16 GB of system memory, using the TensorFlow 2.11.0 framework. In IMDAEF, each DAE uses two hidden layers. Because the number of input variables is 11, the number of neurons in the input layer is 11. The learning rate is set to 0.001. The model employs Glorot uniform initialisation and L2 regularisation. The remaining hyperparameters were optimised through a tuning process. Here, hidden layer sizing and activation function selection for the climbing phase DAE are detailed below as a representative case study. Grid search results in Fig. 11(a) demonstrate decreasing REs with larger hidden layers, indicating improved fitting capability. A balance between performance and computational cost leads to the selection of 10 and 6 nodes for the respective hidden layers. Subsequent activation function selection is shown in Fig. 11(b), confirming the superior performance of LeakyReLU. The final optimised hyperparameters are presented in Table 5.
Main hyperparameters of the IMDAEF

Table 5 Long description
The table presents the main hyperparameters of the IMDAEF for different flight phases: Ground idle, Descending, Cruising, and Take-off and climbing. It has four rows and five columns. The columns are labeled Hyperparameter, Ground idle, Descending, Cruising, and Take-off and climbing. The rows detail the Size of the DAE layers, Activation function, Batch size, and Epochs. Row 1: Size of the DAE layers, Ground idle, 11-10-8-10-11; Descending, 11-10-8-10-11; Cruising, 11-10-8-10-11; Take-off and climbing, 11-10-6-10-11. Row 2: Activation function, Ground idle, LeakyReLU; Descending, LeakyReLU; Cruising, LeakyReLU; Take-off and climbing, LeakyReLU. Row 3: Batch size, Ground idle, 10; Descending, 10; Cruising, 10; Take-off and climbing, 10. Row 4: Epochs, Ground idle, 10; Descending, 10; Cruising, 10; Take-off and climbing, 10.
Partial results of the tuning process. (a) Grid search of optimal hidden layer sizes. (b) Activation function selection.

3.4 Equivalent thresholds and OAD calculations
Following the implementation of the sample selection mechanism on Training set 1, the MDAE model in IMDAEF undergoes training, and the REs for each data point in Training set 2 are subsequently computed using the trained model. Ideally, the established threshold value should exceed all REs derived from the normal operation dataset. Nevertheless, considering the inherent characteristics of real-life operational data, the determination of thresholds must be more precise, allowing the REs of outliers in the normal dataset to exceed the thresholds. Therefore, it is necessary to calculate the specific proportion of outliers (OAD normal ) in the dataset. For this purpose, a simple algorithm called ECOD is introduced, and an example is shown in Fig. 12 to illustrate this process. The sample dataset comprises 500 data points, including 5% outliers, as shown in Fig. 12(a). After using ECOD, the outlier scores of each point are obtained and the corresponding distribution is shown in Fig. 12(b). A significant gap is observed and the outlier score threshold is set as 18. Points with outlier scores greater than 18 are considered outliers, and the number is 25. Then OAD normal = 25/500 = 0.05, which is the same proportion as the initially set outlier points.
Example of OAD calculation using ECOD algorithm.

OAD calculation for a real-life normal dataset using ECOD algorithm (take-off and climbing phase).

Similar operations can also be performed separately for REs under different working conditions, which are generated by trained MDAE using Training set 2 as the input. The results of the climbing phase are presented as representative outcomes in Fig. 13, and the outlier score threshold is set as 5.3. The calculated OAD normal of the four working conditions are very close, mainly around 0.098 to 0.011. Assuming that the distribution of outliers in the normal dataset is unrelated to the working conditions of the piston engine, the final OAD normal of the APE normal dataset is 0.01(1%). Therefore, for each working condition, the equivalent RE threshold requires ensuring that the REs of 1% points are above that. The final equivalent RE thresholds of ground idle phase, take-off and climbing phase, cruising phase and descending phase are 0.01, 0.015, 0.013, 0.017.
Example of OR division and selection mechanism using Faultset1. (a) MAP of Faultset1. (b) Distribution of dimensionless reconstruction errors.

3.5 OR division, selection and re-annotation during model evaluation stage
For a real-life normal dataset, after the determination of equivalent RE thresholds, the dimensionless operation is applied, and the REs are converted to DREs. The advantage of dimensionless operation is that it allows outliers under different working conditions to be visualised and assessed in a single figure. The OR division mechanism introduced in Section 2.3 is then performed on the DREs to obtain the
 $LA{D_{normal}}$
indicating the local outlier clustering threshold. Results show that
 $LAD_{normal}^{region}$
in over 90% of the divided regions are less than 8. Therefore, the final
 $LA{D_{normal}}$
is set as 8.
During the anomaly detection model evaluation process, the OR division mechanism and re-annotation process are executed on fault-embedded datasets. These datasets are manually labeled and Faultset1 is selected as an example to introduce the key processes. Faultset1 is a dataset recording the malfunction of an old-style solenoid valve in the CD-135 piston engine. The main phenomenon is the regular fluctuations of MAP and WG_DC parameters, as shown in Fig. 14(a). This fault is a representative sample to show the complex behaviour of faults in APEs, in which the obvious phenomena are marked in red and the subtle phenomena are marked in blue. During the manual labeling process of the fault-embedded datasets, these subtle phenomena can easily lead to biased human judgements and even be neglected. To demonstrate the difficulty of labeling tasks for these phenomena, the red zones are initially labeled as anomalies and the rest are labeled as normal.
Using Faultset1 as input for IMDAEF, the calculated DREs of samples in Faultset1 are shown in Fig. 14(b). The rectangular box represents the ORs after applying the region division mechanism. The
 $LAD_{normal}^{region}$
of 10 regions in Faultset1 are 219, 100, 29, 9, 3, 10, 19, 284, 24 and 8. Compared with the marks in Fig. 14(a), the positions of regions 1, 2 and 8 highly coincide with the red-marked zones, which are initially labeled as anomalies. Although samples in the other regions are labeled as normal, the positions of regions 3, 4, 7, 9 and 10 largely coincide with the zones marked in blue, suggesting that these regions represent phenomena that were not initially labeled due to their subtlety. The
 $LA{D_{normal}}$
equal 8, thus the region 5 marked in green is abandoned and samples in regions 3, 4, 6, 7, 9 and 10 tend to be re-annotated as anomalies. Changes in the evaluation metrics due to the re-annotation process are shown in Table 6. The entire process has been fully automated using MATLAB. Notably, since
 $LA{D_{normal}}$
is set heuristically, manual verification of the identified regions remains necessary to ensure reliability. Overall, the OR division and selection mechanism provide an effective foundation for labeling complex fault phenomena, proving valuable for both model evaluation and subsequent detection stages.
Evaluation metric changes of Faultset1 before and after re-annotation

Table 6 Long description
A table comparing evaluation metrics of IMDAEF before and after re-annotation. The table has two rows and five columns. The columns are labeled Model, Precision, Recall, F1-score, and Accuracy. The first row represents IMDAEF without re-annotation with values 84.46 percent, 38.56 percent, 52.94 percent, and 90.77 percent respectively. The second row represents IMDAEF with re-annotation with values 89.59 percent, 42.24 percent, 57.41 percent, and 91.08 percent respectively.
4.0 Result analysis
4.1 Fault dataset introduction
To evaluate the anomaly detection performance of different models, four fault-embedded operational datasets of the APEs are summarised in Table 7. These fault sets were documented by CAUC Flight School staff as representative of APE failure modes, based on their routine maintenance experience. Specific parameter changes within these fault datasets are illustrated in Fig. 15, where significant fault sections, diagnosed and highlighted in red through human analysis, are emphasised. Among these datasets, Faultset1 and Faultset2 represent complex faults characterised by discontinuous and subtle phenomena, while the others exhibit relatively simple faults with pronounced phenomena occurring near the end of the datasets.
Brief description of fault datasets

Table 7 Long description
A table with two columns and four rows. The first column is labeled 'Fault dataset number' and the second column is labeled 'Description of the fault occurrence'. Row 1: Faultset1, Malfunction of an old-style solenoid valve. Row 2: Faultset2, Low MAP value and high WG_DC. Row 3: Faultset3, PRail sensor failure. Row 4: Faultset4, Wire breakage of PRail sensor with power fluctuation.
Fault phenomena embedded in representative datasets. (a) MAP of Faultset1. (b) MAP of Faultset2. (c) Prail of Faultset3. (d) MAP of Faultset4.

4.2 Evaluation metric selection
Four typical evaluation metrics called Precision, Recall, F1-score and Accuracy are introduced in this paper for the model evaluation stage. Definitions of these metrics are shown in Equations (12)–(15):
 \begin{equation}Precision = \frac{{TP}}{{TP + FP}}\end{equation}
 \begin{equation}Recall = \frac{{TP}}{{TP + FN}}\end{equation}
 \begin{equation}F1 - score =2 \times \frac{{Precision \times Recall}}{{Precision + Recall}}\end{equation}
 \begin{equation}Accuracy = \frac{{TP + TN}}{{TP + TN + FP + FN}}\end{equation}
where True Positive (TP) represents the number of samples that are predicted to be abnormal and confirmed as abnormal; False Positive (FP) represents the number of samples that are predicted to be abnormal but are actually normal; False Negative (FN) represents the number of samples that are predicted to be normal but are actually abnormal; and True Negative (TN) represents the number of samples predicted as normal and confirmed as normal.
Several considerations must be addressed when using these metrics for APE unsupervised anomaly detection tasks:
-
• Sample Imbalance: Real-world APE operation datasets are highly imbalanced, meaning that even if a model fails to detect abnormal samples, the Accuracy metric might still appear favourable.
-
• Complex Fault Behaviours: The intricate nature of APE fault behaviours and the challenges of manual labeling can result in some fault samples being overlooked. This can lead to an increase in FP and a decrease in TP, ultimately causing deviations in all four metrics.
-
• Importance of Recall: Recall is especially critical in applications where missing abnormal instances can be costly. Therefore, Recall holds greater significance in APE anomaly detection tasks. Additionally, abnormal samples are typically labeled based on clear phenomena and robust engineering expertise, lending higher credibility to the calculations of TP, FN and Recall.
4.3 Performance evaluation
Three groups of comparative experiments are conducted to demonstrate the superiority of our framework. Three independent runs with different random seeds are conducted for each model to ensure statistical robustness. Table 8 summarises the corresponding mean values and deviations of the evaluation metrics, with the best results underlined. For brevity, the per cent signs are omitted in the table. While more in-depth statistical tests are suggested, further elaboration is reserved for subsequent studies due to space limitations.
Evaluation results of present models

Table 8 Long description
The table presents evaluation results of present models across four fault sets: Faultset1, Faultset2, Faultset3, and Faultset4. It includes five methods: DAE, MDAE, M-OCSVM, TranAD, USAD, and IMDAEF. Each method is evaluated based on four metrics: Precision (Prec.), Recall (Rec.), F1 score (F1), and Accuracy (Acc.). The table shows mean values and deviations for each metric. Row 1: DAE, /, /, /, /, /, /, /, /. Row 2: MDAE, 83.43(1.01), 27.92(0.71), 41.84(0.33), 89.55(0.12), 94.27(2.27), 58.04(1.24), 71.84(1.04), 87.93(0.48). Row 3: M-OCSVM, 42.78(0.31), 5.15(0.06), 9.21(0.11), 86.30(0.01), 93.51(0.02), 13.91(0.06), 24.22(0.09), 76.91(0.01). Row 4: TranAD, 87.63(1.40), 36.76(0.49), 51.80(0.73), 90.95(0.12), /, /, /, /. Row 5: USAD, /, /, /, /, 97.22(0.75), 48.51(0.39), 64.72(0.50), 85.97(0.10). Row 6: IMDAEF, 89.66(1.64), 42.34(2.06), 57.52(1.74), 91.10(0.20), 98.06(1.12), 64.05(1.05), 77.48(0.90), 89.88(0.41). Row 7: DAE, 99.37(0.32), 23.09(0.10), 37.47(0.15), 79.78(0.04), 87.63(0.91), 29.72(0.73), 44.39(0.92), 92.21(0.10). Row 8: MDAE, 81.45(0.21), 70.40(0.02), 75.53(0.09), 88.03(0.04), 81.30(0.96), 55.04(1.41), 65.64(1.08), 93.98(0.15). Row 9: M-OCSVM, 99.02(0.00), 23.55(0.00), 38.04(0.00), 79.88(0.00), 89.20(0.14), 45.38(0.66), 60.15(0.61), 93.72(0.07). Row 10: TranAD, 98.66(0.10), 99.15(0.07), 98.91(0.02), 99.43(0.01), 73.41(0.23), 1.00(-0.25), 84.66(0.10), 96.21(0.01). Row 11: USAD, 97.59(0.30), 98.98(0.23), 98.28(0.14), 99.11(0.07), 86.34(0.58), 92.31(0.25), 89.22(0.52), 97.47(0.11). Row 12: IMDAEF, 94.85(0.21), 97.91(0.39), 96.35(0.11), 98.02(0.06), 92.50(1.15), 88.44(1.13), 90.42(0.76), 97.84(0.17).
M-: the model considers the CWCI process.
Here is a detailed analysis of the three groups of comparative experiments in this study. The first experiment group compares DAE and MDAE to assess the effectiveness of the CWCI process prior to anomaly detection. As the results show in Table 8, the single DAE model cannot detect the anomalies in Faultset1 and Faultset2, while the MDAE can. For Faultset3 and Faultset4, the Precision metrics of MDAE are lower than DAE. One of the reasons may be that the subtle fault phenomena are mistakenly labeled as normal samples, leading to an increase of FP and the decrease of Precision in MDAE. Besides, if the model has low Precision and high Recall, the F1-score, which balances the Precision and Recall of the model, can be applied for the final decision. Therefore, the overall performance of the MDAE is superior to the DAE, and the CWCI process is necessary during APE anomaly detection.
The second experiment group is the comparison between the basic model MDAE and our new proposed framework IMDAEF. From the results, it is obvious that the performance of IMDAEF is better than the MDAE since all the evaluation metrics of IMDAEF are much better than the MDAE, which indicates the effectiveness of the sample selection mechanism and the equivalent threshold methods during the training process. The framework achieves the best average Accuracy of 94.21% across the four faultsets. The best overall performance of IMDAEF is on Faultset3, and all of the metrics are over 94%. High Recall (97.91%), F1-score (96.35%) and Accuracy (98.02%) are obtained by our framework on Faultset3, while lower performances are observed on Faultset1 and Faultset2, indicating that there is still room for improvement of our framework for complex faults.
The final experimental group benchmarks our proposed IMDAEF against several baselines, including Multi-condition One-Class Support Vector Machine (M-OCSVM) and two recent deep learning models, Transformer-based Anomaly Detection (TranAD) [Reference Tuli, Casale and Jennings57] and UnSupervised Anomaly Detection (USAD) [Reference Audibert, Michiardi, Guyard, Marti and Zuluaga58]. The results demonstrate that IMDAEF achieves the best performance across all evaluation metrics on Faultset1 and Faultset2. While TranAD and USAD perform better on Faultset3, IMDAEF attains a comparable level of performance to these models on Faultset4, with all three significantly outperforming M-OCSVM. Overall, the comparative results confirm that IMDAEF is a feasible and effective framework for APE anomaly detection, particularly demonstrating superior performance over baseline methods in complex fault scenarios.
Table 9 presents a comprehensive evaluation of computational efficiency, comparing training costs and real-time performance across different models. The training time of the USAD model is the largest, while the M-OCSVM is the least. Although IMDAEF requires a comparatively longer training time, its inference time is significantly less than that of TranAD and USAD, highlighting its practical advantage. Additionally, a comparison of runtime memory usage under the same conditions demonstrates that our model consumes 8–20 MB less than both TranAD and USAD. All the above results demonstrate that our model maintains the required accuracy with modest computational demands, making it well suited for real-time APE anomaly detection tasks.
Comparison of training and prediction time

Table 9 Long description
A table comparing training and prediction times for different models. The table has two columns: Training time and Prediction time, and six rows corresponding to different models: DAE, MDAE, M-OCSVM, TranAD, USAD, and IMDAEF. Row 1: DAE, Training time 53.05 s, Prediction time 0.08 ms. Row 2: MDAE, Training time 56.97 s, Prediction time 0.40 ms. Row 3: M-OCSVM, Training time 13.03 s, Prediction time 0.21 ms. Row 4: TranAD, Training time 75.41 s, Prediction time 1.86 ms. Row 5: USAD, Training time 478.21 s, Prediction time 4.71 ms. Row 6: IMDAEF, Training time 110.70 s, Prediction time 0.53 ms.
Ablation experimental results

Table 10 Long description
The table presents a comparison of F1-scores for different methods across four fault sets. It has five rows and five columns. The columns are labeled Faultset1, Faultset2, Faultset3, and Faultset4. The rows are labeled with different methods: IMDAEF, w/o CWCI process, w/o sample selection mechanism, w/o equivalent threshold determination, and w/o re-annotation process. Each cell contains the F1-score percentage for the corresponding method and fault set. Row 1: IMDAEF, 57.41 percent, 77.45 percent, 96.34 percent, 90.36 percent. Row 2: w/o CWCI process, 29.51 percent, 28.59 percent, 73.05 percent, 44.25 percent. Row 3: w/o sample selection mechanism, 52.79 percent, 75.01 percent, 92.21 percent, 86.17 percent. Row 4: w/o equivalent threshold determination, 41.91 percent, 39.77 percent, 93.43 percent, 85.65 percent. Row 5: w/o re-annotation process, 52.94 percent, 75.63 percent, 95.40 percent, 85.06 percent.
4.4 Ablation study
To investigate the relative contribution of each core component within the proposed framework, we systematically perform ablation studies by sequentially excluding individual modules and quantitatively evaluating their impact on overall model performance metrics during the evaluation process. The comparative analysis is conducted through examination of F1-score variations across selected datasets. First, the CWCI process is removed, and the core model is replaced by a simple DAE model instead. Second, we consider the framework without the sample selection mechanism but instead with a pure MDAE. Third, we consider the model without the equivalent threshold determination, i.e. we assume the thresholds are larger than all of the REs in the normal dataset (excluding rare extremes). Finally, we study the model without the re-annotation process while retaining all other components.
The results are summarised in Table 10 and provide the following findings: when we remove the CWCI process and ignore the effect of various working conditions, the average drop is the maximum, achieving 36.54%. The removal of equivalent threshold determination represents the second-most impactful alteration to the framework, following only the CWCI process. Furthermore, its absence most severely impairs the detection performance on the more complex faults such as Faultset1 and Faultset2. When we remove the sample selection mechanism, the maximum decrease in F1-scores is 4.62%, demonstrating the need for the filtering process for real-life APE datasets. Replacing the re-annotation process has the highest performance drop of nearly 5.3% for Faultset4. However, the drop is not significant for Faultset3, demonstrating that the effect of the re-annotation process may also vary based on the complexities of the targeted fault datasets.
4.5 Robustness analysis
In this study, a test is further conducted to evaluate the noise robustness of IMDAEF. Based on APE engineering experience, Gaussian noise with a mean of 0 and a standard deviation ranging from 0 to 3% of full scale is randomly added to 20% of the dataset for the training. Notably, the Gaussian noise assumption is commonly used in engine health management and has been extensively employed and validated, as supported by numerous studies [Reference Li, Yang, Zhou and Liang59–Reference Verma and Ganguli61]. The results are shown in Table 11. Experimental results demonstrate that the proposed framework retains stable performance under noisy conditions, confirming its robustness against noise interference.
Comparative results of robustness analysis

Table 11 Long description
A table with two rows and three columns. The columns are labeled Method, Ours, and Ours+noise. The row labels are F1-score (Faultset4). The values are as follows: Row 1: Method, Ours, Ours+noise; Row 2: F1-score (Faultset4), 90.36 percent, 88.13 percent.
5.0 Conclusion
Obtaining accurate and representative annotated data is difficult, and there exhibits complex behaviours in both normal and faulty states, which results in poor detection performance of existing anomaly detection methods for APEs. To address this issue, a novel unsupervised anomaly detection method named IMDAEF is investigated to achieve accurate APE unsupervised anomaly detection. In comparison with the current unsupervised anomaly detection methods, the proposed approach offers three distinct advantages, which are elaborated below.
First, a clustering method-guided working condition identification is proposed to determine the boundaries between different working conditions more reasonably. Unlike traditional clustering methods, the developed identification approach refines the clustering results by incorporating aircraft flight phase information, making it more rational and comprehensive.
Second, to address the presence of outliers in real-life normal operation datasets of the APE, this study employs two approaches during the model training stage: firstly, a sample selection mechanism is implemented to automatically remove abnormal samples during the training process of the MDAE model. This ensures that the trained MDAE effectively reconstructs normal samples while struggling with anomalous ones; secondly, a simple outlier detection algorithm is utilised for equivalent threshold determination, as the distribution of outliers in normal operation datasets may not strictly follow the 3σ principle. Consequently, the thresholds obtained are more accurate, further enhancing the performance of the proposed model.
Finally, an OR division and selection mechanism is developed to address the challenge posed by the lack of well-annotated datasets during the model evaluation stage. The OAD and LAD parameters, which characterise the overall and local abnormality of the datasets, play a key role in the OR division and selection process by identifying samples with distinct clustering features in fault-embedded datasets. This technique provides valuable evidence for improving the annotation of subtle phenomena in existing fault datasets. Additionally, it can be applied in the unsupervised anomaly detection process to highlight regions that exhibit greater abnormality and warrant further attention.
The superiority of the proposed unsupervised anomaly detection framework has been validated using various real-life fault-embedded datasets. The experimental data were sourced from monitoring records provided by the FADEC system of the aircraft. Our framework achieves the best F1-score and Accuracy on three datasets (Faultset1, Faultset2, Faultset4) and attains the highest average Accuracy (94.21%) across all four sets, demonstrating superior overall performance. The experimental results indicate that the proposed framework systematically mitigates the adverse effects of real-life data on model training and performance evaluation to a certain extent. Compared to the baseline DAE, our framework yields a substantial 58.88% gain in F1-score, specifically on Faultset3. Ablation study and robustness study are also explored. Overall, the framework is suitable for real-time APE anomaly detection, offering valuable insights for APE safety analysis and continuous airworthiness research.
Our primary contribution lies in demonstrating the empirical effectiveness of the proposed framework, though the study has limitations. First, in the process of conducting anomaly detection research on APEs, two categories of challenging anomalies are identified: those that manifest exclusively under specific working conditions, and those indicated by subtle frequency-domain changes in sensor data. Accordingly, our future work will therefore focus on enhancing the model’s ability to detect these anomalies. Second, this study did not fully investigate operational factors and performance degradation. Future research will address these aspects, particularly since performance degradation may elevate noise levels, a problem where adaptive techniques may offer a solution.
Acknowledgements
The work was funded by the National Natural Science Foundation of China and Civil Aviation Administration of China [Grant U2233213]. The work was supported by the Innovation Team of Complex System Safety and Airworthiness of Aero-Engine from the Aircraft/Engine Integrated System Safety Beijing Key Laboratory, Beijing 100191, China.
Competing interests
The authors declare none.