I. INTRODUCTION
Oxide materials, starting from simple binary to more complex ternary compounds, exhibit a wide variety of electronic and ionic properties. With the advent of atomically controlled oxide thin film growth,Reference Rijnders, Koster, Blank and Rogalla1,Reference Bozovic and Eckstein2 many different artificial structures such as titanate superlattices (SLs)Reference Lee, Christen, Chisholm, Rouleau and Lowndes3 or magnetic/superconducting heterostructuresReference Chakhalian, Freeland, Srajer, Strempfer, Khaliullin, Cezar, Charlton, Dalgliesh, Bernhard, Cristiani, Habermeier and Keimer4–Reference Samal, Shivakumara and Anil Kumar6 have been fabricated in the last two decades with the aim to systematically vary the cation stoichiometry across the thickness of the film that in the search for modified and new physical phenomena. Most notably, since the functionality in electronic and magnetic devices is directly derived from particular properties at interfaces in heteroepitaxial systems (the famous quote by Nobel Laureate Herbert Kroemer states: “the interface is the device”), the studies involving oxide interfaces are on high demand and rapidly progressing. The last decade has witnessed explosive growth of research on various oxide heterostructures resulting in the discovery of exciting interfacial phenomena.Reference Hwang, Iwasa, Kawasaki, Keimer, Nagaosa and Tokura7–Reference Zubko, Gariglio, Gabay, Ghosez and Triscone9 In most cases, the designed interfaces are formed and defined by the alternation of cationic species, with the assumption that the oxygen sublattice will adapt accordingly. However, in very recent works, more attention has been given to control and subsequently measure oxygen sublattice in oxide thin films/heterostructures, which we know to play a pivotal role in the chemical-bonding and structure–property relation. The crystallographic mismatch, violation of local charge neutrality, and the difference in chemical potentials between the constituents belonging to thin films/heterostructures can strongly affect the atomic and therefore electronic structure referenced with its bulk counterpart.
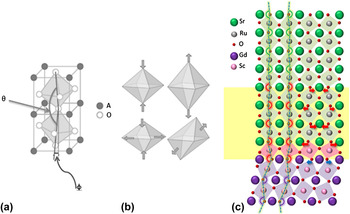
The most studied effect of epitaxy on the oxygen sublattice can be found in ABO3 perovskite oxides, which are greatly influenced by the distortion of the BO6 octahedral network that arises either due to change in lattice symmetry or due to orbital degeneracy (Jahn–Teller effect). The distortion in general can be of three types: (a) cation displacement within octahedra, (b) deformations (changes in the size of the octahedra), and (c) co-operative tilting (rotations) of the octahedra. Primarily, in thin films/heterostructures, the lattice symmetry mismatch between the substrate and film/between different films belonging to heterostructures introduces octahedral distortion at the interface.Reference May, Kim, Rondinelli, Karapetrova, Spaldin, Bhattacharya and Ryan10–Reference Rondinelli and Spaldin14 Schematics of octahedral tilt pattern and various possible deformation modes that can occur at the interface to accommodate the lattice distortion are shown in Fig. 1. A recent study by Aso et al.Reference Aso, Kan, Shimakaw and Kurata12 found a significant distortion in terms of octahedral tilt at the heterointerface between a SrRuO3 (SRO) film and a GdScO3 (GSO) substrate and that remarkably persists up to several atomic layers at the interface [Fig. 1(c)]. This observation emphasizes the fact that the structural mismatch at the heterointerface in oxide heterostructures can be accommodated by the rearrangement of oxygen sublattice. For the case of magnetic perovskite oxides such as manganites, ruthenates, and nickelates, the electronic transport and magnetic properties sensitively depend on the B–O–B bond angle and B–O bond length.Reference Hwang, Cheong, Radaelli, Marezio and Batlogg15,Reference Medard16 This is because the electron hopping matrix element (t ij) and superexchange interaction (J) strongly depend on both the above parameters. Therefore, by controlling the oxygen octahedral distortion and their connectivity and coupling across the perovskite oxide interfaces, one can indeed demonstrate the tunability of oxide thin film properties over a wide range, and moreover it can provide an ideal platform to investigate the interplay between spin, orbit, and lattice degree of freedom in oxide materials at the atomic scale.Reference He, Borisevich, Kalinin, Pennycook and Pantelides11,Reference Rondinelli, May and Freeland13 Indeed, lattice deformation induced metallicity has been reported in LaTiO3 thin films, which otherwise is a correlated Mott insulator in the bulk phase.Reference Wong, Baek, Chopdekar, Mehta, Jang, Eom and Suzuki17 Concerning magnetism, it was shown ultrathin La0.7Sr0.3MnO3 films grown on SrTiO3 that the Curie temperature can be significantly enhanced by epitaxial strain which imposes a different octahedral rotation pattern.Reference Boschker, Kautz, Houwman, Siemons, Blank, Huijben, Koster, Vailionis and Rijnders18 First principles calculation even suggests the possibility for unexpected ferroelectricity in PbTiO3/SrTiO3 heterostructure, arising from octahedral rotation coupling at the interface.Reference Bousquet, Dawber, Stucki, Lichtensteiger, Hermet, Gariglio, Triscone and Ghosez19 Though, the octahedral rotation/tilting/deformation at the interface due to lattice symmetry mismatch is believed to induce novel physical phenomena in thin films/heterostructure systems, a complete atomic scale understanding of such phenomena is still missing until now. This is because of the experimental challenges that require the precise measurements of the position of both cations and oxygens. While in the examples given above, subtle changes in the oxygen sublattice are being explored, more dramatic changes in properties are expected when the cation coordination can be affected and controlled.
(a) Schematic of the octahedral in-plane rotations (ϕ) and out-of-plane tilts (θ) and (b) various modes of octahedra deformation that can occur at the heterointerface to accommodate the lattice distortion. (c) Structural model around heterointerface between the SRO thin film and GdScO3 (GSO) substrate. The termination layer of the GSO substrate is a ScO2 layer and the first layer of the SRO epitaxial thin film is a SrO layer, where ScO6 octahedra (pink squares) at the hetero-interface share oxygen atoms in the SrO layers. Blue dashed lines represent the oxygen octahedral tilt angles. Red and blue arrows represent the oxygen atomic shifts from that of the bulk SRO and GSO, respectively. The yellow box in the vicinity of the heterointerface represents the region where the tilt angle mismatch is accommodated. [Image (c) is taken from Ref. Reference Aso, Kan, Shimakaw and Kurata12.]

The research addressed in this paper involves the control of the oxygen sublattice in such a way that the coordination of cations, here copper, in the structure is varied from 4-fold to 6-fold, and in-plane to out-of-plane configuration respectively by means of thin film methods. First, we discuss the possibility to stabilize a near cubic (tetragonal) form of CuO by using epitaxial strain,Reference Samal, Tan, Takamura, Siemons, Verbeeck, Tendeloo, Arenholz, Jenkins, Rijnders and Koster20,Reference Siemons, Koster, Blank, Hammond, Geballe and Beasley21 thereby increasing the Cu coordination from 4 to nearly 6 [Fig. 2(a)]. Indeed, earlier studies on various cuprate thin films suggest that the lattice mismatched strain can have profound effect on oxygen sublattice reorganization and also can even drive structural transition when the film is below certain thickness.Reference Salluzzo, Aruta, Ausanio, D’Agostino and Scotti di Uccio23–Reference Haage, Zegenhagen, Habermeier and Cardona25 The structure of bulk CuO as found in nature is unique and at variance with other 3d transition-metal monoxides (TMMOs). While MnO, FeO, CoO, and NiO all crystalize in the rock-salt crystal structure with small lattice distortion (<2%) at low temperature,Reference Mattheiss26–Reference Fischer, Däne, Ernst, Bruno, Lüders, Szotek, Temmerman and Hergert29 CuO crystalizes itself in a noncentrosymmetric monoclinic structure possibly due to strong Jahn–Teller distortion.Reference Yang, Thurston, Tranquada and Shirane30 From a magnetic point of view, CuO exhibits an insulating antiferromagnetic ground state similar to other TMMOs. However, while the other TMMO members exhibit a linear trend of increasing Néel temperatures (T N) with increasing atomic number (MnO:T N = 118 K, FeO:T N = 200 K, CoO:T N = 291 K, and NiO:T N = 523 K),Reference Fischer, Däne, Ernst, Bruno, Lüders, Szotek, Temmerman and Hergert29 the monoclinic CuO (m-CuO) shows a substantial departure from this trend having relatively lower T N. Note that it exhibits two distinct antiferromagnetic phases: (i) commensurate collinear and (ii) incommensurate spiral structures with T N = 213 and 230 K, respectively.Reference Kimura, Sekio, Nakamura, Siegrist and Ramirez31 The reduction of T N is believed to be related to reduced effective J due to the lower Cu–O–Cu bond angle (φ = 146°) of the monoclinic structure. Since J strongly depends upon the Cu–O–Cu bond angle as shown in Fig. 2(b) for various low dimensional cuprates,Reference Rocquefelte, Schwarz and Blaha22 one would expect that if CuO were found in the high-symmetry rocksalt structure or perhaps a closely related tetragonal structure with the Cu–O–Cu bond angle (φ = 180°), then T N would be largely enhanced up to ∼800 K assuming the linear trend as shown in Fig. 2(c). Indeed, first principles calculation predicts T N up to 800 K for the rocksalt-like CuO,Reference Chen, Fu, Franchini and Podloucky32,Reference Peralta, Puggioni, Filippetti and Fiorentini33 and more interestingly, a very recent study on CuO–Cu2O heterostructures obtained by high-temperature annealing of copperplate reports the T N close to 600 K, which possibly could be due to high-symmetry CuO phase.Reference Rabinovich, Samoilenko, Zhuravleva and Shneider34 Since the interplay of superconductivity and magnetism is a key issue and there exists experimental evidences for strong antiferromagnetic superexchange interaction in both the insulating parent phase and the doped superconducting phase of cuprates,Reference Rocquefelte, Schwarz and Blaha22 the study of the high-symmetry CuO phase with possible large antiferromagnetic coupling would be an ideal model system to investigate the correlated physics that lies at the heart of high-T c cuprate superconductivity. Moreover, the original proposal by Bednorz and Muller stated that a highly symmetric divalent copper monoxide with partially filled eg orbital would undergo Jahn–Teller (JT) distortion and consequently can have strong electron–phonon interaction based on the JT polaron model, which might mediate superconductivity.Reference Bednorz and Muller35 From the above consideration, the study on highly symmetric (cubic/tetragonal) CuO is highly instructive and might elucidate the fundamental factors underlying high-T c superconductivity in cuprates.Reference Grant36
(a) A schematic overview of the change in unit cell symmetry from bulk monoclinic (a = 4.68373 Å, b = 3.4226 Å, c = 5.1288 Å, and β = 99.54°) to strain induced tetragonal (a = 3.91(2) Å and c = 5.25(10) Å) CuO. The green and red colored atoms represent oxygen and copper, respectively. (b) Principal superexchange interaction as a function of the Cu–O–Cu bond angle for various low-dimensional cuprates [Figure (b) is taken from Ref. Reference Rocquefelte, Schwarz and Blaha22]. (c) Néel temperatures for TMMOs. The blue dot represents the possible Néel temperature that could emerge for rocksalt type CuO assuming a linear trend.

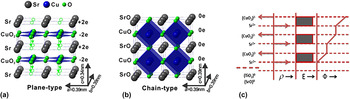
Second, we address a method that originated from the studies involving the interfaces between polar and nonpolar band insulators (e.g., LaAlO3 (LAO); polar and SrTiO3 (STO); nonpolar) that have revolutionized our traditional understanding of interfacial effects and spurred a flurry of research activities. Various intriguing phenomena such as 2D electron gas,Reference Ohtomo and Hwang37,Reference Thiel, Hammerl, Schmehl, Schneider and Mannhart38 superconductivity,Reference Reyren, Thiel, Caviglia, Fitting Kourkoutis, Hammerl, Richter, Schneider, Kopp, Rüetschi, Jaccard, Gabay, Muller, Triscone and Mannhart39 magnetism,Reference Bert, Kalisky, Bell, Kim, Hikita, Hwang and Moler40,Reference Brinkman, Huijben, van Zalk, Huijben, Zeitler, Maan, van der Wiel, Rijnders, Blank and Hilgenkamp41 and electron–hole liquid behaviorReference Millis and Schlom42 have been reported to emerge at LAO/STO interfaces. Akin to LaAlO3, the infinite-layer (IL) tetragonal SrCuO2 (a = b = 3.926 Å, c = 3.432 Å)Reference Takano, Takeda, Okada, Miyamoto and Kusaka43 is also an example of a polar system.Reference Koster, Brinkman, Hilgenkamp, Rijnders and Blank44 In fact, SrCuO2 (SCO) can be synthesized in both tetragonal and orthorhombic phases. The orthorhombic phase acts as an ideal 1D quantum magnetic system to investigate fundamental physical phenomena such as 1D Mott insulator and spin–charge separation.Reference Matsueda, Bulut, Tohyama and Maekawa45–Reference Kim, Matsuura, Shen, Motoyama, Eisaki, Uchida, Tohyama and Maekawa47 The IL tetragonal phase of SCO [Fig. 3(a)] with its 2D CuO2 planes is widely known to be a parent structure for high-T c cuprate superconductors.Reference Kikkawa, Kanamaru and Miyamoto49–Reference Smith, Manthiram, Zhou, Goodenough and Markert51 The high-T c superconductor can be derived from IL structure, by insertion of chemically distinct metal-oxide layers parallel to CuO2 layers. Its structure can be considered as an oxygen deficient perovskite, with Cu2+ ions coordinated to four equatorial O2− ions and no O2− ions in the Sr2+ plane/along the apical direction surrounding Cu ions [Fig. 3(a)]. Since each alternative constituent atomic plane has a formal charge of ±2e, it leads to a built-in electrostatic potential, which increases with the SCO thickness as shown in Fig. 3(c). The alternating layers with a nominal charge of ±2e (in a purely ionic model) cause a build-up of electrostatic energy of ∼8 eV per unit-cell (uc) of SCO. This value constitutes a strong electrostatic instability and makes the IL structure highly polar. For very thin films of such materials, electronic charge transfer, which is a monotonic function of thickness, does not appear to be sufficient to quench the electrostatic instability.Reference Zhong, Koster and Kelly52 Rather, a structural transformation involving the displacement of lighter atoms turns out to be the preferred mechanism. However, for relatively thick films, this instability can possibly be relieved by extrinsic defects (oxygen vacancy, intermixing) and/or charge transfer. Indeed, theoretical studies predict that the polarity of nanoscale objects and ultrathin films can be avoided by a structural transformation involving atomic rearrangements.Reference Zhong, Koster and Kelly52–Reference Harrison, Kraut, Waldrop and Grant55 In particular, the study by Zhong et al.Reference Zhong, Koster and Kelly52 on IL cuprates predicts a transformation from the bulk planar to a chain-type structure for ultrathin films of about 5 uc thick. The resulting chain-type structure incorporates an O2− ion in the Sr2+-plane as opposed to the planar structure and thus consists of charge neutral SrO0 and CuO0 layers [Fig. 3(b)]. Alternatively, this can be viewed as if the CuO4 plaquettes are stacked along a perpendicular direction as compared to that of planar case. The movement of an O2− ion to the Sr2+-plane reduces the anisotropy of the structure and holds apical oxygen surrounding the Cu2+ ions. In the process of such rearrangement of oxygen ions, the c-axis lattice parameter of the chain-type SCO increases by 0.5 Å as compared to the bulk-planar counterpart due to the associated Cu–O bonding in the c-direction. In essence, the stabilization of the ultrathin film structure involves a subtle compromise between two energy terms; namely the elastic strain energy and the electrostatic polarization energy. Eventually, at the expense of considerable amount of elastic strain energy, the system lowers its electrostatic potential energy and makes the chain-type structure to be energetically most favorable in the ultralow thickness limit. It has to be mentioned here that the realization of artificially made chain-type structures in ultrathin SCO layers will open new routes to design/engineer novel superconducting cuprate-hybrids, with alternation of chain and plane-type structures that lies at the heart for the structural model of high-T c cuprate superconductors. Indeed, a recent study by us reveals that an ideal combination (comprising of chain and plane-type CuO blocks stacked along the c-direction) of heterostructure design is essential to tune the electronic properties toward superconducting phase in cuprate hybrids.Reference Samal, Takamura, Rijnders and Koster56 Moreover, the study by Huijben et al. suggests that the addition of a SrCuO2 epilayer strongly reduces the impurity scattering at the conducting interfaces in oxide LaAlO3–SrTiO3 heterostructures, as shown by the observation of higher carrier mobilities.Reference Huijben, Koster, Kruize, Wenderich, Verbeeck, Bals, Slooten, Shi, Molegraaf, Kleibeuker, van Aert, Goedkoop, Brinkman, Blank, Golden, van Tendeloo, Hilgenkamp and Rijnders57 Most interestingly, the observation by Castro et al.Reference Di Castro, Salvato, Tebano, Innocenti, Aruta, Prellier, Lebedev, Ottaviani, Brookes, Minola, Moretti Sala, Mazzoli, Medaglia, Ghiringhelli, Braicovich, Cirillo and Balestrino58 of high-temperature (up to 40 K) superconductivity in CaCuO2/SrTiO3 SLs grown in highly oxidizing condition has drawn immense interest to IL based cuprate heterostructures.
Schematics of the (a) planar and (b) chain-type crystal structures for tetragonal SCO. For clarity, we indicate the oxygen displacement by arrows in (a) that transforms the planar structure into chain-type [Figures (a) and (b) are taken from Ref. Reference Samal, Tan, Molegraaf, Kuiper, Siemons, Bals, Verbeeck, Tendeloo, Takamura, Arenholz, Jenkins, Rijnders and Koster48] and (c) represents stacking sequence of constituent layers with alternating net charge (ρ) for plane-type SCO layer grown on STO substrates (electric field (E) and the built in potential (φ) profiles associated with planar structure are also shown).

In the second part of this paper, we show that an atomic rearrangement of oxygen ions occurs within SCO layers below a certain thickness to alleviate the associated electrostatic instability due to their polar nature. We study SCO/SrTiO3 SLs as well as single SCO layers grown on STO by pulsed laser deposition (PLD). Our findings based on structural and spectroscopic investigation unambiguously demonstrate a transformation from planar to chain-type structure in ultrathin films of SCO.Reference Samal, Tan, Molegraaf, Kuiper, Siemons, Bals, Verbeeck, Tendeloo, Takamura, Arenholz, Jenkins, Rijnders and Koster48,Reference Kuiper, Samal, Blank, ten Elshof, Rijnders and Koster59 Besides being an interesting model system to study such dramatic structural changes and their formation pathways, we demonstrate that the oxygen sublattice can be effectively engineered by systematic variation of the individual sublayer thicknesses in the SL, giving each layer a specific function, for example, current-carrying layers, charge reservoirs, and scaffolding layers. In a simple picture, the structural paradigm of high-T c cuprate superconductors is built on current carrying CuO2 planes (where the Cu ion is co-ordinated to 4 in-plane oxygen) separated by charge reservoir blocks that essentially dope the CuO2 plane giving rise to superconductivity. Charge carriers are generally added to the CuO2 plane either by cation substitution (like Sr2+ in La2−xSrxCuO4) or by addition of oxygen as in the case of YBa2Cu3O7.Reference Cyrot and Pavuna60 The additional oxygen incorporated forms Cu–O chains and acts as a charge reservoir by attracting electrons from the CuO2 plane. The plane comprising of Cu–O chains possesses apical oxygen unlike the current carrying CuO2 plane. Based on the above structural model, the IL compound ACuO2 (A = Ca, Sr, or Ba) appears to be the simplest structure that holds key ingredients for realizing high-T c superconductivity. Designing heterostructures made out of ILs and controlling the oxygen co-ordination from in-plane to out-of-plane (plane to chain type) on the atomic scale as has been illustrated in this article might provide new ways to mimic the basic structural model and artificially fabricate high-T c cuprate superconductors without resorting to any chemical substitution. Indeed, the earlier work by Balestrino et al.,Reference Balestrino, Martellucci, Medaglia, Paoletti and Petrocelli61,Reference Balestrino, Pasquini and Tebano62 Castro et al.,Reference Di Castro, Salvato, Tebano, Innocenti, Aruta, Prellier, Lebedev, Ottaviani, Brookes, Minola, Moretti Sala, Mazzoli, Medaglia, Ghiringhelli, Braicovich, Cirillo and Balestrino58 and Norton et al.Reference Norton, Chakoumakos, Budai, Lowndes, Sales, Thompson and Christen63 reports the observation of high-T c superconductivity in IL based hybrids; however, a detailed understanding of the oxygen sublattice reorganization as a function of film thickness in such polar systems was missing.
II. EXPERIMENTAL DETAILS
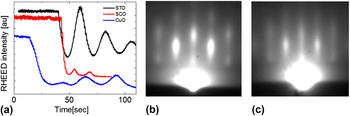
SCO/STO SLs as well as single layers of SCO and CuO thin films were grown on TiO2-terminated (001)-oriented STO substrates by PLD, using a Twente Solid State Technology (TSST) system and a 248-nm-wavelength KrF excimer laser (LPX 200 from Germany Coherent, Inc.). The most homogeneous part of the laser beam was selected using a 4 × 15 mm rectangular mask and an image of the mask was created on the stoichiometric targets (CuO, SrTiO3, and SrCuO2) with a lens. Before deposition, the target was preablated for 2 min at a pulse rate of 5 Hz and a laser fluence of 2 J/cm2. The substrate temperature during the growth was set at 650 °C and the oxygen partial pressure was maintained 0.3 mBar. The deposition was carried out at a pulse rate of 1 Hz and a laser fluence of 2 J/cm2. After the deposition, the samples were cooled to room temperature at a controlled cooling rate of 10 °C/min. These deposition conditions were optimized to result in the growth of the tetragonal phase of SCO and CuO. Reflection high-energy electron diffraction (RHEED) was used to monitor the growth and control the thickness of SLs with uc precision. Figure 4(a) shows the RHEED intensity oscillations during the growth of individual layers (CuO, SCO, and STO) indicating the layer-by-layer growth mode. To grow complete stack of SL structures, the number of laser pulses required for each layer of a specific material was calibrated and then the growth was performed in accordance with the periodicity of SL structure. In Figs. 4(b) and 4(c), we show typical streaky RHEED pattern after the growth of [((SCO)3/(STO)2)20] and [((SCO)8/(STO)2)20] SLs, respectively, signifying 2D growth. The structural characterization of the samples was carried out using x-ray diffraction (XRD), x-ray photoelectron diffraction (XPD), high-resolution scanning transmission electron microscopy (STEM) and composition by electron energy loss (EEL) spectroscopy. High-angle annular dark-field (HAADF), annular bright field (ABF) STEM images, and EEL spectra were acquired using a FEI Titan3 80-300 microscope, equipped with a double aberration corrector. The ABF/ADF images were recorded with an annular detector capturing scattering from 26 to 60 and from 15 to 24 mrad, respectively. The elastic scattering image simulations were obtained using STEMSIM.Reference Rosenauer and Schowalter64 The ionic valence state of Cu was determined by x-ray photoelectron spectroscopy (XPS). Polarized x-ray absorption (XA) spectra were acquired at a beam line of 4.0.2 at the advanced light source in total electron yield mode by monitoring the sample drain current. To avoid charging effects during the XA measurement, the samples for this purpose were grown on Nb-doped (0.05 at.%) STO substrates.
(a) RHEED intensity variation during the growth of individual layers (plots are shifted vertically for clarity). Streaky 2D-like RHEED pattern observed at the end of the growth of (b) [((SCO)3/(STO)2)20] and (c) [((SCO)8/(STO)2)20] SLs, respectively.

III. RESULTS AND DISCUSSIONS
A. Forced epitaxy induced rocksalt type CuO: A new member in the 3d TMMO series
In this section, we discuss about the structural and electronic properties of ultrathin rocksalt type tetragonal CuO (t-CuO) film grown on STO. The induced epitaxial strain from the STO substrate is found to be the underlying factor in stabilizing the tetragonal phase of CuO when the layer thickness is limited to few uc. In situ monitoring of the growth of the CuO films using RHEED demonstrates a transition of the film structure as the film thickness increased (Fig. 5). In the initial part of the growth, we clearly observe a RHEED pattern with elongated spots and not showing reflections characteristic for 3D islands [Figs. 5(a) and 5(b)], which corresponds to the tetragonal structure of CuO.Reference Samal, Tan, Takamura, Siemons, Verbeeck, Tendeloo, Arenholz, Jenkins, Rijnders and Koster20,Reference Siemons, Koster, Blank, Hammond, Geballe and Beasley21 However, as the growth continued, 3D spots gradually appear [Figs. 5(c) and 5(d)], which are presumed to emerge when the film relaxes to its bulk monoclinic phase. In most cases, elongated RHEED patterns were observed when the thickness of the CuO films was limited to a maximum up to 5 uc as monitored by RHEED oscillations. To ensure the growth of a pure CuO phase without the formation of other copper oxide phases (e.g., Cu2O, Cu3O4), we examined Cu valence state using XPS. Distinct satellite structure corresponding to the Cu 2p 3/2 peak [Fig. 5(e)] indicates that copper ions have a formal valence of +2 as expected for CuO and unlike Cu2O.Reference Siemons, Koster, Blank, Hammond, Geballe and Beasley21
Evolution of the RHEED pattern [(a) → (b) → (c) → (d)] during the growth of CuO on STO that clearly shows the transition from a streaky pattern [(a) and (b)] to the onset of 3D spots [(c)] and [(d)]; (a), (b), (c), and (d) correspond to the RHEED pattern after ∼3, 4, 5, and 8 uc of CuO growth, respectively. (e) The Cu 2p core-level XPS spectrum for a CuO film indicating Cu2+ state.

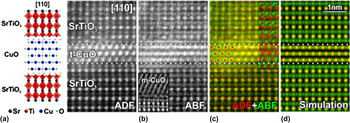
Detailed STEM was carried out to provide further insight into the structure of the ultrathin CuO films. To avoid any damage to the ultrathin CuO film during ion beam processing, it was capped with 20 uc of crystalline STO. Figure 6 shows a HAADF-STEM image for the same along the [100] direction in which the atomic columns of the heavy elements (e.g., Cu, Ti, and Sr) show up as bright spots. The middle CuO layer grows epitaxially with respect to the STO substrate with an atomic arrangement consistent with the projection of the rocksalt structure shown schematically on the left side of Fig. 6. Using the lattice parameter of the STO substrate (a = 3.905 Å) as an internal calibration, we find a- and c-axis lattice parameters of CuO to be of 3.91(2) and 5.25(10) Å, respectively, suggesting an elongated rocksalt type structure. To know the arrangement of the oxygen atoms on a local scale, we carried out ABF-STEM imaging. ABF-STEM imaging collects the low-angle scattered electrons unlike HAADF-STEM which collects electrons scattered to higher angles. As a consequence, ABF-STEM is more sensitive to the light atoms like oxygen whereas HAADF-STEM mostly maps the heavy atoms.Reference Findlay, Shibata, Sawada, Okunishi, Kondo and Ikuhara65 Therefore, the combination of both ABF-STEM and ADF-STEM provides a unique opportunity to simultaneously monitor the position of the oxygen atoms with respect to heavier (Cu, Sr, and Ti) atoms.Reference Aso, Kan, Shimakaw and Kurata12Figure 7(b) shows a simultaneously acquired ABF image (intensity inverted to make the atoms appear as white spots on a dark background) together with its ADF image [Fig. 7(a)] of the CuO film and its neighboring STO layers along the [110] direction. Comparison of ADF and ABF images reveals extra oxygen atomic columns between two Ti columns of STO film [Fig. 7(b)]. Indeed, the ABF image corresponding to the CuO layer also shows extra columns belonging to the oxygen positions lying between two Cu columns. To improve the visibility of the oxygen columns, the intensity-inverted ABF image (in green) is superimposed with the ADF image (in red). The columns containing heavy elements together with oxygen ions are visible as yellow (overlay of red and green) dots whereas the columns containing only oxygen ions are visible in green. We clearly observe the presence of oxygen columns between the heavy Ti columns in the STO layer and between the heavy Cu columns in the CuO layer. This directly confirms the arrangement of the oxygen ions in the CuO layer as illustrated in Fig. 2(a) for the tetragonal CuO. Since the ABF images contain the information of both the heavy and light elements and the ADF only contain that of the heavy elements, the ABF image can be divided by its corresponding ADF image to enhance the visibility of the light elements further. This divided image (in green) was combined again with the ADF image (in red) [Fig. 7(c), inset], which nicely shows the light atomic columns in green and the heavy ones in red. The average O–Cu–O bond angle estimated from the image is found to be 180 ± 2°. The simulated image assuming the structural model agrees well with the experimental result as shown in Fig. 7(d).
HAADF-STEM images along the [100] direction. A tetragonal structure model matching the observations is shown on the left side. [Image is taken from Ref. Reference Samal, Tan, Takamura, Siemons, Verbeeck, Tendeloo, Arenholz, Jenkins, Rijnders and Koster20.]

(a) ADF image showing the atomic columns of the heavy atoms along the [110] direction (Sr, Ti, and Cu). (b) The reversed ABF image acquired simultaneously with the ADF image shows the atomic columns of light elements (oxygen) together with those of heavy elements. The inset shows a reversed ABF image of a thicker CuO film on the STO substrate. It has collapsed to its ordinary monoclinic structure which is clearly different from the tetragonal structure of ultrathin CuO film. (c) Combined color map with ADF in red and reversed ABF image in green. The heavy element columns together with oxygen were combined to be yellow after color mixing while the O columns remain green. The inset is a combined color map with the ADF image in red and oxygen-enhanced ABF image in green. The Cu and O positions are illustrated with red and green disks on the left of the CuO layer. (d) Simulation of the ADF and the reversed ABF images. A tetragonal structure model along the [110] direction is shown on the left hand side. [Image is taken from Ref. Reference Samal, Tan, Takamura, Siemons, Verbeeck, Tendeloo, Arenholz, Jenkins, Rijnders and Koster20.]

To probe the electronic structure and symmetry of the unoccupied Cu 3d orbital for the novel tetragonal phase of CuO, we performed XA spectroscopy using linearly polarized x-rays. In these measurements, electrons are excited from a selected core shell to an empty state of the absorbing transition metal upon the irradiation of x-rays with the appropriate resonance energy. The transition intensity scales with the number of empty states being probed. Since the orientation of the p and d orbitals is not spherically symmetric in space, the probability of an electron transition strongly depends also on the orientation of the E vector of the linearly polarized x-rays with respect to the Cu–O coordination and the films' crystalline axes. By changing the direction of the x-ray polarization (E vector) relative to the sample surface, one can probe the angular dependence of the empty valence states. Therefore, using vertically or horizontally polarized x-rays oriented along the in-plane [100] direction (i.e., the E vector aligned along the in-plane [010] direction and canted out-of-plane by 30° relative to the [001] direction) in grazing incidence geometry, we can probe in-plane d x2−y2 or the out-of-plane 3d z2 orbitals at the Cu site, respectively.
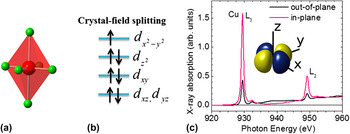
Since the Cu ion in case of tetragonal CuO is surrounded by an elongated oxygen octahedron (c/a > 1), the eg orbitals (d x2−y2, d z2) split to remove the orbital degeneracy as schematically shown in Fig. 8(b). This orbital configuration arises because the elongation along the c-axis lowers the Coulomb energy associated with the electrons in the 3d z2 orbital. Therefore, the hole [Cu2+(d9)] at the Cu site is expected to be localized at an egd x2−y2 orbital for this novel phase, similar to what is generally observed in the case of high-T c cuprate members. In Fig. 8(c), we show XA spectra for the tetragonal CuO films at the Cu L2,3 edges with the E vector aligned in-plane or canted out-of-plane. The peaks at the Cu L2,3 edges (i.e., at about 930 and 950 eV) correspond to transitions from the Cu 2p 3/2 to Cu 3d and Cu 2p 1/2 to Cu 3d orbitals, respectively. These transitions are commonly referred to as 2p 63d 9 → 2p 53d 10, where an electron from the Cu 2p orbital is promoted to the 3d orbital after absorbing a photon.Reference Di Castro, Salvato, Tebano, Innocenti, Aruta, Prellier, Lebedev, Ottaviani, Brookes, Minola, Moretti Sala, Mazzoli, Medaglia, Ghiringhelli, Braicovich, Cirillo and Balestrino58,Reference Sarma, Strebel, Simmons, Neukirch, Kaindl, Hoppe and Muller66–Reference Salluzzo, Ghiringheli, Brookes, De Luca, Fracassi and vaglio69 We observe a strong dependence of the spectral intensity on the polarization direction, i.e., a higher absorption when E is aligned in-plane compared to when it cants out-of-plane. The observed large asymmetry in the spectral intensity gives direct evidence that most of the Cu sites have holes occupying the d x2−y2 orbital. This is unlike the case for the monoclinic phase of CuO where the hole is reported to occupy the egd z2 orbital.Reference Filippetti and Fiorentini70 In essence, the results of polarized XAS in relation to the hole occupation at the Cu site are in agreement with the discussion based on tetragonal crystal field splitting of the d orbital energy levels as sketched in Fig. 8(b) and hence corroborate the tetragonal structure of CuO with c/a >1.
Schematics for (a) elongated CuO6 octahedron surrounding Cu ion, (b) relevant tetragonal crystal field split energy levels with electronic occupation of d orbitals at the Cu site (d xz and d yz shown as degenerate), and (c) polarized XA spectra for a tetragonal CuO film. The inset shows the schematic for the d x2−y2 orbital where the hole at the Cu site is preferentially localized. [XAS spectra are originally from Ref. Reference Samal, Tan, Takamura, Siemons, Verbeeck, Tendeloo, Arenholz, Jenkins, Rijnders and Koster20.]

B. Polarity induced atomic rearrangement in ultrathin SCO layers: plane versus chain-type structures
In this section, we demonstrate the experimental evidence for a structural transformation from planar to chain type structure upon reducing the SCO layer thickness. This process is realized via oxygen rearrangement which gives rise to a larger c-axis parameter for the modified structure as described in the Introduction [Fig. 3]. To illustrate this effect experimentally, we first present the results of the structural investigation using XRD on ((SCO)m/(STO)2)20 SLs where m equals the number of uc of SCO that varies from 3–16. The SLs show the signature of distinct satellite peaks which demonstrates the structural quality of the SLs.Reference Samal, Tan, Molegraaf, Kuiper, Siemons, Bals, Verbeeck, Tendeloo, Takamura, Arenholz, Jenkins, Rijnders and Koster48 In Fig. 9, we show the average c-axis lattice parameter as a function of the SCO thickness (m) in the SLs. The average c-axis lattice parameter is estimated from the zeroth order satellite peak position. It is evident that the c-axis lattice parameter follows a decreasing trend as m increases, ranging from 3.84 to 3.36 Å for ((SCO)3/(STO)2)20 and ((SCO)8/(STO)2)20), respectively. However, for m ≥ 8, the average c-axis lattice parameter remarkably levels out at a value close to the expected bulk SCO value (a = b = 3.926 Å and c = 3.432 Å).Reference Takano, Takeda, Okada, Miyamoto and Kusaka43 The increase in the average c-axis lattice parameter at lower m suggests that the SCO layers undergo a gradual structural transformation to chain-type structure characterized by an elongation along the c-axis.
Average c-axis lattice parameter as a function of SCO thickness for ((SCO)m/(STO)2)20 SLs. The horizontal dashed-line marks the reported bulk c-axis lattice parameter for IL SCO. [Data taken from Ref. Reference Samal, Tan, Molegraaf, Kuiper, Siemons, Bals, Verbeeck, Tendeloo, Takamura, Arenholz, Jenkins, Rijnders and Koster48.]

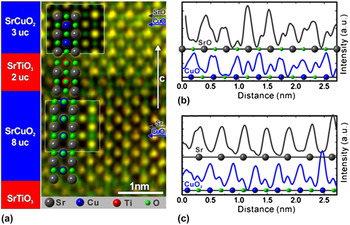
To have further insight into the structural aspects precisely, we carried out an elaborate STEM investigation on a hybrid SL that consists of both plane and chain-type SCO layers separated by STO layers: [((SCO)8/(STO)2/(SCO)3/(STO)2)10]. This particular SL structure was designed because it gives us an additional flexibility to directly compare the variation of the structural parameters as well as oxygen co-ordination with the SCO thickness variation in the same film. The c-axis lattice parameter for the (SCO)8 layers as measured from HAADF-STEM is found to be 3.43(3) Å, which is 10% less than that of the (SCO)3 layers (3.83(3) Å) present in the same SL structure.Reference Samal, Tan, Molegraaf, Kuiper, Siemons, Bals, Verbeeck, Tendeloo, Takamura, Arenholz, Jenkins, Rijnders and Koster48 This clearly illustrates the structural difference between (SCO)8 and (SCO)3 layers and strongly corroborates the findings based on XRD study. Since the arrangement of the oxygen atoms varies distinctly between chain and plane-type SCO layers, it is important to directly identify the oxygen ions on a local scale. For this reason, we carried out ABF-STEM imaging. Such a superimposed color map is presented in Fig. 10(a) with the low-angle scattering events (ABF-STEM) in green and the high-angle (HAADF-STEM) ones in red. The columns containing heavy elements (Sr, Cu, and Ti) together with oxygen atoms are visible as yellow (overlay of red and green) dots whereas the columns containing only oxygen atoms are visible in green. We clearly observe the oxygen columns between all the heavy atomic columns in (SCO)3 and (STO)2 layers, but no oxygen belonging to Sr-planes present in the (SCO)8 layer. This directly confirms the planar-arrangement of the oxygen atoms in the (SCO)8 layer as schematically shown in Fig. 3(a). However, the arrangement of the oxygen atoms in (SCO)3 follows chain-type structure [Fig. 3(b)] having apical oxygen surrounding Cu ions. Simulated images assuming these structures are shown to guide the reader in interpreting the subtle differences visible in Fig. 10(a). For the sake of clarity, we also show ABF line profile [Figs. 10(b) and 10(c)] through the SrO, CuO, Sr, and CuO2 planes that indicate the oxygen positions (marked by green dots) and appear as extra peaks in the ABF signal.
(a) Combined color map from the simultaneously acquired ADF (red) and inverted intensity ABF image (green). The yellow peaks indicate the heavy elements (Sr, Cu, and Ti) while the green peaks highlight the light elements (O). A clear structural difference is seen between the SCO3 (chain) and the SCO8 (planar) layer, which is confirmed by comparing to simulated images (insets) in the respective layers. A structural model is overlaid. (b) ABF line profile through the SrO plane (gray) and CuO plane (blue) in the (SCO)3 layer as indicated by gray and blue arrows. (c) ABF line profile through the Sr plane (gray) and CuO2 plane (blue) in the (SCO)8 layer as indicated by gray and blue arrows. The oxygen positions are marked by green dots and appear as extra peaks in the ABF signal. [Image (a) is taken from Ref. Reference Samal, Tan, Molegraaf, Kuiper, Siemons, Bals, Verbeeck, Tendeloo, Takamura, Arenholz, Jenkins, Rijnders and Koster48.]

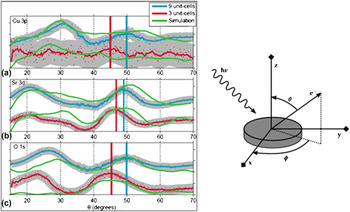
Based on structural investigation, it is evident that there occurs a transformation from plane to chain-type structure upon reducing the SCO thickness. To know how the Cu electronic structure and symmetry of the unoccupied Cu 3d orbital get modified when SCO undergoes a structural transformation to chain-type structure, we performed XA spectroscopy using linearly polarized x-rays. In Fig. 11, we show XA spectra at the Cu L2,3 edges for ((SCO)3/(STO)2)10 and ((SCO)8/(STO)2)5 SLs with the E vector aligned in-plane and canted out-of-plane relative to the c-axis of the SL. For ((SCO)8/(STO)2)5 SL [Fig. 11(a)], we observe a strong dependence of the spectral intensity on the polarization direction, i.e., a stronger absorption when E is aligned in-plane compared to that when it cants out-of-plane, respectively. Such asymmetry indicates that most of the Cu sites have holes occupying the d x2−y2 orbital. Besides Cu L3 white light transition, a second significantly weaker peak is observed ∼4.6 eV higher in energy corresponding to a small content of monovalent Cu.Reference Hawthorn, Shen, Geck, Peets, Wadati, Okamoto, Huang, Huang, Lin, Denlinger, Liang, Bonn, Hardy and Sawatzky68,Reference Salluzzo, Ghiringheli, Brookes, De Luca, Fracassi and vaglio69,Reference Nücker, Pellegrin, Schweiss, Sohmen, Fink, Molodtsov, Simmons, Domke, Kaindl, Frientrup, Chen, Erb and Müller-Vogt71 However for ((SCO)3/(STO)2)10) SL [Fig. 11(b)], the absorption peak intensity and spectral shape are found to be nearly identical irrespective of the orientation of the E and no linear dichroism is observed. This indicates that both d x2−y2 and d z2 orbitals are equally populated and such observation could be directly linked to the presence of apical oxygen in the chain-type SCO layers unlike the planar one. Moreover, the Cu spectra are characterized by two weak peaks, namely the monovalent Cu peak and a shoulder at ∼1.4 eV above the main peak. The shoulder above ∼1.4 eV the main peak position is assigned to 3d 10L final state configuration, where L denotes a 2p hole at the oxygen sites arising out of Cu3d–O2p hybridization.Reference Di Castro, Salvato, Tebano, Innocenti, Aruta, Prellier, Lebedev, Ottaviani, Brookes, Minola, Moretti Sala, Mazzoli, Medaglia, Ghiringhelli, Braicovich, Cirillo and Balestrino58,Reference Chen, Tjeng, Kwo, Kao, Rudolf, Sette and Fleming67–Reference Salluzzo, Ghiringheli, Brookes, De Luca, Fracassi and vaglio69 XAS results provide profound difference in relation to hole occupation at the Cu site between [(SCO)8/(STO)2)]10 and [((SCO)3/(STO)2)10] SLs and this goes in line with our finding of apical oxygen ions surrounding the Cu ion in (SCO)3 layers. One might think that there could be additional factors such as oxygen defects and/or the interfacial oxygenReference Di Castro, Salvato, Tebano, Innocenti, Aruta, Prellier, Lebedev, Ottaviani, Brookes, Minola, Moretti Sala, Mazzoli, Medaglia, Ghiringhelli, Braicovich, Cirillo and Balestrino58,Reference Aruta, Ghiringhelli, Dallera, Fracassi, Medaglia, Tebano, Brookes, Braicovich and Balestrino72,Reference Aruta, Schlueter, Lee, Di Castro, Innocenti, Tebano, Zegenhagen and Balestrino73 (that can give rise to the apical site for Cu ions), which can contribute to the XA spectra. However, these secondary effects cannot fully account for such a marked difference. To further elucidate this issue and justify that the observed phenomena are not an interfacial effect, we examined and compared the structural parameters between two bare SCO single layers, where one is 3 uc thick and the other is 9 uc thick, by performing the in situ XPD study.Reference Kuiper, Samal, Blank, ten Elshof, Rijnders and Koster59 XPD is a highly suitable technique that can be used to derive the structural information of ultrathin films. In this process, x-rays of sufficient energy are illuminated on the sample to excite the core electrons of atoms within the sample and the intensity of emitted photoelectron is usually studied either by changing the azimuthal or polar angle (see Fig. 12). The photoelectrons scattered from the neighboring surrounding atoms can interfere and give rise to the diffraction pattern. Therefore, using this technique one can study the nature of surrounding of each element in the sample. High-resolution XPD scans for Cu-2p, Sr-3d, and O-1s electrons of both SCO films are depicted in Fig. 12 as a function of θ (emission angle/polar angle). A clear shift in θ peak positions in the O 1s and Sr 3d scans is observed when compared between 3 and 9 uc SCO films, indicating comparatively larger c-axis lattice parameter for 3 uc SCO layer. For clarity, the peak positions are indicated by vertical lines. From the analysis of XPD spectra, we find that the c-axis lattice parameter for 3 uc SCO is longer by ∼0.5 Å than that of the 9 uc SCO layer and this is in well agreement with our findings based on the study of SCO/STO SLs. Hence, it clearly suggests that the oxygen rearrangement occurs well within the SCO layer. A detailed discussion about the analysis and interpretation of XPD results on SCO thin films can be found from the recent published work by Kuiper and co-workers.Reference Kuiper, Samal, Blank, ten Elshof, Rijnders and Koster59 Had the chain-type transformation been only an interfacial effect, we would not have noticed an increase in c-axis lattice parameter corresponding to chain-type structure in the bare 3 uc single layer SCO film. Thus, we clearly view a thickness-dependent structural transformation via oxygen-rearrangement throughout the bulk of the SCO layer. Our finding does not agree with the recent report by Aruta et al.Reference Aruta, Schlueter, Lee, Di Castro, Innocenti, Tebano, Zegenhagen and Balestrino73 where they hypothesize on another mechanism via oxygen redistribution in the interfacial planes, to explain their experimental results studied using hard x-ray photoelectron spectroscopy on (CaCuO2/STO) SLs. The differences could be related to different oxidizing growth conditions used and moreover the system investigated by Aruta et al.Reference Aruta, Schlueter, Lee, Di Castro, Innocenti, Tebano, Zegenhagen and Balestrino73 is as well different than that of us.
Polarized XA spectra for (a) ((SCO)8/(STO)2)5 and (b) ((SCO)3/(STO)2)10 SLs. The insets show schematics for the d-orbitals where the hole is preferentially localized. The left hand side shows a sketch for the XAS process for 2p → 3d transition. The right hand side schematics represent the corresponding plane and chain-type configurations for (SCO)8 and (SCO)3 layers, respectively (red and blue spheres correspond to oxygen and copper, respectively). [XAS spectra are originally from Ref. Reference Samal, Tan, Molegraaf, Kuiper, Siemons, Bals, Verbeeck, Tendeloo, Takamura, Arenholz, Jenkins, Rijnders and Koster48.]

XPD pattern (both experiment and simulation) for 3 and 9 uc thick SCO films. θ scans are shown for (a) Cu-3p, (b) Sr-3d, and (c) O-1s. The dots are measured data points, similar colored solid lines are acquired by applying a 9-point moving average. Multiple scattering electron diffraction simulation results are shown in green. The right-hand image schematically indicates the XPD measurement geometry, where θ is a polar angle and Φ is an azimuthal angle. [Image is taken from Ref. Reference Kuiper, Samal, Blank, ten Elshof, Rijnders and Koster59.]

IV. SUMMARY AND CONCLUSIONS
We have demonstrated novel routes by which the oxygen sublattice in ultrathin films of two ideal cuprate members (CuO and SCO) can be rearranged in a controlled way. By imposing epitaxial strain from the STO substrate to ultrathin CuO layers, we illustrate the stabilization of tetragonal rocksalt type CuO structure, which is very much different from its bulk counterpart. Specifically, the findings based on STEM study directly reveal that the unit cell of ultrathin CuO layers is elongated along the c-axis (c/a ∼ 1.34) and has a Cu–O–Cu bond angle, ϕ = 180 ± 2°. Structural findings are complemented with polarized XAS experiments that clearly reveals the d x2−y2 hole symmetry at Cu site and this goes in line considering the tetragonal crystal field splitting of the d orbitals. The direct evidence for the existence of a high-symmetry tetragonal CuO, a benchmark system, will encourage experiments to probe its novel electronic property and trigger doping experiments in the quest for high-T c superconductivity. In case of SCO thin films, we demonstrate the possibility for a structural transformation (plane to chain-type), where the geometry of CuO4 plaquettes is rotated by 90° at ultralow thickness limit. This phenomenon turns out to be a direct response to electrostatic instability associated with IL polar cuprates. The modified chain-type structure acquires oxygen in the Sr plane providing an apical site for Cu ion, very similar to what is generally observed for chain type Cu–O blocks in high-T c superconducting materials. A detailed structural study based on XRD, XPD, and STEM clearly reveals an increase in c-axis lattice parameter by ∼0.5 Å and the presence of oxygen ions in the Sr-plane for ultrathin SCO films contrary to their bulk counterpart. A combination of ABF and ADF imaging has been used to directly visualize the change in oxygen positions as the thickness of SCO layer is varied. Structural findings are also complemented with polarized XAS experiments that clearly distinguishes the plane and chain-type SCO structures with respect to hole distribution at Cu-site. For plane-type SCO structure, the hole is localized in d x2−y2 orbital. However, for chain-type SCO layers, both d x2−y2 and d z2 orbitals are equally populated. The presence of apical oxygen surrounding the Cu ion in the chain-type SCO layer provides the basis for having higher density of out-of-plane holes as compared to the planar case. We strongly believe that our experimental findings on SCO ultrathin films will trigger activities in making novel artificial Cu-based high-T c superconductors, where the charge reservoir layer can be constituted by the ultrathin SCO layers having apical oxygen. Artificial cuprate structures having altered chain and plane-type layers (the basic building blocks in cuprates) will be model systems to explore interesting electronic properties, with specific aim to look for enhanced superconducting properties. Moreover, since we know that the magnetism in cuprates strongly depends upon oxygen co-ordination surrounding the Cu ion and Cu–O–Cu angle, it will be very much encouraging to investigate the associated magnetic property that can emerge from these novel i.e., both rocksalt type CuO as well as chain-type SCO structures. It has been brought to our attention that an angle-resolved photoemission spectroscopy of tetragonal CuO has been published by Moser et al.Reference Moser, Moreschini, Yang, Innocenti, Fuchs, Hansen, Chang, Kim, Walter, Bostwick, Rotenberg, Mila and Grioni74
ACKNOWLEDGMENTS
The authors would like to acknowledge fruitful discussions with Y. Takamura, J. Verbeeck, H. Tan, G. Rijnders, H. Molegraaf, W. Siemons, B. Kuiper, and Z. Zhong. D.S. and G.K gratefully acknowledge financial support from AFOSR and EOARD project (project number: FA8655-10-1-3077).