I. INTRODUCTION
The Fe-based superconductor has attracted much attention since first iron-compound LaFeAsO1−x F x with layered structure was discovered in 2008 (Kamihara et al., Reference Kamihara, Watanabe, Hirano and Hosono2008). In this family, β-FeSe with the simplest structure and nontoxicity has been considered to be the optimal experiment object for exploring the superconducting mechanism in this layer system. (Hsu et al., Reference Hsu, Luo, Yeh, Chen, Huang, Wu, Lee, Huang, Chu, Yan and Wu2008; Margadonna et al., Reference Margadonna, Takabayashi, Ohishi, Mizuguchi, Takano, Kagayama, Nakagawa, Takata and Prassides2009; Patel et al., Reference Patel, Hua, Yu, Avci, Xiao, Claus, Schlueter, Vlasko-Vlasov, Welp and Kwok2009; Guo et al., Reference Guo, Jin, Wang, Wang, Zhu, Zhou, He and Chen2010; Jung et al., Reference Jung, Lee, Choi, Kang, Lee, Hwang and Kin2010; Sun et al., Reference Sun, Chen, Guo, Gao, Huang, Wang, Fang, Chen, Chen, Wu, Zhang, Gu, Dong, Wang, Yang, Li, Dai, Mao and Zhao2012). Meanwhile, FeTe, another iron chalcogenide which is structurally isomorphic with β-FeSe, is not superconducting. Even so, the superconductivity could still be induced by the Se or S substitution on Te-site in binary FeTe (Mizuguchi et al., Reference Mizuguchi, Tomioka, Tsuda, Yamaguchi and Takano2009a). Several works have been done to investigate the variation of the superconductivity with changing the doping level of Se and S in the FeTe1−x X x (X = Se, S) system. The maximum T c shows around 14 K (Fang et al., Reference Fang, Pham, Qian, Liu, Vehstedt, Liu, Spinu and Mao2008; Yeh et al., Reference Yeh, Huang, Huang, Chen, Hsu, Wu, Lee, Chu, Chen, Luo, Yan and Wu2008) with the composition FeTe0.5Se0.5, while the T c was induced to 10 K by doping sulfur with 20% content.
Accurate limit of the solid solubility is essential for the study on the doping influence, which is necessary for the preparation of the pure samples. However, the limit of solid solubility in FeTe1−x X x (X = Se, S) system is still contradictory in different literatures: in FeTe1−x Se x system, Fang et al. (Reference Fang, Pham, Qian, Liu, Vehstedt, Liu, Spinu and Mao2008) reported a maximal doping level of Se-doping at x = 0.7, whereas Viennois et al. (Reference Viennois, Gianninim, Marel and van der Cerny2010) failed to obtain the sample with single phase when x is larger than 0.5. A similar situation has also been found in the FeTe1−x S x system. Some works studied this system with the composition FeTe0.8S0.2 (Mizuguchi et al., Reference Mizuguchi, Tomioka, Tsuda, Yamaguchi and Takano2009b; Mizuguchi et al., Reference Mizuguchi, Deguchi, Tsuda, Yamaguchi and Takano2010a, Reference Mizuguchi, Deguchi, Tsuda, Yamaguchi and Takanob), but Zajdel et al. (Reference Zajdel, Hsieh, Rodriguez, Butch, Magill, Paglione, Zavalij, Suchomel and Green2010) pointed out that the end of the solid solution was measured at x = 0.15, out of which the hexagonal impurity would appear. These contradictions denoted that the results in the previous works are flawed, considering that the measurement was carried out on multiphase samples. Furthermore, off-stoichiometry of FeTe could be observed in the Fe–Te binary-phase diagram (Okamoto et al., Reference Okamoto and Tanner1990), which suggests that small amount of the interstitial Fe atoms is needed in the structure to stable the structure. This induces that another dimension of solid solution with the changing of the Fe content in the FeTe1−x X x (X = Se, S) system with fixed anion composition. Thus, in order to obtain the pure samples, the limit of solid solution is needed to be clarified, and a systematic study on superconductivity with both variational x and y in Fe y Te1−x X x systems is also needed to be performed.
To this aim, we present a systematic study on the solid solution, lattice parameters and superconductivity on the Fe y Te1−x X x (X = Se, S) system. It has been found that the limit of the Te-site doping with Se and S is about 0.5 and 0.15, respectively. The solid solution with the Fe content changing is also measured in this work. Based on the magnetic susceptibility measurements, we presented a three-dimensional (3D) graph for showing the variation of superconductivity vs. both chalcogen and Fe content.
II. EXPERIMENTAL
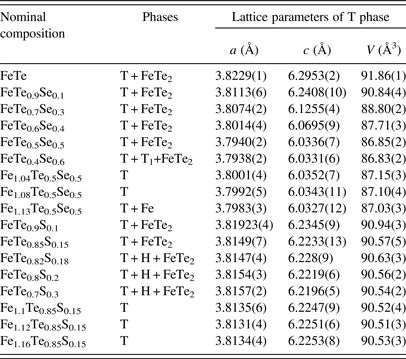
Polycrystalline samples with 17 compositions (listed in Table I) were prepared by solid state reaction. The pure powders of Fe (spectrum pure 99.99%), Se (99.95%), Te (99.999%), and S (99.5%), which are the products of China National Accord Medicines Corporation, were mixed and ground in an agate mortar, cold-pressed into disk (diameter is 10 mm) with 200 kg cm−2 uniaxial stress. Afterwards, all samples were sealed in quartz tube under vacuum and heated to 900 °C for 48 h. Then samples were quickly transferred into preheated furnaces with temperature at 400 °C, kept for 48 h and quenched in ice water.
The lattice parameters and T c of all the samples

T represents the tetragonal doped-FeTe; T1 represents another tetragonal phase; H represents the hexagonal phase.
Powder X-ray diffraction (XRD) data for phase identification were collected at room temperature on a PANalytical diffractometer (X'Pert PRO MRD) with CuKα radiation (40 kV, 40 mA) and a graphite monochromator in a reflection mode (2θ =10–80°, step = 0.017° 2θ). Indexation for obtaining the lattice parameters was performed using the FullProf program (Rodriguez-Carvajal, Reference Rodriguez-Carvajal2003).
The electrical resistivity was measured from 5 to 300 K via a four-probe method using a closed-cycle refrigerator. Temperature dependence of magnetization was measured from 2 to 30 K by Superconducting Quantum Interference Device (SQUID) magnetometer MPMS XL-7 EC with the field H = 40 Oe after cooling in the zero field.
III. RESULTS AND DISCUSSION
The XRD patterns of the tow typical compositions: FeTe0.85S0.15 and FeTe0.85S0.15 are shown in Figure 1. The main phase of both two samples shows tetragonal structure with space group P4/nmm. The diffraction peak of FeTe2 could be observed as the impurity (ICS-PDF 51-1158). As mentioned before, this is because of off-stoichiometry of the iron telluride. For the determination of the limit of solid solution, the partial patterns with various Se/S content x are shown as inset. The partial patterns of Fe y Te1−x Se x were also shown in the upper inset, and it can be seen that (101) peak of tetragonal phase separated into two when the x increase to 0.6 with Se doping, suggesting that the composition is already out of the doping limit with another tetragonal phase formed. For Fe y Te1−x S x as shown in lower inset, the (101) peak of hexagonal phase appeared when the x increased to 0.18 with S doping, showing the sulfur is unable to enter the tetragonal structure anymore.
XRD patterns of the FeTe1−x Se x and FeTe1−x S x samples. Impurity FeTe2 is marked as “#”.

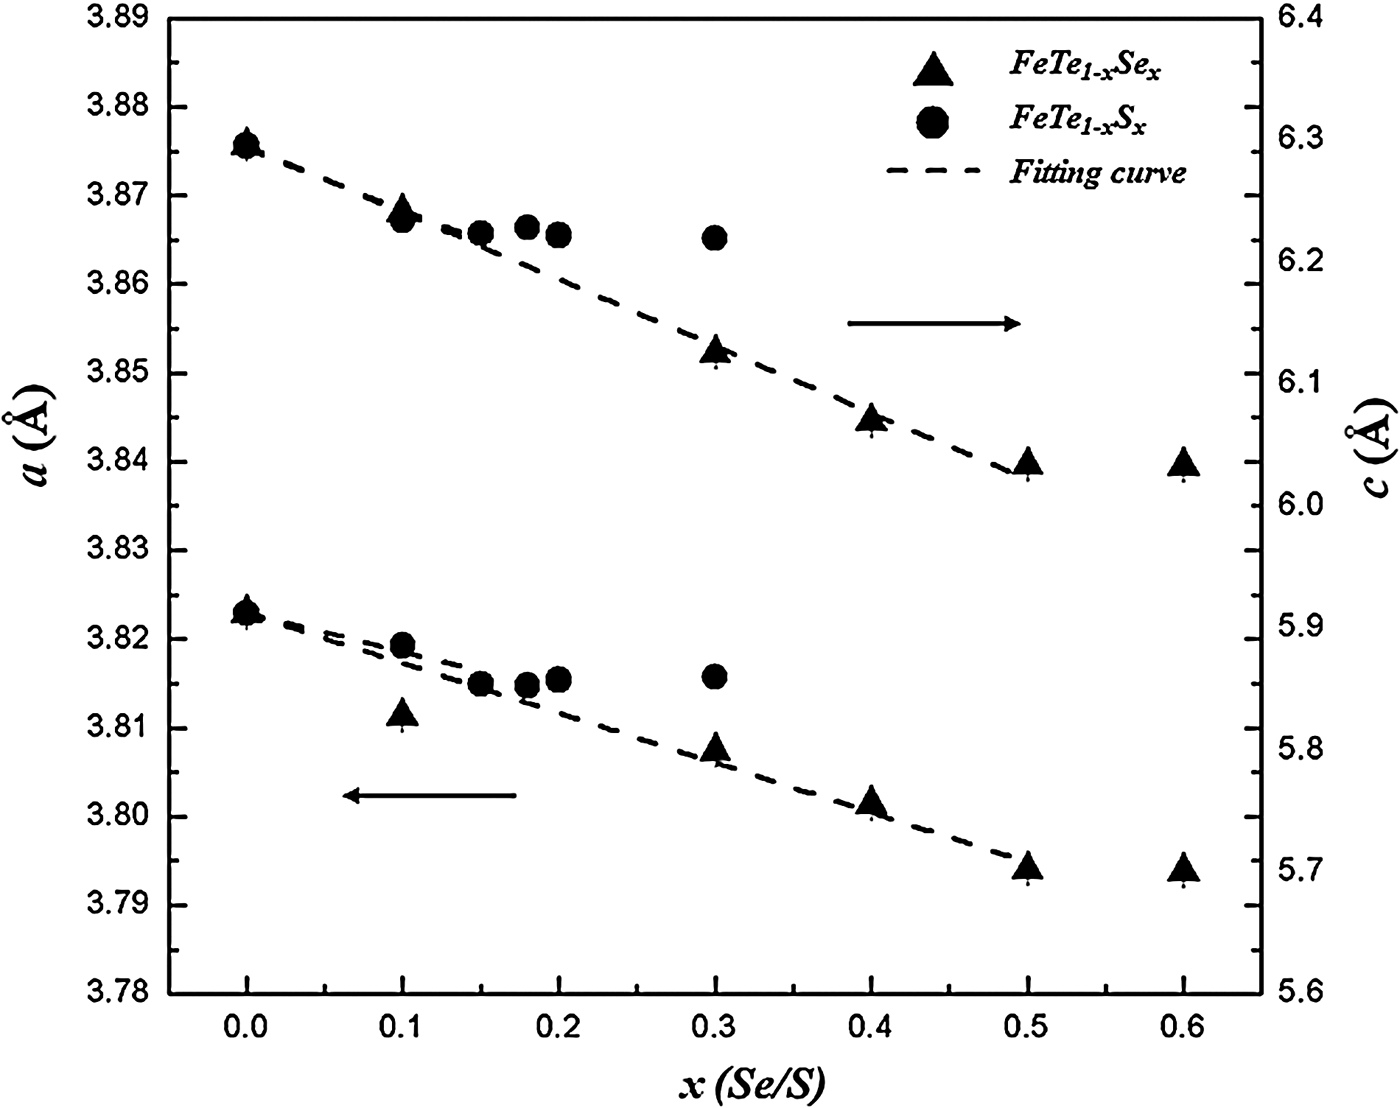
In order to determine the accurate limit of Fe y Te1−x Se x and Fe y Te1−x S x , the lattice parameters of the tetragonal doped-FeTe were obtained by indexing the XRD patterns and the results were listed in Table I and plotted in Figure 2. It can be seen that both the lattice parameters a and c decrease linearly with the increasing of the doping level. It is quite unexpected that the compression extent of the lattice by Se is nearly the same with that of S with the same doping content, despite the larger atomic radii of S2−. This could be explained by the change of length of the chemical bond. However, the doping limit of Se and S is quite different. The parameters of Fe y Te1−x Se x show basically the constant values when x > 0.5, while the value is x > 0.15 in the S-doping case, indicating that the limit of the solid solution is around 0.5 and 0.15 in FeTe1−x Se x and FeTe1−x S x , respectively. It should be noted that the smaller doping limit using S as dopant could be resulted from the unmatched ionic radii of Te2− and S2−.
Lattice parameters a and c vs. the Te-site doping level in FeTe1−x Se x and FeTe1−x S x .

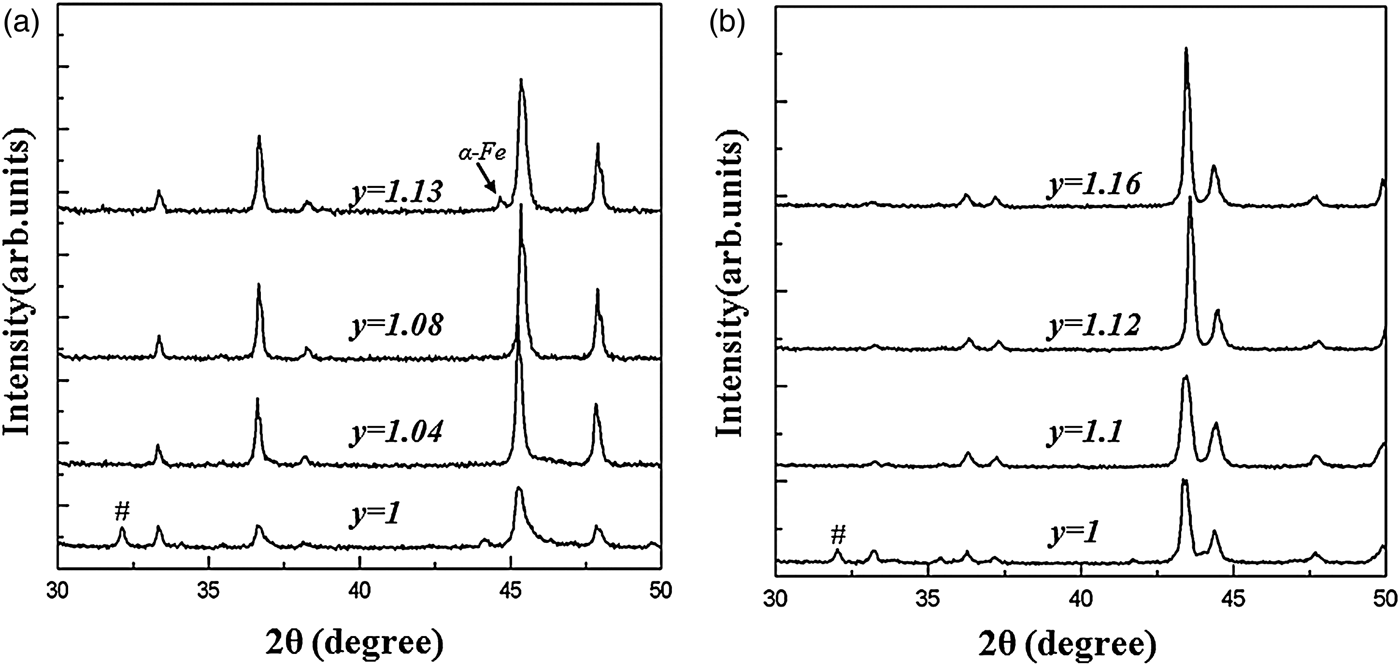
The solid solution with the variation of the Fe content has also been measured in these two systems, with the limit content x: Fe y Te0.85Se0.5 and Fe y Te0.5S0.15. Samples with different y were measure by XRD, and the partial patterns are shown in Figure 3. Figure 3(a) shows the patterns of Fe y Te0.85Se0.5, where it can be seen that the diffraction peak of FeTe2 disappeared with the Fe adding into the samples with y = 1.04. As the y increased, the diffraction peak of iron appeared (Jade PDF#65-2574) in Fe y Te0.5Se0.5 with y = 1.13, indicating that the limit of the solid solution region has been crossed. For Fe y Te0.85Se0.15 in Figure 3(b), reflections of FeTe2 disappeared with a larger amount of excess Fe added. The diffraction peak of pure iron was not observed unit y increased to 1.16.
Partial XRD of (a) Fe y Te0.5Se0.5, and (b) XRD of Fe y Te0.85Se0.15.

Based on the limit of the solid solution obtained in this work, the composition for preparing the polycrystalline samples on Fe y Te1−x X x (X = Se, S) with single phase was recommended in Figure 4, where it can be seen that both the solid solution are off-stoichiometry, toward to the Fe-rich side. It is noted that the solution limit of binary FeTe in Figure 4 was carried from the literature (Okamoto et al., Reference Okamoto and Tanner1990).
The solid solution region of the Fe y Te1−x X x (X=Se, S) tetragonal phase (the solution limit of binary FeTe was carried from the literature).

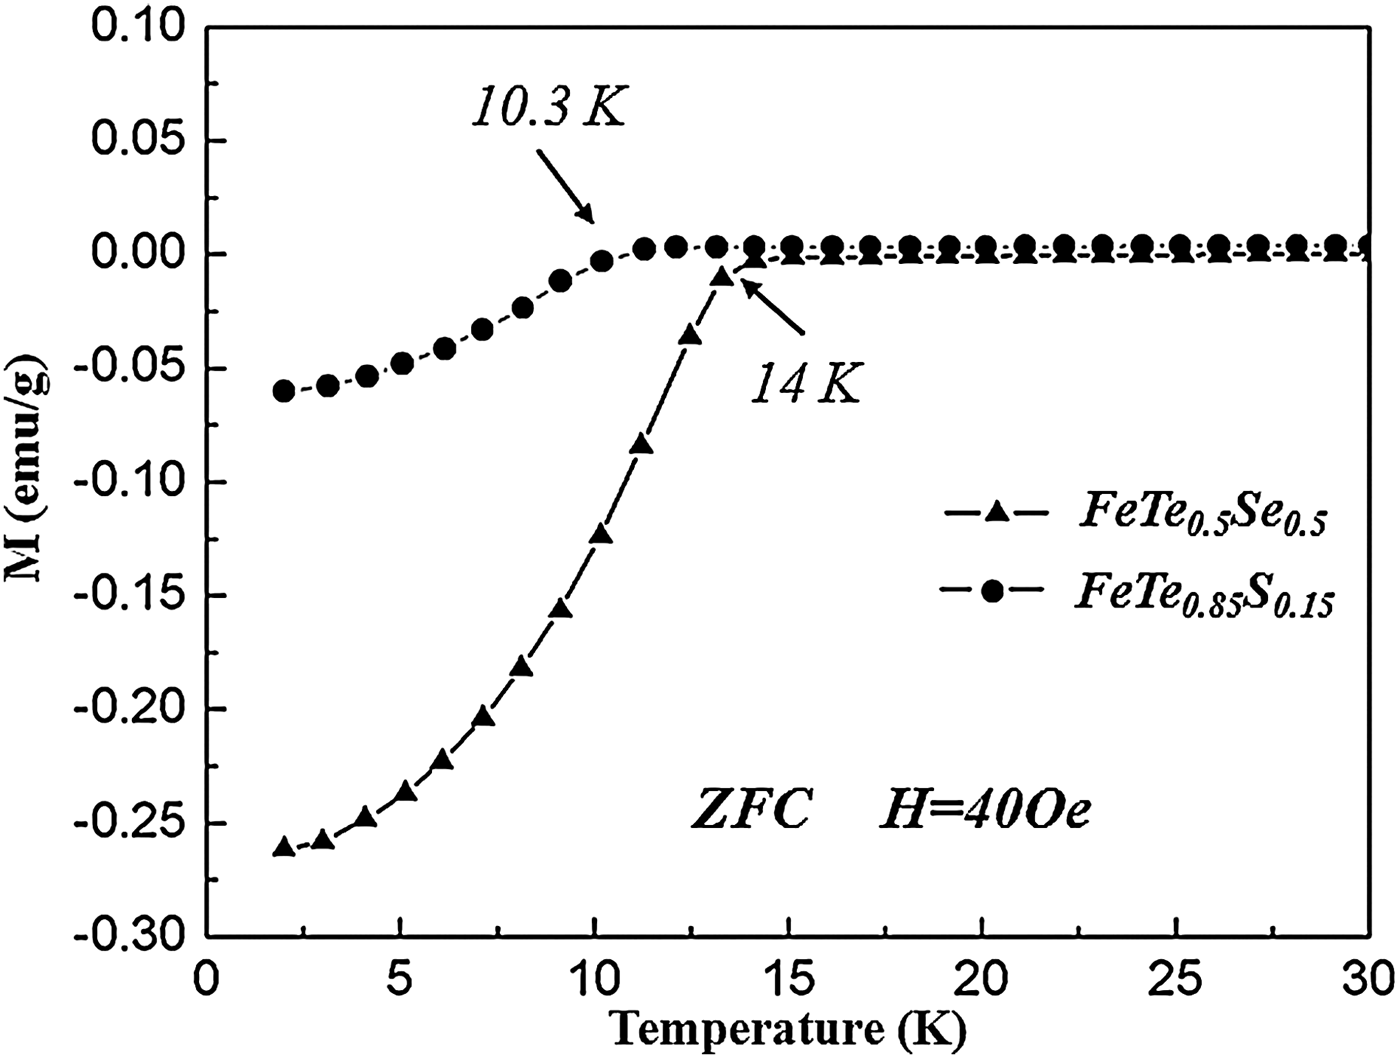
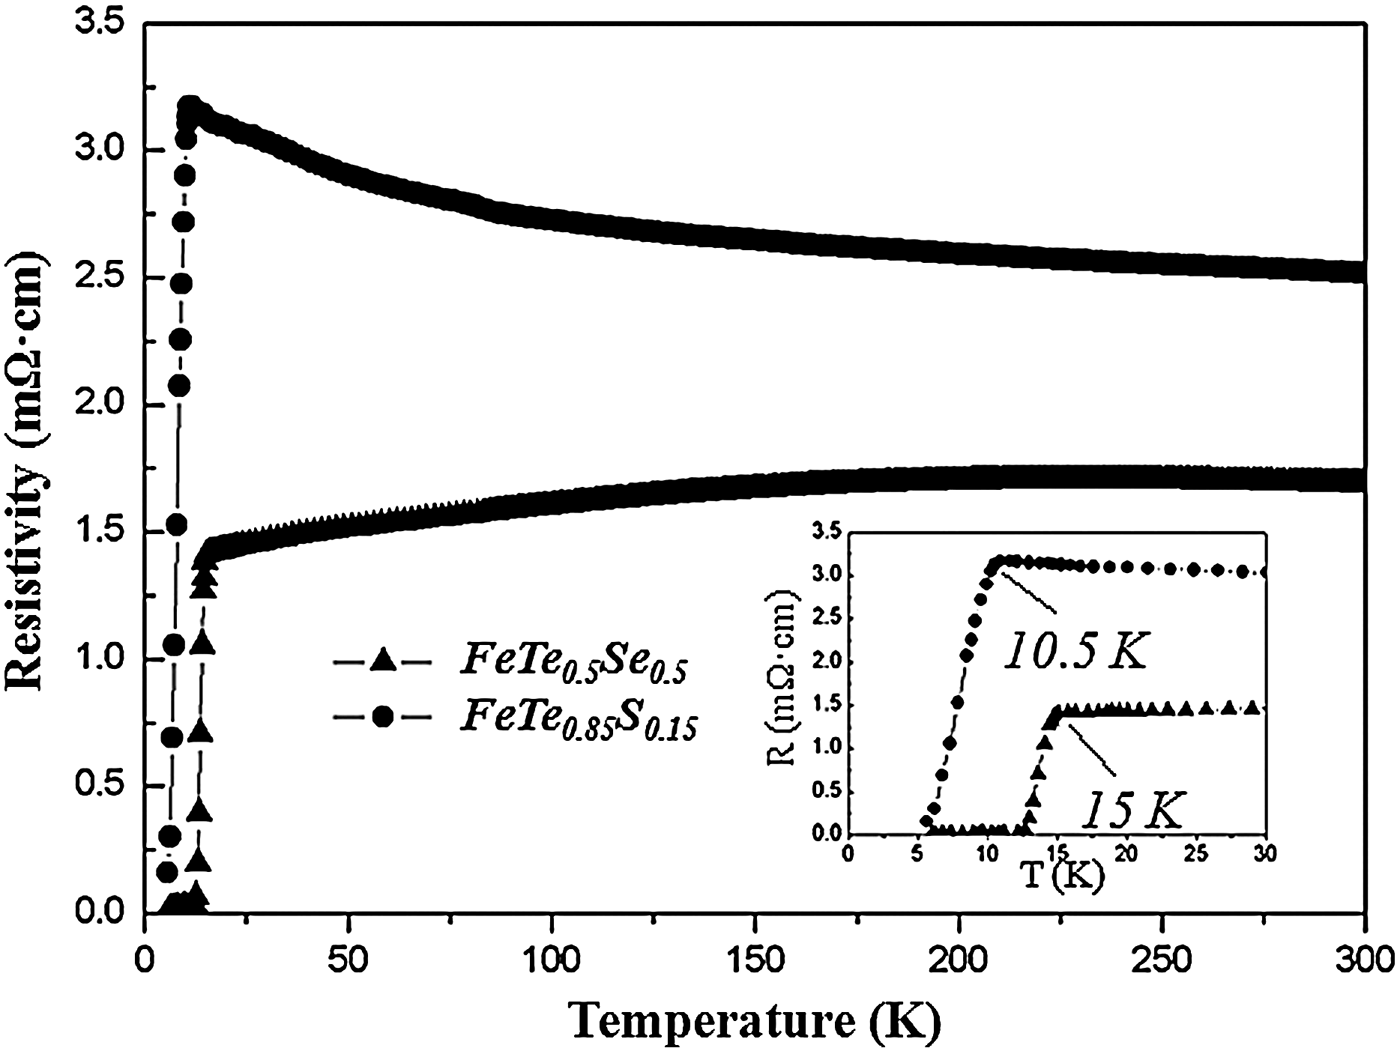
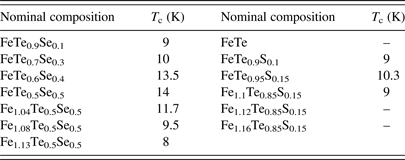
Temperature dependence of the magnetization was measured on the samples with x Se ≤ 0.5 and x S ≤ 0.15. T c values of all measured samples were listed in Table II. The maximum T c was obtained on the solid solution limit in both doping system with the Fe nominal composition y = 1. The typical curves of FeTe0.5Se0.5 and FeTe0.85S0.15 were plotted in Figure 5. It can be seen that T c mag of these two compositions is 13.5 and 10 K. The temperature dependence of electrical resistivity of these two samples was also measured and shown in Figure 6. FeTe0.5Se0.5 shows the metallic behavior while FeTe0.85S0.15 exhibits a semiconductor-like behavior. From the inset of Figure 6, T c onset was obtained at 15 and 10.5 K for these two samples. These values are in good agreement with the previous works (Fang et al., Reference Fang, Pham, Qian, Liu, Vehstedt, Liu, Spinu and Mao2008; Mizuguchi et al., Reference Mizuguchi, Tomioka, Tsuda, Yamaguchi and Takano2009a).
Temperature dependence of the magnetization of FeTe0.85S0.15 and FeTe0.5S0.5.

Temperature dependence of the resistivity of FeTe0.85S0.15 and FeTe0.5S0.5.

Critical temperature T c obtained from the magnetic susceptibility.

“–” means that T c was not observed with temperature down to 2 K.
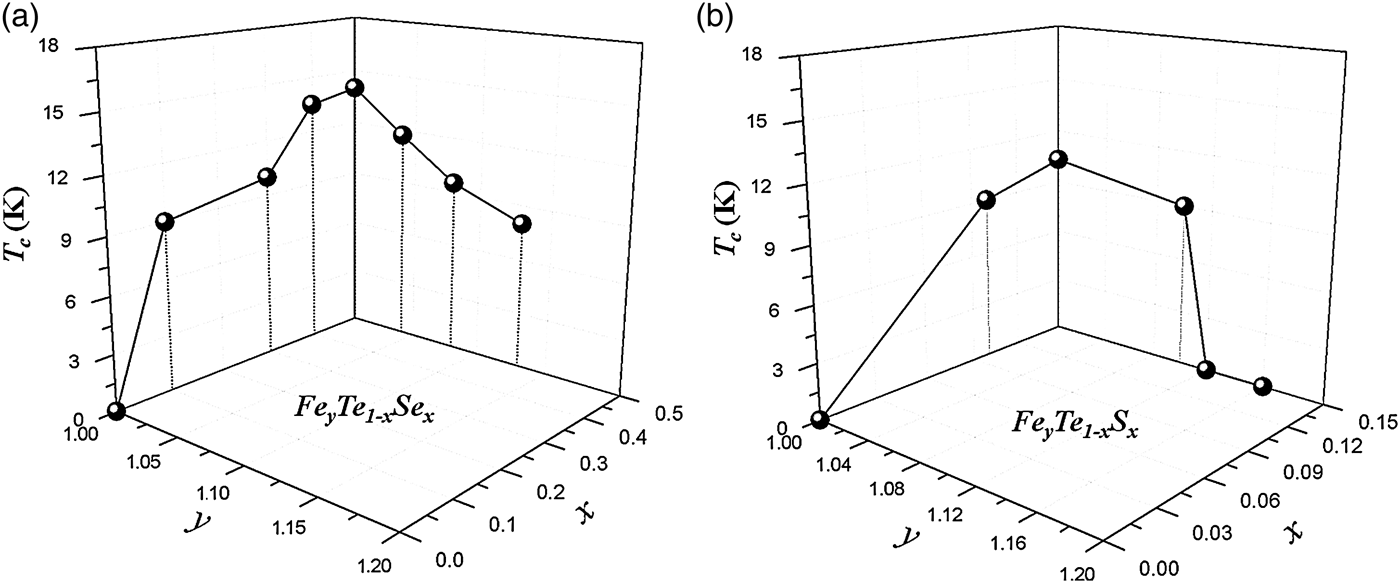
Using the superconductivity obtained from the magnetization, we presented a 3D-graph for showing T c as a function of both x and y in Fe y Te1−x X x (X = Se, S) (shown in Figure 7). It is clearly show that the superconductivity was improved by the smaller anion Se/S doping on Te-site, but suppressed by adding Fe into the system.
3D-graph of T c as a function of both x and y in (a) Fe y Te1−x Se x and (b) Fe y Te1−x S x system.

It seems that T c in the Te-site doped FeTe would be increased by simultaneously increasing the doping level of Se/S and minimizing the excess Fe in the structure. This suggests that the superconductivity in iron chalcogenides is truly enhanced by compressing the lattice, but the interstitial Fe also plays an important role. Although intercalated excess Fe ion is found to be harmful to the superconductivity in this work, T c of FeSe was increased to ~31 K with potassium intercalation (Guo et al., Reference Guo, Jin, Wang, Wang, Zhu, Zhou, He and Chen2010), and this value could be further raised to ~46 K with decreasing the K content (Ying et al., Reference Ying, Chen, Wang, Jin, Lai, Zhou, Zhang, Shen and Wang2013). It is suggested that the ion intercalation could be another effective route to adjust the superconductivity of iron chalcogenides, besides changing the lattice parameters.
IV. CONCLUSION
We present a systematic study on the solid solution and superconductivity on the Fe y Te1−x X x (X = Se, S) system. It has been found that the limit of the Te-site doping with Se and S is around 0.5 and 0.15, respectively. The solid solution with the Fe content changing is also measured in this work. Based on the magnetic susceptibility measurements, we presented a 3D-graph for showing the variation of superconductivity vs. both Se/S and Fe content. It is clearly shown that the the superconductivity was improved by Te-site doping with Se/S, and simultaneously suppressed by Fe adding.
ACKNOWLEDGEMENTS
The financial support by the National Natural Science Foundation of China (Nos. 51172025, 51472029 and 51402014) and China Postdoctoral Science Foundation (No. 2013M540860) is gratefully acknowledged.